Schematic overview of the cellular and molecular mechanisms involved in the cancer progression, including the proposed cellular and molecular mechanisms in cancer cells trajectory. AT1: alveolar type 1 cells; AT2: alveolar type 2 cells; AAH: atypical adenomatous hyperplasia; AIS: adenocarcinoma in situ; MIA: minimally invasive adenocarcinoma; IA: invasive adenocarcinoma; EMT: epithelial-mesenchymal transition

Home

Download

Statistics

Help

Contact

Center for Computational Systems Medicine
leaf

Gene summary

leaf

Malignant transformation analysis

leaf

Malignant transformation related pathway analysis

leaf

Cell-cell communication analysis

leaf

Single-cell gene regulatory network inference analysis

leaf

Somatic mutation of malignant transformation related genes

leaf

Related drugs of malignant transformation related genes

Gene: NOL9

Gene summary for NOL9

check button Gene summary.

Gene informationSpeciesHuman
Gene symbol

NOL9

Gene ID

79707

Gene namenucleolar protein 9
Gene AliasGrc3
Cytomap1p36.31
Gene Typeprotein-coding
GO ID

GO:0000448

UniProtAcc

Q5SY16


Top

Malignant transformation analysis

check button Identification of the aberrant gene expression in precancerous and cancerous lesions by comparing the gene expression of stem-like cells in diseased tissues with normal stem cells
check button Malignant transformation involving gene list.
Entrez IDSymbolReplicatesSpeciesOrganTissueAdj P-valueLog2FCMalignancy
79707NOL9LZE2THumanEsophagusESCC4.35e-025.05e-010.082
79707NOL9LZE7THumanEsophagusESCC1.27e-022.61e-010.0667
79707NOL9LZE22THumanEsophagusESCC3.89e-021.65e-010.068
79707NOL9LZE24THumanEsophagusESCC1.16e-121.62e-010.0596
79707NOL9P1T-EHumanEsophagusESCC4.29e-021.47e-010.0875
79707NOL9P2T-EHumanEsophagusESCC1.62e-314.71e-010.1177
79707NOL9P4T-EHumanEsophagusESCC9.78e-214.56e-010.1323
79707NOL9P5T-EHumanEsophagusESCC9.53e-152.28e-010.1327
79707NOL9P8T-EHumanEsophagusESCC2.08e-141.48e-010.0889
79707NOL9P9T-EHumanEsophagusESCC3.15e-048.52e-020.1131
79707NOL9P10T-EHumanEsophagusESCC1.76e-163.20e-010.116
79707NOL9P11T-EHumanEsophagusESCC1.43e-083.19e-010.1426
79707NOL9P12T-EHumanEsophagusESCC9.32e-171.90e-010.1122
79707NOL9P15T-EHumanEsophagusESCC3.40e-182.53e-010.1149
79707NOL9P16T-EHumanEsophagusESCC1.95e-112.55e-010.1153
79707NOL9P19T-EHumanEsophagusESCC8.49e-075.66e-010.1662
79707NOL9P20T-EHumanEsophagusESCC2.06e-409.32e-010.1124
79707NOL9P21T-EHumanEsophagusESCC2.02e-295.90e-010.1617
79707NOL9P22T-EHumanEsophagusESCC1.36e-111.45e-010.1236
79707NOL9P23T-EHumanEsophagusESCC1.61e-193.25e-010.108
Page: 1 2 3 4 5 

check button Transcriptomic changes along malignancy continuum.
TissueExpression DynamicsAbbreviation
EsophagusThe image shows the transcriptomic changes along malignancy continuum.log2FC in expression of this searched gene in stem-like cells from each diseased tissue sample relative to stem-like cells in normal samples in each tissue plotted against the malignancy continuum. Samples are colored based on if they are from different disease stage.ESCC: Esophageal squamous cell carcinoma
HGIN: High-grade intraepithelial neoplasias
LGIN: Low-grade intraepithelial neoplasias
LiverThe image shows the transcriptomic changes along malignancy continuum.log2FC in expression of this searched gene in stem-like cells from each diseased tissue sample relative to stem-like cells in normal samples in each tissue plotted against the malignancy continuum. Samples are colored based on if they are from different disease stage.
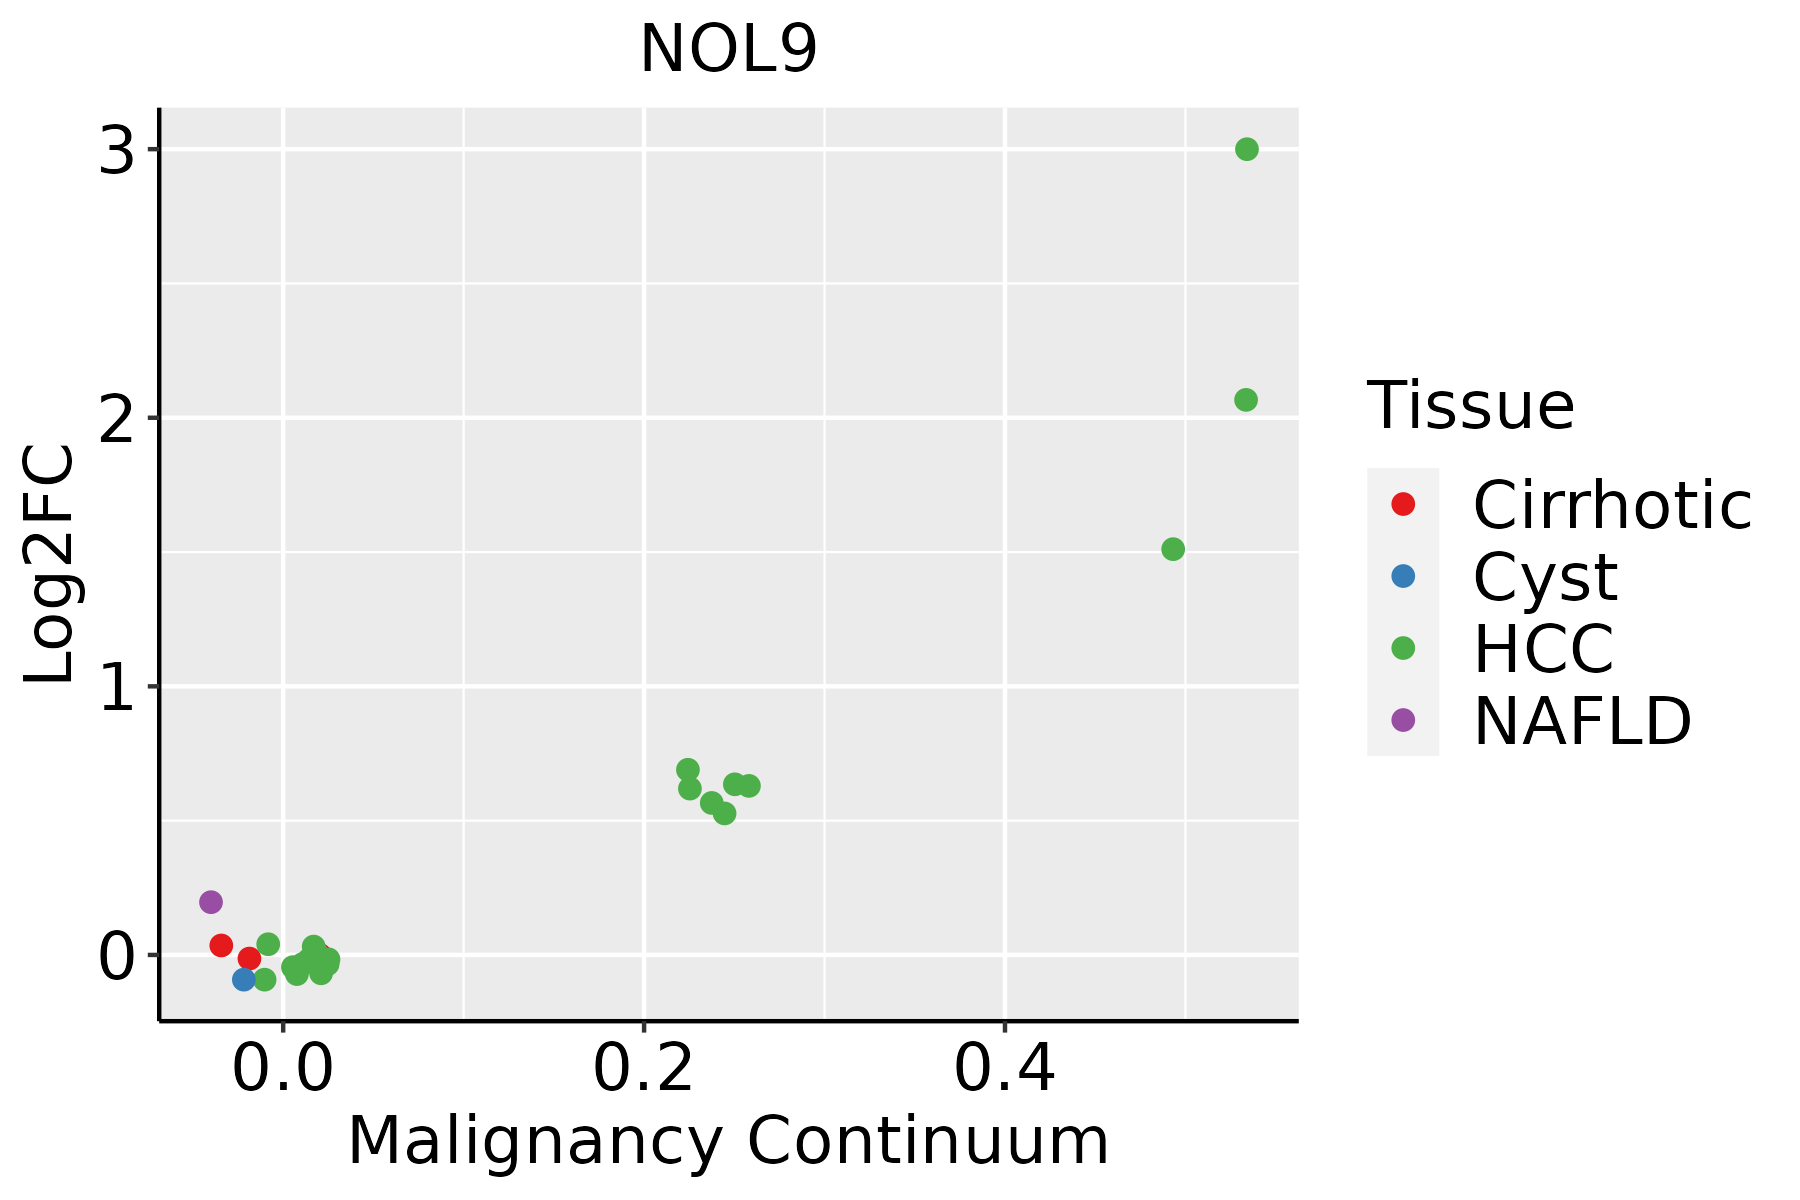
HCC: Hepatocellular carcinoma
NAFLD: Non-alcoholic fatty liver disease
Oral CavityThe image shows the transcriptomic changes along malignancy continuum.log2FC in expression of this searched gene in stem-like cells from each diseased tissue sample relative to stem-like cells in normal samples in each tissue plotted against the malignancy continuum. Samples are colored based on if they are from different disease stage.EOLP: Erosive Oral lichen planus
LP: leukoplakia
NEOLP: Non-erosive oral lichen planus
OSCC: Oral squamous cell carcinoma
ThyroidThe image shows the transcriptomic changes along malignancy continuum.log2FC in expression of this searched gene in stem-like cells from each diseased tissue sample relative to stem-like cells in normal samples in each tissue plotted against the malignancy continuum. Samples are colored based on if they are from different disease stage.ATC: Anaplastic thyroid cancer
HT: Hashimoto's thyroiditis
PTC: Papillary thyroid cancer
∗log2FC in expression of this searched gene in stem-like cells from each diseased tissue sample relative to stem-like cells in normal samples in each tissue plotted against the malignancy continuum. Samples are colored based on if they are from different disease stage.

Top

Malignant transformation related pathway analysis

check buttonFind out the enriched GO biological processes and KEGG pathways involved in transition from healthy to precancer to cancer
check button Figure of enriched GO biological processes.
TissueDisease StageEnriched GO biological Processes
ColorectumADGO analysis - Figure of enriched GO biological processes: Top 15 enriched GO BP terms are showed in the bar plot of each disease state in each tissue. Each row represents a significant GO biological process which is colored according to the -log10(p.adjust).
ColorectumSERGO analysis - Figure of enriched GO biological processes: Top 15 enriched GO BP terms are showed in the bar plot of each disease state in each tissue. Each row represents a significant GO biological process which is colored according to the -log10(p.adjust).
ColorectumMSSGO analysis - Figure of enriched GO biological processes: Top 15 enriched GO BP terms are showed in the bar plot of each disease state in each tissue. Each row represents a significant GO biological process which is colored according to the -log10(p.adjust).
ColorectumMSI-HGO analysis - Figure of enriched GO biological processes: Top 15 enriched GO BP terms are showed in the bar plot of each disease state in each tissue. Each row represents a significant GO biological process which is colored according to the -log10(p.adjust).
ColorectumFAPGO analysis - Figure of enriched GO biological processes: Top 15 enriched GO BP terms are showed in the bar plot of each disease state in each tissue. Each row represents a significant GO biological process which is colored according to the -log10(p.adjust).
∗Top 15 enriched GO BP terms are showed in the bar plot of each disease state in each tissue. Each row represents a significant GO biological process which is colored according to the -log10(p.adjust).
Page: 1 2 3 4 5 6 7 8 9 

check button Enriched GO biological processes.
GO IDTissueDisease StageDescriptionGene RatioBg Ratiopvaluep.adjustCount
GO:0022613111EsophagusESCCribonucleoprotein complex biogenesis365/8552463/187231.74e-491.11e-45365
GO:0042254111EsophagusESCCribosome biogenesis252/8552299/187233.27e-441.04e-40252
GO:003447015EsophagusESCCncRNA processing300/8552395/187233.09e-353.26e-32300
GO:0016072110EsophagusESCCrRNA metabolic process197/8552236/187231.31e-331.18e-30197
GO:0006364110EsophagusESCCrRNA processing189/8552225/187234.88e-333.87e-30189
GO:003466012EsophagusESCCncRNA metabolic process346/8552485/187234.35e-312.51e-28346
GO:0042273111EsophagusESCCribosomal large subunit biogenesis65/855272/187231.53e-159.82e-1465
GO:00905013EsophagusESCCRNA phosphodiester bond hydrolysis110/8552152/187231.95e-116.81e-10110
GO:000047016EsophagusESCCmaturation of LSU-rRNA27/855228/187239.94e-092.00e-0727
GO:00903053EsophagusESCCnucleic acid phosphodiester bond hydrolysis163/8552261/187233.07e-085.73e-07163
GO:00004603EsophagusESCCmaturation of 5.8S rRNA30/855235/187231.07e-061.34e-0530
GO:00004693EsophagusESCCcleavage involved in rRNA processing24/855227/187233.48e-063.84e-0524
GO:00004634EsophagusESCCmaturation of LSU-rRNA from tricistronic rRNA transcript (SSU-rRNA, 5.8S rRNA, LSU-rRNA)15/855215/187237.81e-067.69e-0515
GO:00004663EsophagusESCCmaturation of 5.8S rRNA from tricistronic rRNA transcript (SSU-rRNA, 5.8S rRNA, LSU-rRNA)21/855224/187232.57e-052.17e-0421
GO:00905023EsophagusESCCRNA phosphodiester bond hydrolysis, endonucleolytic55/855282/187237.34e-055.51e-0455
GO:00004783EsophagusESCCendonucleolytic cleavage involved in rRNA processing14/855215/187231.47e-049.85e-0414
GO:00004793EsophagusESCCendonucleolytic cleavage of tricistronic rRNA transcript (SSU-rRNA, 5.8S rRNA, LSU-rRNA)14/855215/187231.47e-049.85e-0414
GO:002261322LiverHCCribonucleoprotein complex biogenesis355/7958463/187237.76e-524.92e-48355
GO:004225422LiverHCCribosome biogenesis246/7958299/187234.99e-461.58e-42246
GO:00344702LiverHCCncRNA processing293/7958395/187234.26e-386.76e-35293
Page: 1 2 3 4 5 

check button Enriched KEGG pathways.
Pathway IDTissueDisease StageDescriptionGene RatioBg Ratiopvaluep.adjustqvalueCount
Page: 1 

Top

Cell-cell communication analysis

check buttonIdentification of potential cell-cell interactions between two cell types and their ligand-receptor pairs for different disease states
LigandReceptorLRpairPathwayTissueDisease Stage
Page: 1 

Top

Single-cell gene regulatory network inference analysis

check buttonFind out the significant the regulons (TFs) and the target genes of each regulon across cell types for different disease states
TFCell TypeTissueDisease StageTarget GeneRSSRegulon Activity
∗The dot plots of a searched regulon are shown for all cell subpopulations in each disease state of each tissue based on the regulon specific score inferred using pySCENIC and by calculating the average expression.
Page: 1 

Top

Somatic mutation of malignant transformation related genes

check buttonAnnotation of somatic variants for genes involved in malignant transformation
Hugo SymbolVariant ClassVariant ClassificationdbSNP RSHGVScHGVSpHGVSp ShortSWISSPROTBIOTYPESIFTPolyPhenTumor Sample BarcodeTissueHistologySexAgeStageTherapy TypesDrugsOutcome
NOL9insertionIn_Frame_Insnovelc.1735_1736insAGCCGAGACGGTGTCAGGGCCGCCTCCAAGGCCp.Gly579delinsGluProArgArgCysGlnGlyArgLeuGlnGlyArgp.G579delinsEPRRCQGRLQGRQ5SY16protein_codingTCGA-A2-A04V-01Breastbreast invasive carcinomaFemale<65I/IIChemotherapycytoxanPD
NOL9insertionFrame_Shift_Insnovelc.533_534insTAACGTTTATAGTTTAGCCGAGGAGATGGCAGTCCTAAAGGp.Leu179AsnfsTer27p.L179Nfs*27Q5SY16protein_codingTCGA-A2-A0D1-01Breastbreast invasive carcinomaFemale>=65I/IIChemotherapytaxotereSD
NOL9insertionFrame_Shift_Insnovelc.1612_1613insTAGCGGCAGGTAGp.Pro538LeufsTer11p.P538Lfs*11Q5SY16protein_codingTCGA-A7-A0CG-01Breastbreast invasive carcinomaFemale>=65I/IIUnknownUnknownSD
NOL9SNVMissense_Mutationnovelc.1987G>Ap.Val663Ilep.V663IQ5SY16protein_codingtolerated(0.32)benign(0.007)TCGA-EA-A3HU-01Cervixcervical & endocervical cancerFemale<65I/IIUnknownUnknownSD
NOL9SNVMissense_Mutationc.1849N>Cp.Glu617Glnp.E617QQ5SY16protein_codingtolerated(0.05)probably_damaging(0.917)TCGA-EA-A6QX-01Cervixcervical & endocervical cancerFemale<65III/IVUnknownUnknownSD
NOL9SNVMissense_Mutationc.967T>Gp.Leu323Valp.L323VQ5SY16protein_codingdeleterious(0)probably_damaging(0.946)TCGA-FU-A3HZ-01Cervixcervical & endocervical cancerFemale<65I/IIChemotherapycisplatinCR
NOL9SNVMissense_Mutationc.731N>Gp.Ile244Serp.I244SQ5SY16protein_codingdeleterious(0.02)benign(0.143)TCGA-AA-3509-01Colorectumcolon adenocarcinomaFemale<65I/IIUnknownUnknownSD
NOL9SNVMissense_Mutationc.1459N>Gp.Ser487Glyp.S487GQ5SY16protein_codingtolerated(0.13)benign(0.011)TCGA-AA-3982-01Colorectumcolon adenocarcinomaMale>=65III/IVUnknownUnknownSD
NOL9SNVMissense_Mutationc.1394N>Tp.Arg465Ilep.R465IQ5SY16protein_codingdeleterious(0)probably_damaging(0.943)TCGA-AA-3984-01Colorectumcolon adenocarcinomaFemale<65I/IIUnknownUnknownSD
NOL9SNVMissense_Mutationc.1846A>Tp.Met616Leup.M616LQ5SY16protein_codingdeleterious(0.01)possibly_damaging(0.621)TCGA-AA-A01D-01Colorectumcolon adenocarcinomaFemale<65III/IVChemotherapycapecitabinePD
Page: 1 2 3 4 5 

Top

Related drugs of malignant transformation related genes

check buttonIdentification of chemicals and drugs interact with genes involved in malignant transfromation
(DGIdb 4.0)
Entrez IDSymbolCategoryInteraction TypesDrug Claim NameDrug NamePMIDs
Page: 1