
|
|||||
|
 | |
| |
| |
| |
| |
| |
|
Gene: NOL4L |
Gene summary for NOL4L |
| Gene information | Species | Human | Gene symbol | NOL4L | Gene ID | 140688 |
| Gene name | nucleolar protein 4 like | |
| Gene Alias | C20orf112 | |
| Cytomap | 20q11.21 | |
| Gene Type | protein-coding | GO ID | GO:0005575 | UniProtAcc | A0A087X0N3 |
Top |
Malignant transformation analysis |
| Identification of the aberrant gene expression in precancerous and cancerous lesions by comparing the gene expression of stem-like cells in diseased tissues with normal stem cells |
| Entrez ID | Symbol | Replicates | Species | Organ | Tissue | Adj P-value | Log2FC | Malignancy |
| 140688 | NOL4L | HTA11_99999971662_82457 | Human | Colorectum | MSS | 2.90e-09 | 5.87e-01 | 0.3859 |
| 140688 | NOL4L | A015-C-203 | Human | Colorectum | FAP | 4.19e-08 | -9.41e-02 | -0.1294 |
| 140688 | NOL4L | A002-C-201 | Human | Colorectum | FAP | 5.51e-03 | -1.07e-01 | 0.0324 |
| 140688 | NOL4L | A001-C-108 | Human | Colorectum | FAP | 4.19e-06 | -1.35e-01 | -0.0272 |
| 140688 | NOL4L | A002-C-205 | Human | Colorectum | FAP | 2.05e-06 | -1.52e-01 | -0.1236 |
| 140688 | NOL4L | A001-C-104 | Human | Colorectum | FAP | 1.97e-02 | -1.03e-01 | 0.0184 |
| 140688 | NOL4L | A015-C-006 | Human | Colorectum | FAP | 2.42e-03 | -8.49e-02 | -0.0994 |
| 140688 | NOL4L | A015-C-106 | Human | Colorectum | FAP | 1.56e-05 | -1.55e-01 | -0.0511 |
| 140688 | NOL4L | A002-C-114 | Human | Colorectum | FAP | 2.42e-05 | -1.72e-01 | -0.1561 |
| 140688 | NOL4L | A015-C-104 | Human | Colorectum | FAP | 2.78e-09 | -1.03e-01 | -0.1899 |
| 140688 | NOL4L | A001-C-014 | Human | Colorectum | FAP | 1.02e-06 | -1.62e-01 | 0.0135 |
| 140688 | NOL4L | A002-C-016 | Human | Colorectum | FAP | 2.20e-06 | -1.61e-01 | 0.0521 |
| 140688 | NOL4L | A001-C-203 | Human | Colorectum | FAP | 1.13e-04 | -8.92e-02 | -0.0481 |
| 140688 | NOL4L | A002-C-116 | Human | Colorectum | FAP | 4.66e-08 | -1.07e-01 | -0.0452 |
| 140688 | NOL4L | A014-C-008 | Human | Colorectum | FAP | 9.80e-03 | -9.46e-02 | -0.191 |
| 140688 | NOL4L | A018-E-020 | Human | Colorectum | FAP | 2.32e-05 | -1.51e-01 | -0.2034 |
| 140688 | NOL4L | F034 | Human | Colorectum | FAP | 6.92e-07 | -1.27e-01 | -0.0665 |
| 140688 | NOL4L | P2T-E | Human | Esophagus | ESCC | 4.60e-14 | 8.75e-02 | 0.1177 |
| 140688 | NOL4L | P8T-E | Human | Esophagus | ESCC | 1.85e-30 | 3.80e-01 | 0.0889 |
| 140688 | NOL4L | P10T-E | Human | Esophagus | ESCC | 6.05e-09 | 2.13e-01 | 0.116 |
| Page: 1 2 3 |
| Tissue | Expression Dynamics | Abbreviation |
| Colorectum (GSE201348) |  | FAP: Familial adenomatous polyposis |
| CRC: Colorectal cancer | ||
| Colorectum (HTA11) |  | AD: Adenomas |
| SER: Sessile serrated lesions | ||
| MSI-H: Microsatellite-high colorectal cancer | ||
| MSS: Microsatellite stable colorectal cancer | ||
| Esophagus | 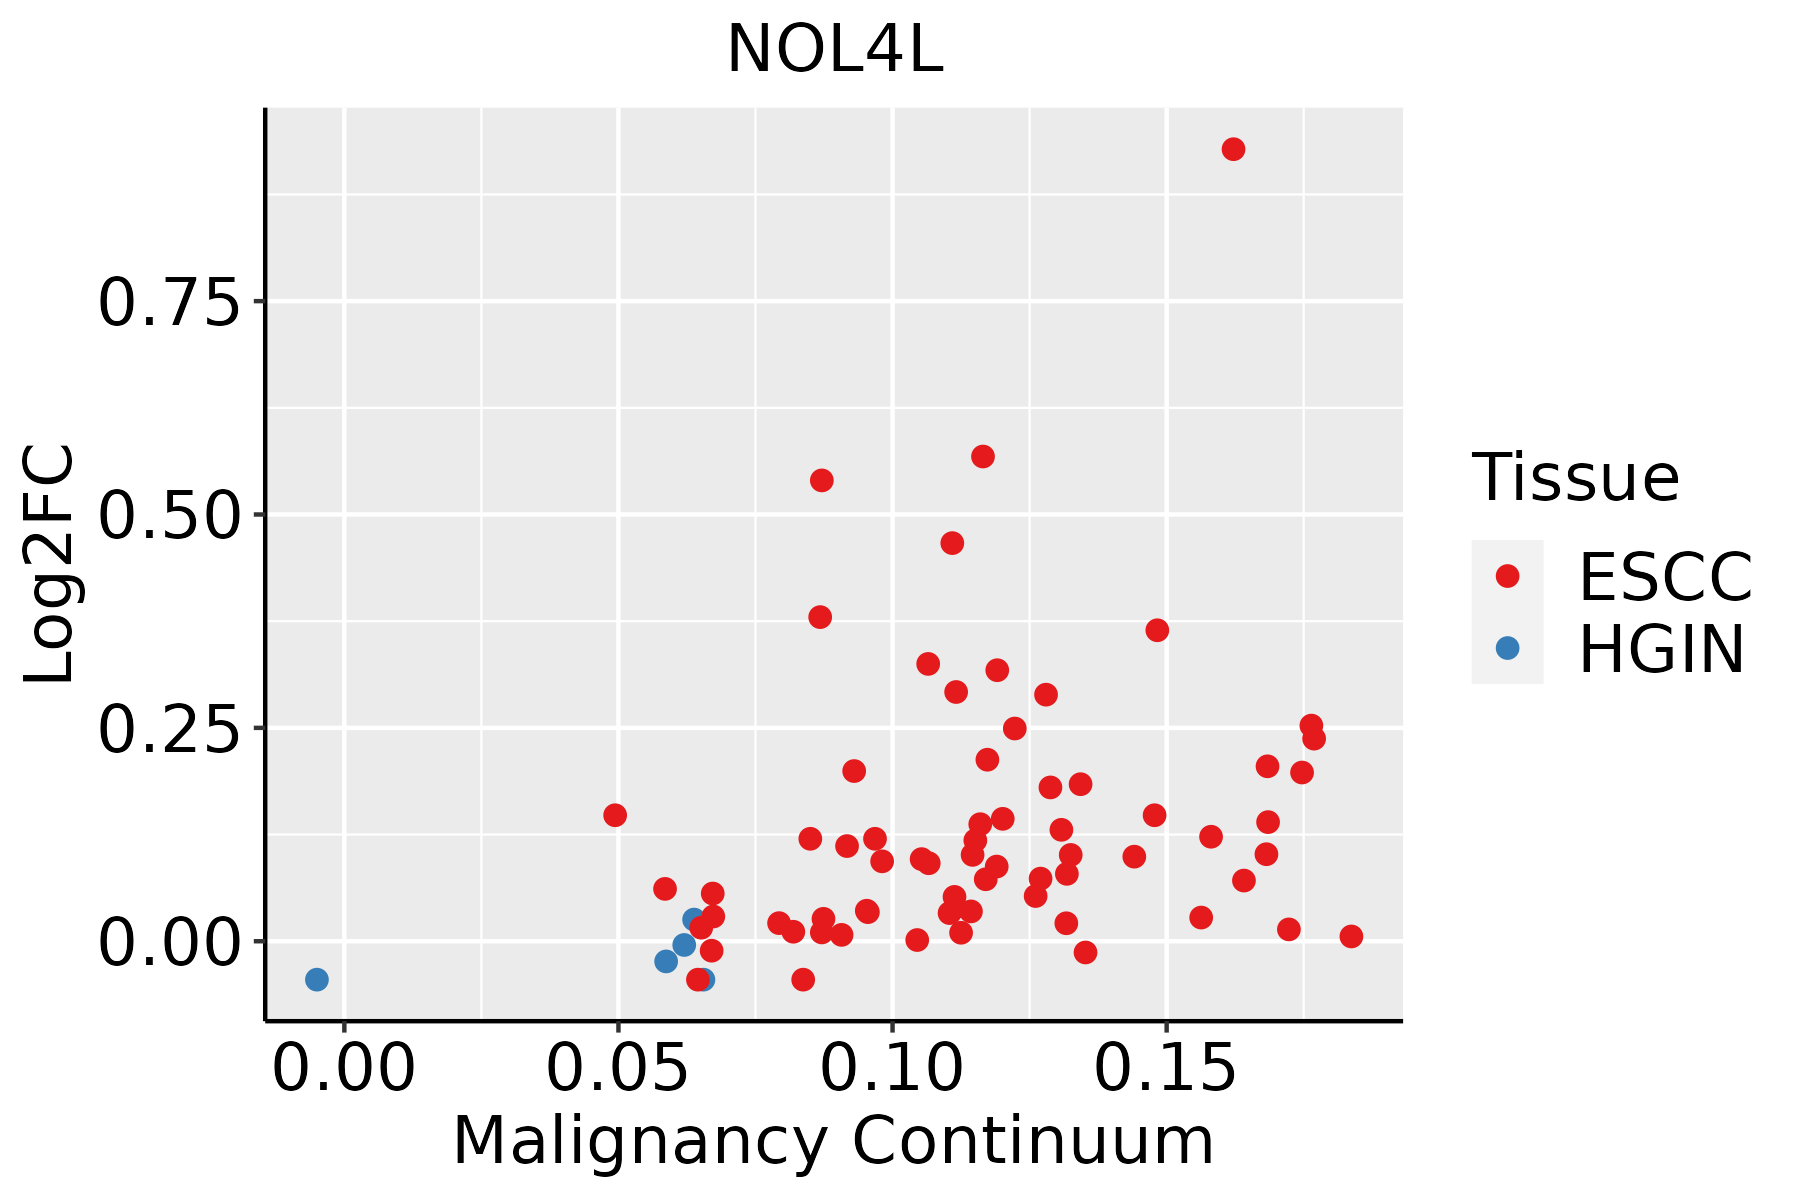 | ESCC: Esophageal squamous cell carcinoma |
| HGIN: High-grade intraepithelial neoplasias | ||
| LGIN: Low-grade intraepithelial neoplasias |
| ∗log2FC in expression of this searched gene in stem-like cells from each diseased tissue sample relative to stem-like cells in normal samples in each tissue plotted against the malignancy continuum. Samples are colored based on if they are from different disease stage. |
Top |
Malignant transformation related pathway analysis |
| Find out the enriched GO biological processes and KEGG pathways involved in transition from healthy to precancer to cancer |
| Tissue | Disease Stage | Enriched GO biological Processes |
| Colorectum | AD |  |
| Colorectum | SER |  |
| Colorectum | MSS |  |
| Colorectum | MSI-H |  |
| Colorectum | FAP |  |
| ∗Top 15 enriched GO BP terms are showed in the bar plot of each disease state in each tissue. Each row represents a significant GO biological process which is colored according to the -log10(p.adjust). |
| Page: 1 2 3 4 5 6 7 8 9 |
| GO ID | Tissue | Disease Stage | Description | Gene Ratio | Bg Ratio | pvalue | p.adjust | Count |
| Page: 1 |
| Pathway ID | Tissue | Disease Stage | Description | Gene Ratio | Bg Ratio | pvalue | p.adjust | qvalue | Count |
| Page: 1 |
Top |
Cell-cell communication analysis |
| Identification of potential cell-cell interactions between two cell types and their ligand-receptor pairs for different disease states |
| Ligand | Receptor | LRpair | Pathway | Tissue | Disease Stage |
| Page: 1 |
Top |
Single-cell gene regulatory network inference analysis |
| Find out the significant the regulons (TFs) and the target genes of each regulon across cell types for different disease states |
| TF | Cell Type | Tissue | Disease Stage | Target Gene | RSS | Regulon Activity |
| ∗The dot plots of a searched regulon are shown for all cell subpopulations in each disease state of each tissue based on the regulon specific score inferred using pySCENIC and by calculating the average expression. |
| Page: 1 |
Top |
Somatic mutation of malignant transformation related genes |
| Annotation of somatic variants for genes involved in malignant transformation |
| Hugo Symbol | Variant Class | Variant Classification | dbSNP RS | HGVSc | HGVSp | HGVSp Short | SWISSPROT | BIOTYPE | SIFT | PolyPhen | Tumor Sample Barcode | Tissue | Histology | Sex | Age | Stage | Therapy Types | Drugs | Outcome |
| NOL4L | SNV | Missense_Mutation | novel | c.245N>G | p.Ser82Cys | p.S82C | protein_coding | deleterious(0) | possibly_damaging(0.734) | TCGA-3C-AALI-01 | Breast | breast invasive carcinoma | Female | <65 | I/II | Unspecific | Poly E | Complete Response | |
| NOL4L | SNV | Missense_Mutation | c.1448N>A | p.Arg483His | p.R483H | protein_coding | deleterious(0) | probably_damaging(0.998) | TCGA-D8-A1XU-01 | Breast | breast invasive carcinoma | Female | <65 | I/II | Unknown | Unknown | SD | ||
| NOL4L | SNV | Missense_Mutation | c.1441N>T | p.Arg481Cys | p.R481C | protein_coding | deleterious(0) | probably_damaging(0.999) | TCGA-D8-A1Y1-01 | Breast | breast invasive carcinoma | Female | >=65 | III/IV | Hormone Therapy | tamoxiphen | PD | ||
| NOL4L | deletion | Frame_Shift_Del | c.1128delC | p.Tyr377ThrfsTer20 | p.Y377Tfs*20 | protein_coding | TCGA-BH-A0HA-01 | Breast | breast invasive carcinoma | Female | <65 | I/II | Unknown | Unknown | SD | ||||
| NOL4L | deletion | Frame_Shift_Del | c.1128delN | p.Tyr377ThrfsTer20 | p.Y377Tfs*20 | protein_coding | TCGA-BH-A18G-01 | Breast | breast invasive carcinoma | Female | >=65 | I/II | Unknown | Unknown | SD | ||||
| NOL4L | SNV | Missense_Mutation | c.1892N>C | p.Ser631Thr | p.S631T | protein_coding | tolerated(0.14) | benign(0.075) | TCGA-EK-A2PM-01 | Cervix | cervical & endocervical cancer | Female | >=65 | I/II | Unknown | Unknown | SD | ||
| NOL4L | SNV | Missense_Mutation | rs139591950 | c.809N>A | p.Arg270Gln | p.R270Q | protein_coding | tolerated(0.71) | possibly_damaging(0.776) | TCGA-IR-A3LA-01 | Cervix | cervical & endocervical cancer | Female | <65 | I/II | Chemotherapy | cisplatin | CR | |
| NOL4L | SNV | Missense_Mutation | c.472N>G | p.Arg158Gly | p.R158G | protein_coding | deleterious(0) | possibly_damaging(0.611) | TCGA-IR-A3LA-01 | Cervix | cervical & endocervical cancer | Female | <65 | I/II | Chemotherapy | cisplatin | CR | ||
| NOL4L | SNV | Missense_Mutation | novel | c.214N>A | p.Glu72Lys | p.E72K | protein_coding | tolerated(0.21) | probably_damaging(0.955) | TCGA-IR-A3LK-01 | Cervix | cervical & endocervical cancer | Female | >=65 | I/II | Chemotherapy | cisplatin | PD | |
| NOL4L | SNV | Missense_Mutation | novel | c.1634N>A | p.Ala545Asp | p.A545D | protein_coding | deleterious(0.02) | possibly_damaging(0.576) | TCGA-VS-A8QC-01 | Cervix | cervical & endocervical cancer | Female | <65 | I/II | Chemotherapy | paclitaxel | PD |
| Page: 1 2 3 4 5 6 7 |
Top |
Related drugs of malignant transformation related genes |
| Identification of chemicals and drugs interact with genes involved in malignant transfromation |
| (DGIdb 4.0) |
| Entrez ID | Symbol | Category | Interaction Types | Drug Claim Name | Drug Name | PMIDs |
| Page: 1 |

Copyright 2023-Present -The University of Texas Health Science Center at Houston |