
|
|||||
|
 | |
| |
| |
| |
| |
| |
|
Gene: NOL12 |
Gene summary for NOL12 |
| Gene information | Species | Human | Gene symbol | NOL12 | Gene ID | 79159 |
| Gene name | nucleolar protein 12 | |
| Gene Alias | Nop25 | |
| Cytomap | 22q13.1 | |
| Gene Type | protein-coding | GO ID | GO:0005575 | UniProtAcc | A0A024R1M6 |
Top |
Malignant transformation analysis |
| Identification of the aberrant gene expression in precancerous and cancerous lesions by comparing the gene expression of stem-like cells in diseased tissues with normal stem cells |
| Entrez ID | Symbol | Replicates | Species | Organ | Tissue | Adj P-value | Log2FC | Malignancy |
| 79159 | NOL12 | LZE4T | Human | Esophagus | ESCC | 5.47e-11 | 2.73e-01 | 0.0811 |
| 79159 | NOL12 | LZE5T | Human | Esophagus | ESCC | 2.43e-03 | 2.83e-01 | 0.0514 |
| 79159 | NOL12 | LZE7T | Human | Esophagus | ESCC | 9.18e-12 | 4.66e-01 | 0.0667 |
| 79159 | NOL12 | LZE8T | Human | Esophagus | ESCC | 1.24e-06 | 2.08e-01 | 0.067 |
| 79159 | NOL12 | LZE20T | Human | Esophagus | ESCC | 1.46e-08 | 2.25e-01 | 0.0662 |
| 79159 | NOL12 | LZE22T | Human | Esophagus | ESCC | 2.36e-02 | 2.55e-01 | 0.068 |
| 79159 | NOL12 | LZE24T | Human | Esophagus | ESCC | 3.25e-19 | 3.89e-01 | 0.0596 |
| 79159 | NOL12 | LZE21T | Human | Esophagus | ESCC | 2.16e-09 | 5.22e-01 | 0.0655 |
| 79159 | NOL12 | LZE6T | Human | Esophagus | ESCC | 5.18e-09 | 3.29e-01 | 0.0845 |
| 79159 | NOL12 | P1T-E | Human | Esophagus | ESCC | 1.26e-13 | 6.02e-01 | 0.0875 |
| 79159 | NOL12 | P2T-E | Human | Esophagus | ESCC | 2.74e-23 | 4.51e-01 | 0.1177 |
| 79159 | NOL12 | P4T-E | Human | Esophagus | ESCC | 3.34e-20 | 4.39e-01 | 0.1323 |
| 79159 | NOL12 | P5T-E | Human | Esophagus | ESCC | 6.18e-19 | 4.23e-01 | 0.1327 |
| 79159 | NOL12 | P8T-E | Human | Esophagus | ESCC | 8.78e-20 | 3.77e-01 | 0.0889 |
| 79159 | NOL12 | P9T-E | Human | Esophagus | ESCC | 1.86e-17 | 3.54e-01 | 0.1131 |
| 79159 | NOL12 | P10T-E | Human | Esophagus | ESCC | 1.01e-33 | 5.50e-01 | 0.116 |
| 79159 | NOL12 | P11T-E | Human | Esophagus | ESCC | 3.53e-13 | 4.15e-01 | 0.1426 |
| 79159 | NOL12 | P12T-E | Human | Esophagus | ESCC | 4.63e-19 | 3.21e-01 | 0.1122 |
| 79159 | NOL12 | P15T-E | Human | Esophagus | ESCC | 3.03e-21 | 4.51e-01 | 0.1149 |
| 79159 | NOL12 | P16T-E | Human | Esophagus | ESCC | 5.53e-28 | 5.28e-01 | 0.1153 |
| Page: 1 2 3 4 |
| Tissue | Expression Dynamics | Abbreviation |
| Esophagus | 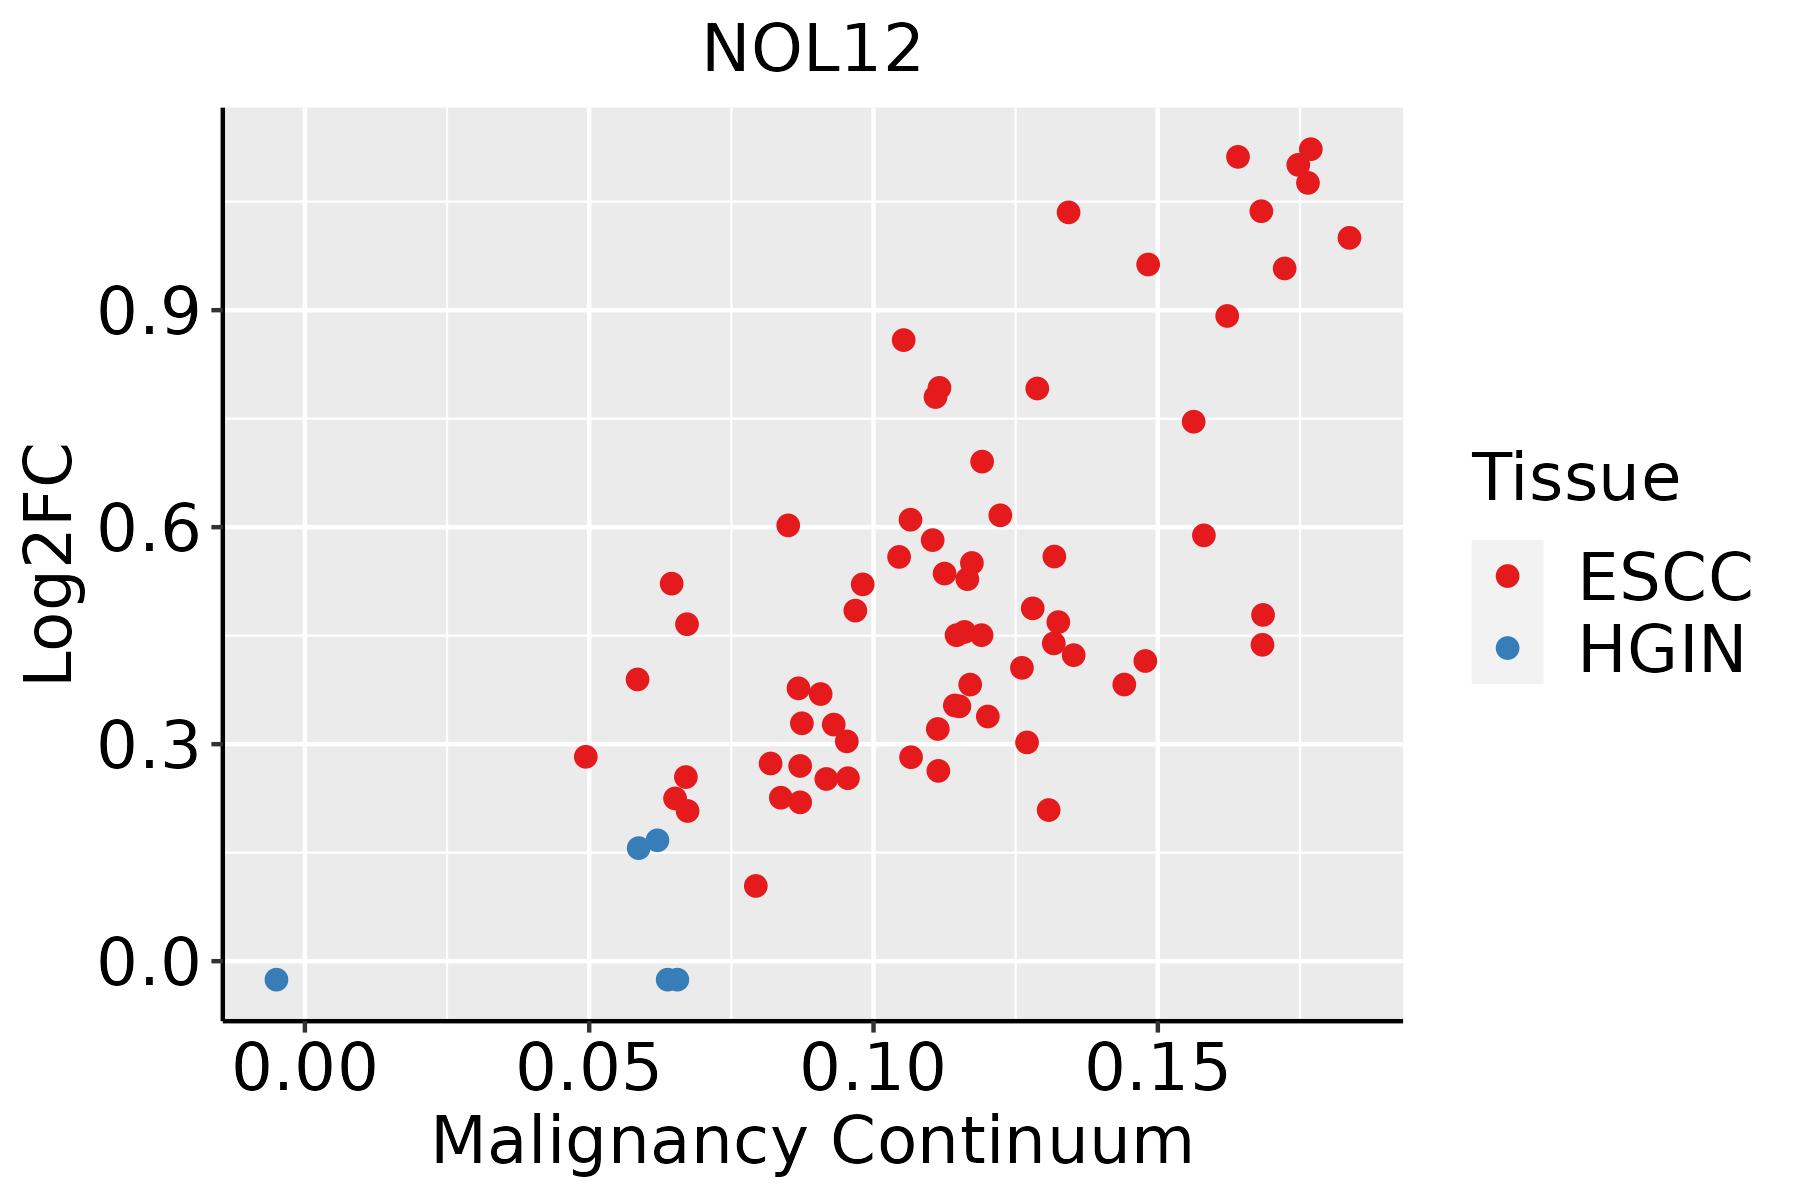 | ESCC: Esophageal squamous cell carcinoma |
| HGIN: High-grade intraepithelial neoplasias | ||
| LGIN: Low-grade intraepithelial neoplasias | ||
| Liver | 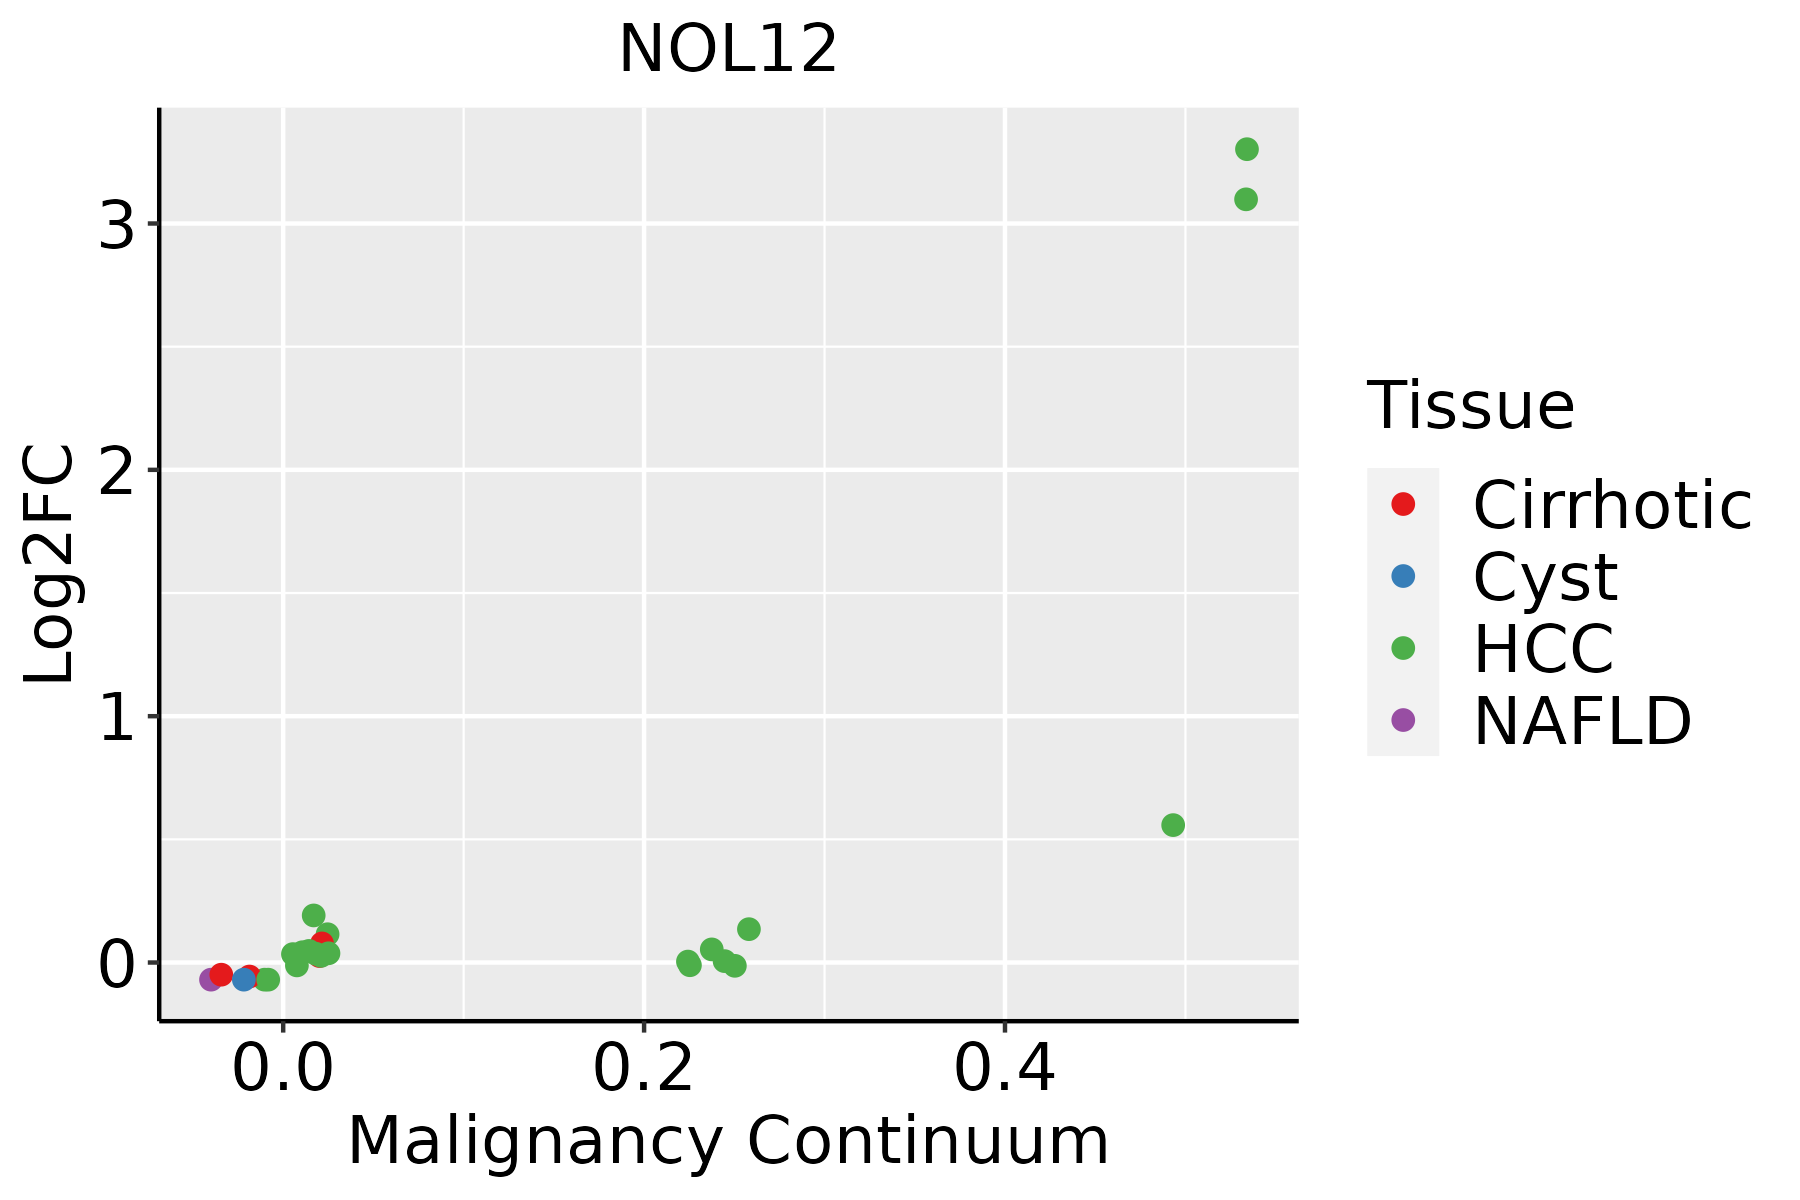 | HCC: Hepatocellular carcinoma |
| NAFLD: Non-alcoholic fatty liver disease | ||
| Skin | 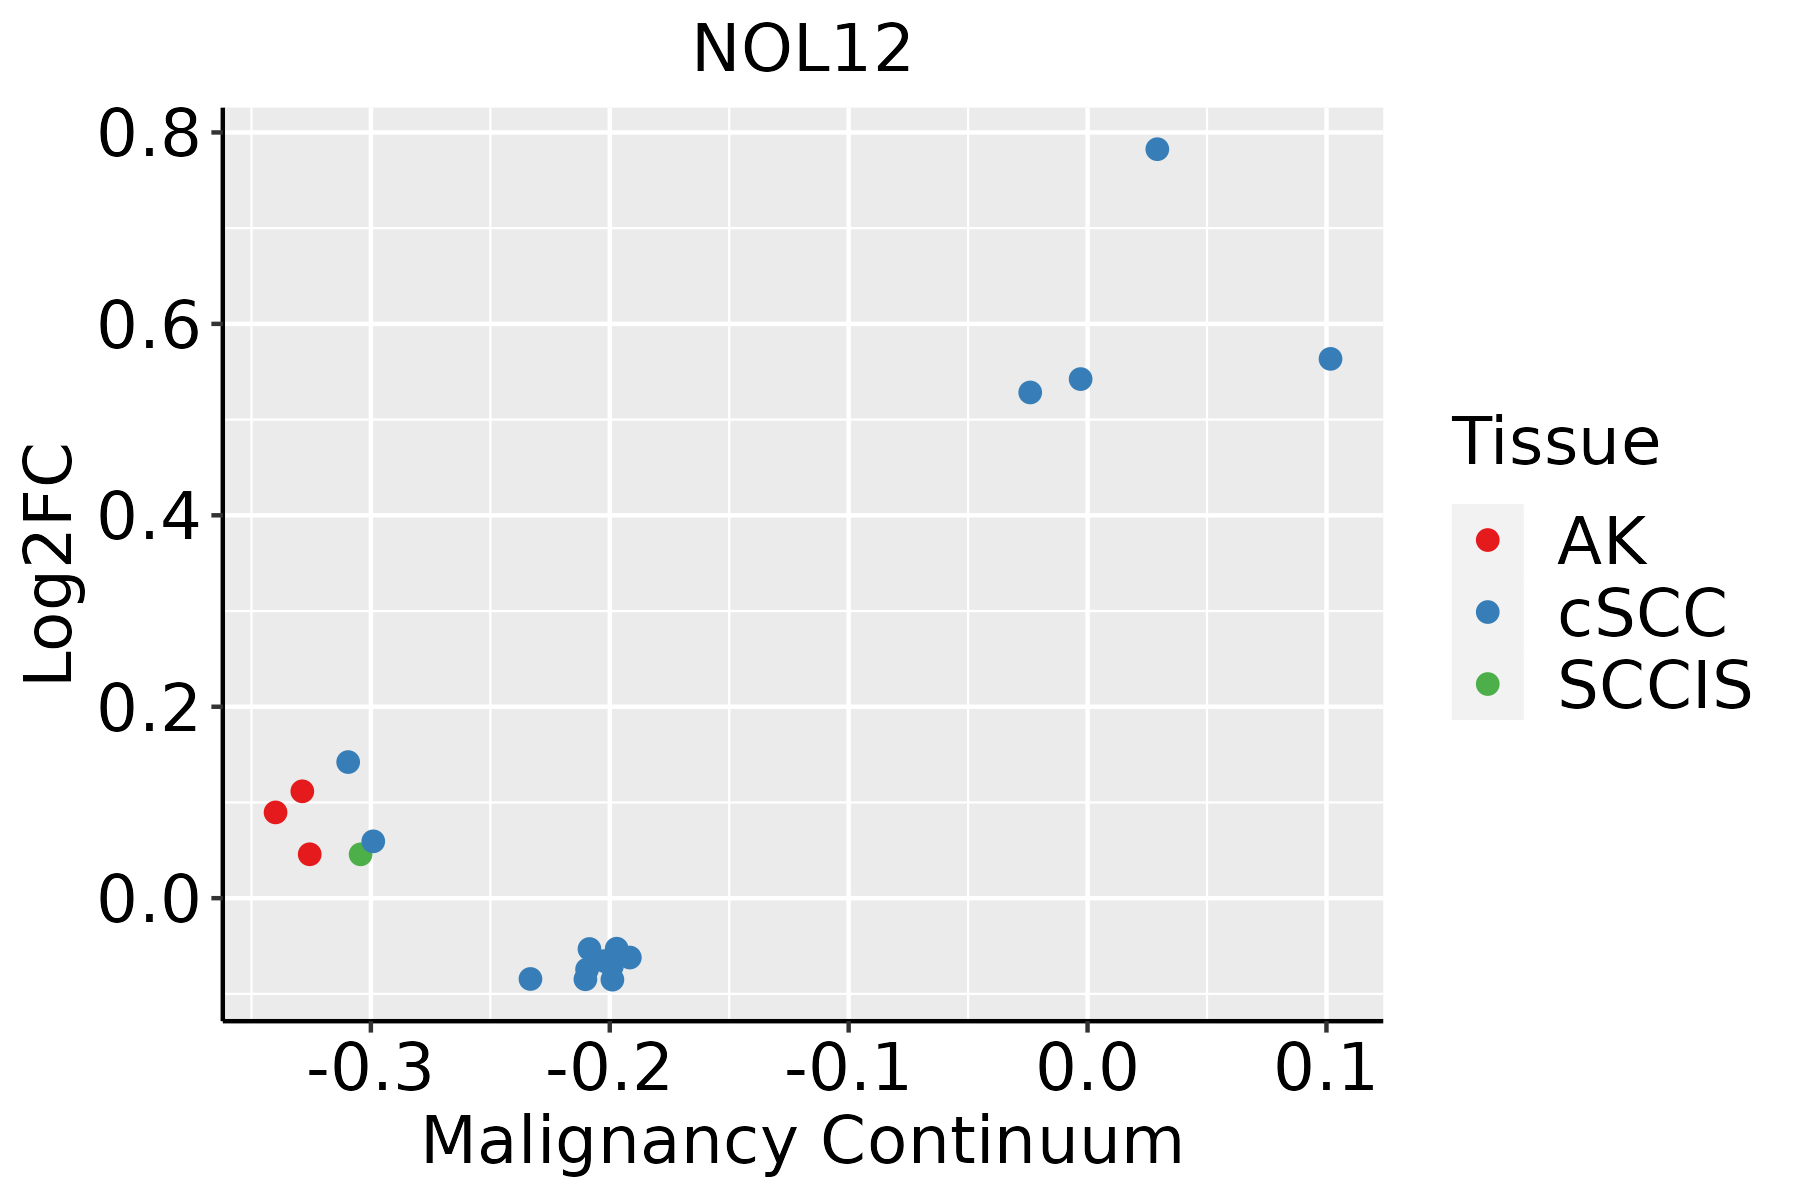 | AK: Actinic keratosis |
| cSCC: Cutaneous squamous cell carcinoma | ||
| SCCIS:squamous cell carcinoma in situ |
| ∗log2FC in expression of this searched gene in stem-like cells from each diseased tissue sample relative to stem-like cells in normal samples in each tissue plotted against the malignancy continuum. Samples are colored based on if they are from different disease stage. |
Top |
Malignant transformation related pathway analysis |
| Find out the enriched GO biological processes and KEGG pathways involved in transition from healthy to precancer to cancer |
| Tissue | Disease Stage | Enriched GO biological Processes |
| Colorectum | AD |  |
| Colorectum | SER |  |
| Colorectum | MSS |  |
| Colorectum | MSI-H |  |
| Colorectum | FAP |  |
| ∗Top 15 enriched GO BP terms are showed in the bar plot of each disease state in each tissue. Each row represents a significant GO biological process which is colored according to the -log10(p.adjust). |
| Page: 1 2 3 4 5 6 7 8 9 |
| GO ID | Tissue | Disease Stage | Description | Gene Ratio | Bg Ratio | pvalue | p.adjust | Count |
| Page: 1 |
| Pathway ID | Tissue | Disease Stage | Description | Gene Ratio | Bg Ratio | pvalue | p.adjust | qvalue | Count |
| Page: 1 |
Top |
Cell-cell communication analysis |
| Identification of potential cell-cell interactions between two cell types and their ligand-receptor pairs for different disease states |
| Ligand | Receptor | LRpair | Pathway | Tissue | Disease Stage |
| Page: 1 |
Top |
Single-cell gene regulatory network inference analysis |
| Find out the significant the regulons (TFs) and the target genes of each regulon across cell types for different disease states |
| TF | Cell Type | Tissue | Disease Stage | Target Gene | RSS | Regulon Activity |
| ∗The dot plots of a searched regulon are shown for all cell subpopulations in each disease state of each tissue based on the regulon specific score inferred using pySCENIC and by calculating the average expression. |
| Page: 1 |
Top |
Somatic mutation of malignant transformation related genes |
| Annotation of somatic variants for genes involved in malignant transformation |
| Hugo Symbol | Variant Class | Variant Classification | dbSNP RS | HGVSc | HGVSp | HGVSp Short | SWISSPROT | BIOTYPE | SIFT | PolyPhen | Tumor Sample Barcode | Tissue | Histology | Sex | Age | Stage | Therapy Types | Drugs | Outcome |
| NOL12 | SNV | Missense_Mutation | rs141736495 | c.545N>A | p.Arg182Gln | p.R182Q | Q9UGY1 | protein_coding | tolerated(0.39) | benign(0.006) | TCGA-AC-A5XS-01 | Breast | breast invasive carcinoma | Female | >=65 | I/II | Hormone Therapy | femara | SD |
| NOL12 | SNV | Missense_Mutation | c.397A>T | p.Arg133Trp | p.R133W | Q9UGY1 | protein_coding | deleterious(0.01) | benign(0.401) | TCGA-B6-A0RS-01 | Breast | breast invasive carcinoma | Female | <65 | I/II | Unknown | Unknown | PD | |
| NOL12 | SNV | Missense_Mutation | c.85N>A | p.Glu29Lys | p.E29K | Q9UGY1 | protein_coding | deleterious(0.01) | possibly_damaging(0.596) | TCGA-B6-A1KN-01 | Breast | breast invasive carcinoma | Female | <65 | III/IV | Unknown | Unknown | SD | |
| NOL12 | SNV | Missense_Mutation | c.64T>G | p.Phe22Val | p.F22V | Q9UGY1 | protein_coding | deleterious(0.02) | probably_damaging(0.997) | TCGA-C8-A12V-01 | Breast | breast invasive carcinoma | Female | <65 | I/II | Unknown | Unknown | SD | |
| NOL12 | SNV | Missense_Mutation | c.488C>T | p.Ser163Phe | p.S163F | Q9UGY1 | protein_coding | deleterious(0) | benign(0.305) | TCGA-IR-A3LH-01 | Cervix | cervical & endocervical cancer | Female | <65 | I/II | Chemotherapy | cisplatin | CR | |
| NOL12 | SNV | Missense_Mutation | rs377073310 | c.518N>A | p.Arg173His | p.R173H | Q9UGY1 | protein_coding | tolerated(0.11) | benign(0.265) | TCGA-AA-3510-01 | Colorectum | colon adenocarcinoma | Male | >=65 | I/II | Unknown | Unknown | SD |
| NOL12 | SNV | Missense_Mutation | rs775776838 | c.547C>T | p.Arg183Trp | p.R183W | Q9UGY1 | protein_coding | deleterious(0.01) | benign(0.306) | TCGA-AA-3864-01 | Colorectum | colon adenocarcinoma | Male | >=65 | I/II | Unknown | Unknown | SD |
| NOL12 | SNV | Missense_Mutation | novel | c.586N>G | p.Thr196Ala | p.T196A | Q9UGY1 | protein_coding | deleterious(0) | probably_damaging(0.985) | TCGA-AA-A00N-01 | Colorectum | colon adenocarcinoma | Male | >=65 | I/II | Unknown | Unknown | PD |
| NOL12 | SNV | Missense_Mutation | c.335N>T | p.Asp112Val | p.D112V | Q9UGY1 | protein_coding | deleterious(0) | possibly_damaging(0.867) | TCGA-AA-A02K-01 | Colorectum | colon adenocarcinoma | Male | <65 | III/IV | Chemotherapy | folinic | PD | |
| NOL12 | SNV | Missense_Mutation | rs377073310 | c.518G>A | p.Arg173His | p.R173H | Q9UGY1 | protein_coding | tolerated(0.11) | benign(0.265) | TCGA-A5-A0G2-01 | Endometrium | uterine corpus endometrioid carcinoma | Female | <65 | III/IV | Unknown | Unknown | SD |
| Page: 1 2 3 |
Top |
Related drugs of malignant transformation related genes |
| Identification of chemicals and drugs interact with genes involved in malignant transfromation |
| (DGIdb 4.0) |
| Entrez ID | Symbol | Category | Interaction Types | Drug Claim Name | Drug Name | PMIDs |
| Page: 1 |

Copyright 2023-Present -The University of Texas Health Science Center at Houston |