Schematic overview of the cellular and molecular mechanisms involved in the cancer progression, including the proposed cellular and molecular mechanisms in cancer cells trajectory. AT1: alveolar type 1 cells; AT2: alveolar type 2 cells; AAH: atypical adenomatous hyperplasia; AIS: adenocarcinoma in situ; MIA: minimally invasive adenocarcinoma; IA: invasive adenocarcinoma; EMT: epithelial-mesenchymal transition

Home

Download

Statistics

Help

Contact

Center for Computational Systems Medicine
leaf

Gene summary

leaf

Malignant transformation analysis

leaf

Malignant transformation related pathway analysis

leaf

Cell-cell communication analysis

leaf

Single-cell gene regulatory network inference analysis

leaf

Somatic mutation of malignant transformation related genes

leaf

Related drugs of malignant transformation related genes

Gene: NOL10

Gene summary for NOL10

check button Gene summary.

Gene informationSpeciesHuman
Gene symbol

NOL10

Gene ID

79954

Gene namenucleolar protein 10
Gene AliasPQBP5
Cytomap2p25.1
Gene Typeprotein-coding
GO ID

GO:0000462

UniProtAcc

Q9BSC4


Top

Malignant transformation analysis

check button Identification of the aberrant gene expression in precancerous and cancerous lesions by comparing the gene expression of stem-like cells in diseased tissues with normal stem cells
check button Malignant transformation involving gene list.
Entrez IDSymbolReplicatesSpeciesOrganTissueAdj P-valueLog2FCMalignancy
79954NOL10CCI_2HumanCervixCC4.37e-078.13e-010.5249
79954NOL10CCI_3HumanCervixCC3.06e-055.55e-010.516
79954NOL10HTA11_3361_2000001011HumanColorectumAD3.60e-06-5.37e-01-0.1207
79954NOL10F007HumanColorectumFAP3.80e-04-2.15e-010.1176
79954NOL10A001-C-207HumanColorectumFAP1.09e-05-2.64e-010.1278
79954NOL10A015-C-203HumanColorectumFAP7.59e-28-3.75e-01-0.1294
79954NOL10A015-C-204HumanColorectumFAP2.84e-07-3.12e-01-0.0228
79954NOL10A014-C-040HumanColorectumFAP2.55e-03-2.97e-01-0.1184
79954NOL10A002-C-201HumanColorectumFAP1.11e-14-3.52e-010.0324
79954NOL10A002-C-203HumanColorectumFAP7.45e-04-1.93e-010.2786
79954NOL10A001-C-119HumanColorectumFAP4.66e-10-3.98e-01-0.1557
79954NOL10A001-C-108HumanColorectumFAP1.95e-15-3.20e-01-0.0272
79954NOL10A002-C-205HumanColorectumFAP1.99e-22-4.62e-01-0.1236
79954NOL10A001-C-104HumanColorectumFAP1.12e-03-2.68e-010.0184
79954NOL10A015-C-005HumanColorectumFAP5.35e-06-2.81e-01-0.0336
79954NOL10A015-C-006HumanColorectumFAP5.85e-15-3.40e-01-0.0994
79954NOL10A015-C-106HumanColorectumFAP8.19e-12-3.70e-01-0.0511
79954NOL10A002-C-114HumanColorectumFAP7.15e-19-4.69e-01-0.1561
79954NOL10A015-C-104HumanColorectumFAP7.10e-26-4.32e-01-0.1899
79954NOL10A001-C-014HumanColorectumFAP4.26e-12-2.58e-010.0135
Page: 1 2 3 4 5 6 7 

check button Transcriptomic changes along malignancy continuum.
TissueExpression DynamicsAbbreviation
CervixThe image shows the transcriptomic changes along malignancy continuum.log2FC in expression of this searched gene in stem-like cells from each diseased tissue sample relative to stem-like cells in normal samples in each tissue plotted against the malignancy continuum. Samples are colored based on if they are from different disease stage.CC: Cervix cancer
HSIL_HPV: HPV-infected high-grade squamous intraepithelial lesions
N_HPV: HPV-infected normal cervix
Colorectum (GSE201348)The image shows the transcriptomic changes along malignancy continuum.log2FC in expression of this searched gene in stem-like cells from each diseased tissue sample relative to stem-like cells in normal samples in each tissue plotted against the malignancy continuum. Samples are colored based on if they are from different disease stage.FAP: Familial adenomatous polyposis
CRC: Colorectal cancer
Colorectum (HTA11)The image shows the transcriptomic changes along malignancy continuum.log2FC in expression of this searched gene in stem-like cells from each diseased tissue sample relative to stem-like cells in normal samples in each tissue plotted against the malignancy continuum. Samples are colored based on if they are from different disease stage.AD: Adenomas
SER: Sessile serrated lesions
MSI-H: Microsatellite-high colorectal cancer
MSS: Microsatellite stable colorectal cancer
EsophagusThe image shows the transcriptomic changes along malignancy continuum.log2FC in expression of this searched gene in stem-like cells from each diseased tissue sample relative to stem-like cells in normal samples in each tissue plotted against the malignancy continuum. Samples are colored based on if they are from different disease stage.ESCC: Esophageal squamous cell carcinoma
HGIN: High-grade intraepithelial neoplasias
LGIN: Low-grade intraepithelial neoplasias
LiverThe image shows the transcriptomic changes along malignancy continuum.log2FC in expression of this searched gene in stem-like cells from each diseased tissue sample relative to stem-like cells in normal samples in each tissue plotted against the malignancy continuum. Samples are colored based on if they are from different disease stage.HCC: Hepatocellular carcinoma
NAFLD: Non-alcoholic fatty liver disease
LungThe image shows the transcriptomic changes along malignancy continuum.log2FC in expression of this searched gene in stem-like cells from each diseased tissue sample relative to stem-like cells in normal samples in each tissue plotted against the malignancy continuum. Samples are colored based on if they are from different disease stage.AAH: Atypical adenomatous hyperplasia
AIS: Adenocarcinoma in situ
IAC: Invasive lung adenocarcinoma
MIA: Minimally invasive adenocarcinoma
Oral CavityThe image shows the transcriptomic changes along malignancy continuum.log2FC in expression of this searched gene in stem-like cells from each diseased tissue sample relative to stem-like cells in normal samples in each tissue plotted against the malignancy continuum. Samples are colored based on if they are from different disease stage.EOLP: Erosive Oral lichen planus
LP: leukoplakia
NEOLP: Non-erosive oral lichen planus
OSCC: Oral squamous cell carcinoma
SkinThe image shows the transcriptomic changes along malignancy continuum.log2FC in expression of this searched gene in stem-like cells from each diseased tissue sample relative to stem-like cells in normal samples in each tissue plotted against the malignancy continuum. Samples are colored based on if they are from different disease stage.
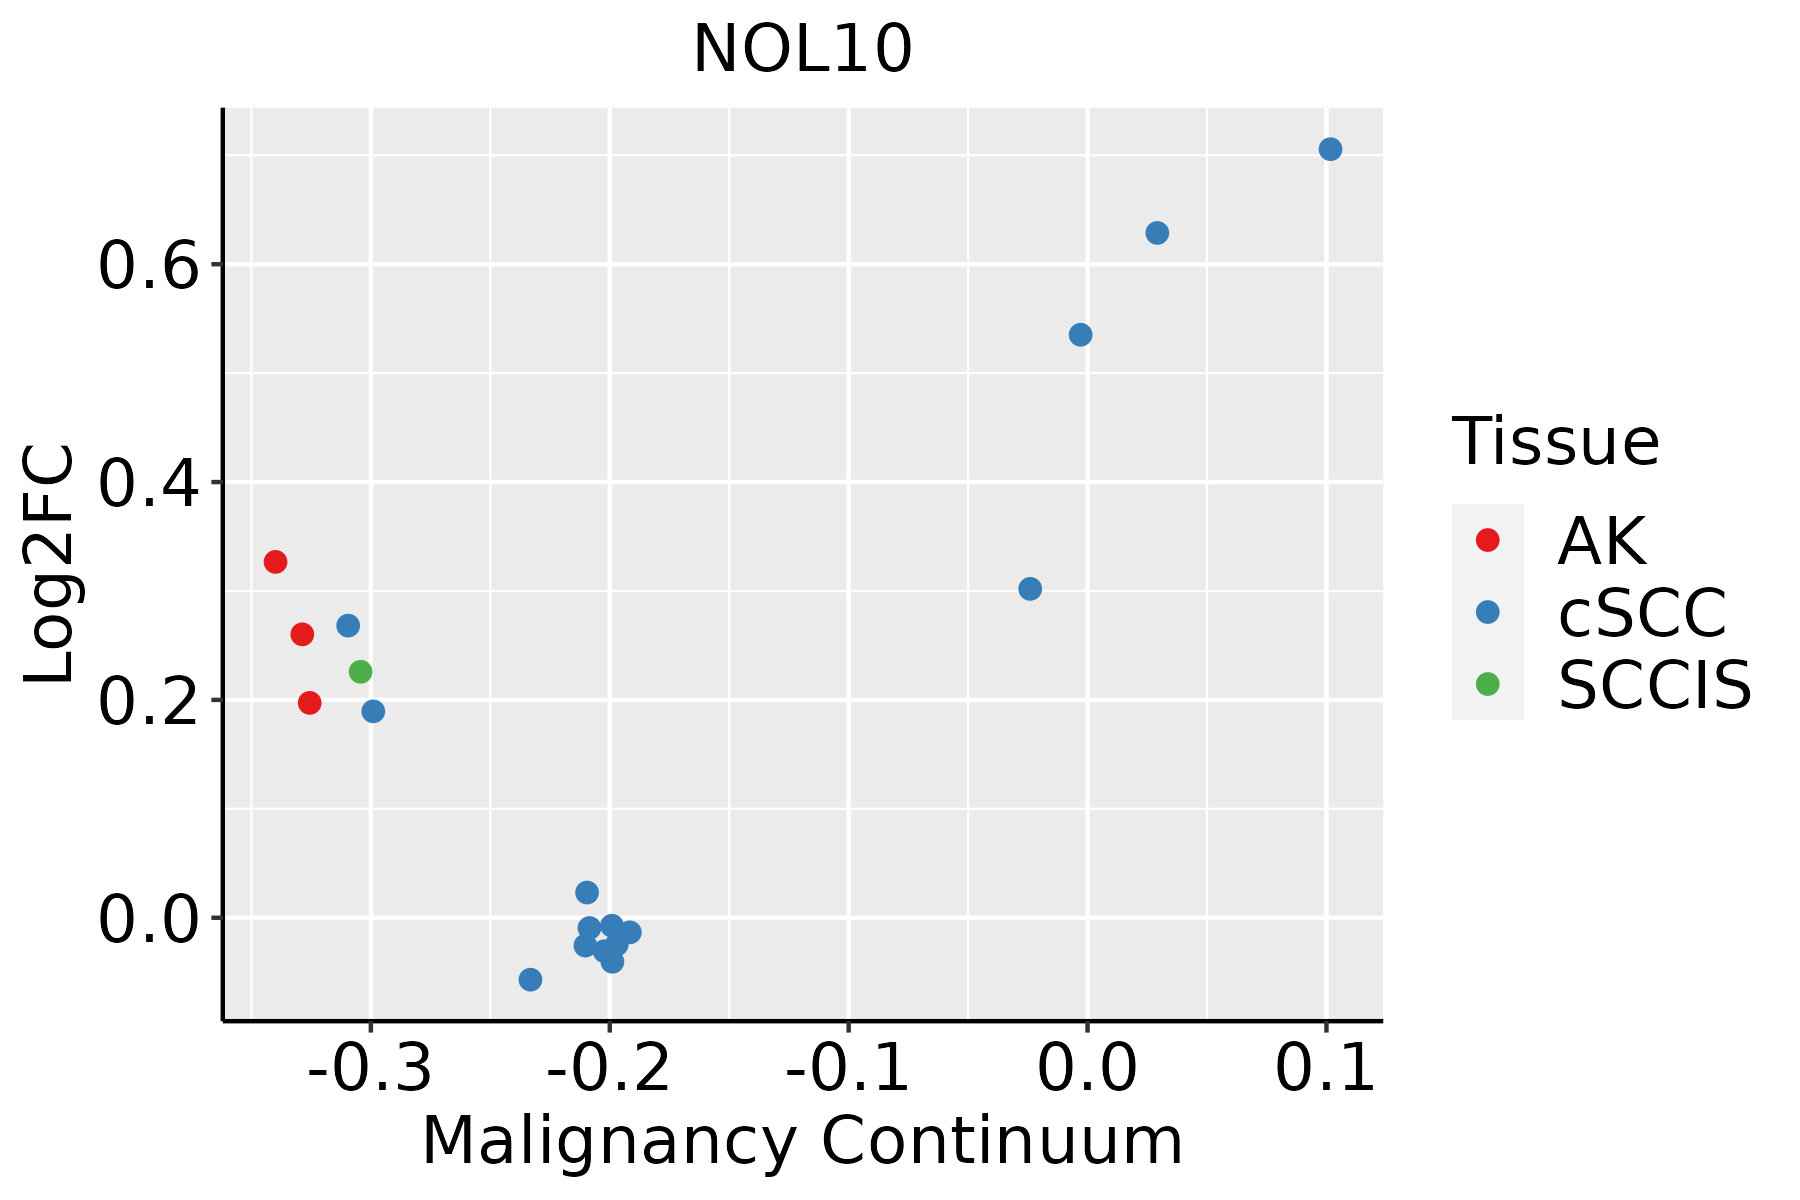
AK: Actinic keratosis
cSCC: Cutaneous squamous cell carcinoma
SCCIS:squamous cell carcinoma in situ
∗log2FC in expression of this searched gene in stem-like cells from each diseased tissue sample relative to stem-like cells in normal samples in each tissue plotted against the malignancy continuum. Samples are colored based on if they are from different disease stage.

Top

Malignant transformation related pathway analysis

check buttonFind out the enriched GO biological processes and KEGG pathways involved in transition from healthy to precancer to cancer
check button Figure of enriched GO biological processes.
TissueDisease StageEnriched GO biological Processes
ColorectumADGO analysis - Figure of enriched GO biological processes: Top 15 enriched GO BP terms are showed in the bar plot of each disease state in each tissue. Each row represents a significant GO biological process which is colored according to the -log10(p.adjust).
ColorectumSERGO analysis - Figure of enriched GO biological processes: Top 15 enriched GO BP terms are showed in the bar plot of each disease state in each tissue. Each row represents a significant GO biological process which is colored according to the -log10(p.adjust).
ColorectumMSSGO analysis - Figure of enriched GO biological processes: Top 15 enriched GO BP terms are showed in the bar plot of each disease state in each tissue. Each row represents a significant GO biological process which is colored according to the -log10(p.adjust).
ColorectumMSI-HGO analysis - Figure of enriched GO biological processes: Top 15 enriched GO BP terms are showed in the bar plot of each disease state in each tissue. Each row represents a significant GO biological process which is colored according to the -log10(p.adjust).
ColorectumFAPGO analysis - Figure of enriched GO biological processes: Top 15 enriched GO BP terms are showed in the bar plot of each disease state in each tissue. Each row represents a significant GO biological process which is colored according to the -log10(p.adjust).
∗Top 15 enriched GO BP terms are showed in the bar plot of each disease state in each tissue. Each row represents a significant GO biological process which is colored according to the -log10(p.adjust).
Page: 1 2 3 4 5 6 7 8 9 

check button Enriched GO biological processes.
GO IDTissueDisease StageDescriptionGene RatioBg Ratiopvaluep.adjustCount
GO:004227410CervixCCribosomal small subunit biogenesis23/231173/187231.33e-052.68e-0423
GO:002261310CervixCCribonucleoprotein complex biogenesis88/2311463/187232.11e-053.82e-0488
GO:004225410CervixCCribosome biogenesis62/2311299/187232.48e-054.27e-0462
GO:00160727CervixCCrRNA metabolic process42/2311236/187239.12e-034.60e-0242
GO:0022613ColorectumADribonucleoprotein complex biogenesis151/3918463/187231.96e-091.39e-07151
GO:0042254ColorectumADribosome biogenesis84/3918299/187231.82e-031.50e-0284
GO:0042274ColorectumADribosomal small subunit biogenesis25/391873/187235.69e-033.64e-0225
GO:00226134ColorectumFAPribonucleoprotein complex biogenesis91/2622463/187234.28e-045.12e-0391
GO:00226135ColorectumCRCribonucleoprotein complex biogenesis76/2078463/187233.04e-044.78e-0376
GO:00422743ColorectumCRCribosomal small subunit biogenesis18/207873/187238.33e-041.04e-0218
GO:0022613111EsophagusESCCribonucleoprotein complex biogenesis365/8552463/187231.74e-491.11e-45365
GO:0042254111EsophagusESCCribosome biogenesis252/8552299/187233.27e-441.04e-40252
GO:003447015EsophagusESCCncRNA processing300/8552395/187233.09e-353.26e-32300
GO:0016072110EsophagusESCCrRNA metabolic process197/8552236/187231.31e-331.18e-30197
GO:0006364110EsophagusESCCrRNA processing189/8552225/187234.88e-333.87e-30189
GO:003466012EsophagusESCCncRNA metabolic process346/8552485/187234.35e-312.51e-28346
GO:0042274111EsophagusESCCribosomal small subunit biogenesis67/855273/187236.62e-175.38e-1567
GO:00304904EsophagusESCCmaturation of SSU-rRNA45/855250/187235.07e-111.63e-0945
GO:00004623EsophagusESCCmaturation of SSU-rRNA from tricistronic rRNA transcript (SSU-rRNA, 5.8S rRNA, LSU-rRNA)32/855237/187232.96e-074.23e-0632
GO:002261322LiverHCCribonucleoprotein complex biogenesis355/7958463/187237.76e-524.92e-48355
Page: 1 2 3 4 

check button Enriched KEGG pathways.
Pathway IDTissueDisease StageDescriptionGene RatioBg Ratiopvaluep.adjustqvalueCount
Page: 1 

Top

Cell-cell communication analysis

check buttonIdentification of potential cell-cell interactions between two cell types and their ligand-receptor pairs for different disease states
LigandReceptorLRpairPathwayTissueDisease Stage
Page: 1 

Top

Single-cell gene regulatory network inference analysis

check buttonFind out the significant the regulons (TFs) and the target genes of each regulon across cell types for different disease states
TFCell TypeTissueDisease StageTarget GeneRSSRegulon Activity
∗The dot plots of a searched regulon are shown for all cell subpopulations in each disease state of each tissue based on the regulon specific score inferred using pySCENIC and by calculating the average expression.
Page: 1 

Top

Somatic mutation of malignant transformation related genes

check buttonAnnotation of somatic variants for genes involved in malignant transformation
Hugo SymbolVariant ClassVariant ClassificationdbSNP RSHGVScHGVSpHGVSp ShortSWISSPROTBIOTYPESIFTPolyPhenTumor Sample BarcodeTissueHistologySexAgeStageTherapy TypesDrugsOutcome
NOL10SNVMissense_Mutationnovelc.56C>Tp.Ser19Phep.S19FQ9BSC4protein_codingdeleterious(0)probably_damaging(0.987)TCGA-5L-AAT1-01Breastbreast invasive carcinomaFemale<65III/IVHormone TherapyletrozolSD
NOL10SNVMissense_Mutationnovelc.792N>Cp.Leu264Phep.L264FQ9BSC4protein_codingtolerated(0.41)benign(0)TCGA-AO-A128-01Breastbreast invasive carcinomaFemale<65I/IIChemotherapydoxorubicinSD
NOL10SNVMissense_Mutationnovelc.790N>Gp.Leu264Valp.L264VQ9BSC4protein_codingtolerated(0.11)benign(0)TCGA-AO-A128-01Breastbreast invasive carcinomaFemale<65I/IIChemotherapydoxorubicinSD
NOL10SNVMissense_Mutationc.1491N>Ap.Asp497Glup.D497EQ9BSC4protein_codingdeleterious(0.02)probably_damaging(0.997)TCGA-BH-A0DT-01Breastbreast invasive carcinomaFemale<65I/IIChemotherapytaxotereCR
NOL10SNVMissense_Mutationc.30N>Cp.Lys10Asnp.K10NQ9BSC4protein_codingdeleterious(0)probably_damaging(0.992)TCGA-BH-A208-01Breastbreast invasive carcinomaFemale<65I/IIUnknownUnknownSD
NOL10insertionIn_Frame_Insnovelc.1991_2008dupGACAAGAAAGGAAAAGACp.Arg664_Arg669dupp.R664_R669dupQ9BSC4protein_codingTCGA-AO-A0JB-01Breastbreast invasive carcinomaFemale<65III/IVChemotherapycyclophosphamideSD
NOL10insertionNonsense_Mutationnovelc.1345_1346insAAAAACAATAATCTAAACGTp.Val449GlufsTer4p.V449Efs*4Q9BSC4protein_codingTCGA-AR-A0U0-01Breastbreast invasive carcinomaFemale>=65I/IIUnknownUnknownSD
NOL10SNVMissense_Mutationc.1780N>Cp.Glu594Glnp.E594QQ9BSC4protein_codingtolerated(0.2)benign(0.051)TCGA-C5-A1BQ-01Cervixcervical & endocervical cancerFemale>=65III/IVChemotherapycisplatinCR
NOL10SNVMissense_Mutationc.212N>Ap.Gly71Glup.G71EQ9BSC4protein_codingdeleterious(0)probably_damaging(1)TCGA-IR-A3LK-01Cervixcervical & endocervical cancerFemale>=65I/IIChemotherapycisplatinPD
NOL10SNVMissense_Mutationnovelc.286N>Cp.Glu96Glnp.E96QQ9BSC4protein_codingdeleterious(0.01)benign(0.217)TCGA-VS-A9V2-01Cervixcervical & endocervical cancerFemale<65I/IIUnknownUnknownSD
Page: 1 2 3 4 5 

Top

Related drugs of malignant transformation related genes

check buttonIdentification of chemicals and drugs interact with genes involved in malignant transfromation
(DGIdb 4.0)
Entrez IDSymbolCategoryInteraction TypesDrug Claim NameDrug NamePMIDs
Page: 1