
|
|||||
|
 | |
| |
| |
| |
| |
| |
|
Gene: NOD1 |
Gene summary for NOD1 |
| Gene information | Species | Human | Gene symbol | NOD1 | Gene ID | 10392 |
| Gene name | nucleotide binding oligomerization domain containing 1 | |
| Gene Alias | CARD4 | |
| Cytomap | 7p14.3 | |
| Gene Type | protein-coding | GO ID | GO:0000165 | UniProtAcc | A0A024RA73 |
Top |
Malignant transformation analysis |
| Identification of the aberrant gene expression in precancerous and cancerous lesions by comparing the gene expression of stem-like cells in diseased tissues with normal stem cells |
| Entrez ID | Symbol | Replicates | Species | Organ | Tissue | Adj P-value | Log2FC | Malignancy |
| 10392 | NOD1 | RNA-P25T1-P25T1-1 | Human | Lung | AIS | 5.65e-05 | 4.15e-01 | -0.2116 |
| 10392 | NOD1 | RNA-P25T1-P25T1-4 | Human | Lung | AIS | 5.14e-03 | 3.87e-01 | -0.2119 |
| 10392 | NOD1 | RNA-P3T-P3T-1 | Human | Lung | IAC | 4.51e-05 | 5.81e-01 | 0.1829 |
| 10392 | NOD1 | RNA-P3T-P3T-2 | Human | Lung | IAC | 1.15e-04 | 5.78e-01 | 0.1835 |
| 10392 | NOD1 | RNA-P3T-P3T-4 | Human | Lung | IAC | 4.99e-05 | 5.76e-01 | 0.1859 |
| 10392 | NOD1 | RNA-P6T2-P6T2-1 | Human | Lung | IAC | 1.02e-09 | 4.45e-01 | -0.0166 |
| 10392 | NOD1 | RNA-P6T2-P6T2-2 | Human | Lung | IAC | 1.80e-15 | 4.82e-01 | -0.0132 |
| 10392 | NOD1 | RNA-P6T2-P6T2-3 | Human | Lung | IAC | 1.45e-14 | 4.60e-01 | -0.013 |
| 10392 | NOD1 | RNA-P6T2-P6T2-4 | Human | Lung | IAC | 5.47e-04 | 2.87e-01 | -0.0121 |
| 10392 | NOD1 | male-WTA | Human | Thyroid | PTC | 8.91e-35 | 3.53e-01 | 0.1037 |
| 10392 | NOD1 | PTC01 | Human | Thyroid | PTC | 7.53e-19 | 3.82e-01 | 0.1899 |
| 10392 | NOD1 | PTC04 | Human | Thyroid | PTC | 8.98e-16 | 4.07e-01 | 0.1927 |
| 10392 | NOD1 | PTC05 | Human | Thyroid | PTC | 2.84e-31 | 1.11e+00 | 0.2065 |
| 10392 | NOD1 | PTC06 | Human | Thyroid | PTC | 1.69e-49 | 9.46e-01 | 0.2057 |
| 10392 | NOD1 | PTC07 | Human | Thyroid | PTC | 1.06e-43 | 7.69e-01 | 0.2044 |
| 10392 | NOD1 | ATC12 | Human | Thyroid | ATC | 7.85e-04 | 2.27e-02 | 0.34 |
| 10392 | NOD1 | ATC13 | Human | Thyroid | ATC | 1.34e-08 | 1.72e-01 | 0.34 |
| 10392 | NOD1 | ATC4 | Human | Thyroid | ATC | 1.89e-02 | 4.22e-02 | 0.34 |
| 10392 | NOD1 | ATC5 | Human | Thyroid | ATC | 9.31e-15 | 1.91e-01 | 0.34 |
| Page: 1 |
| Tissue | Expression Dynamics | Abbreviation |
| Lung | 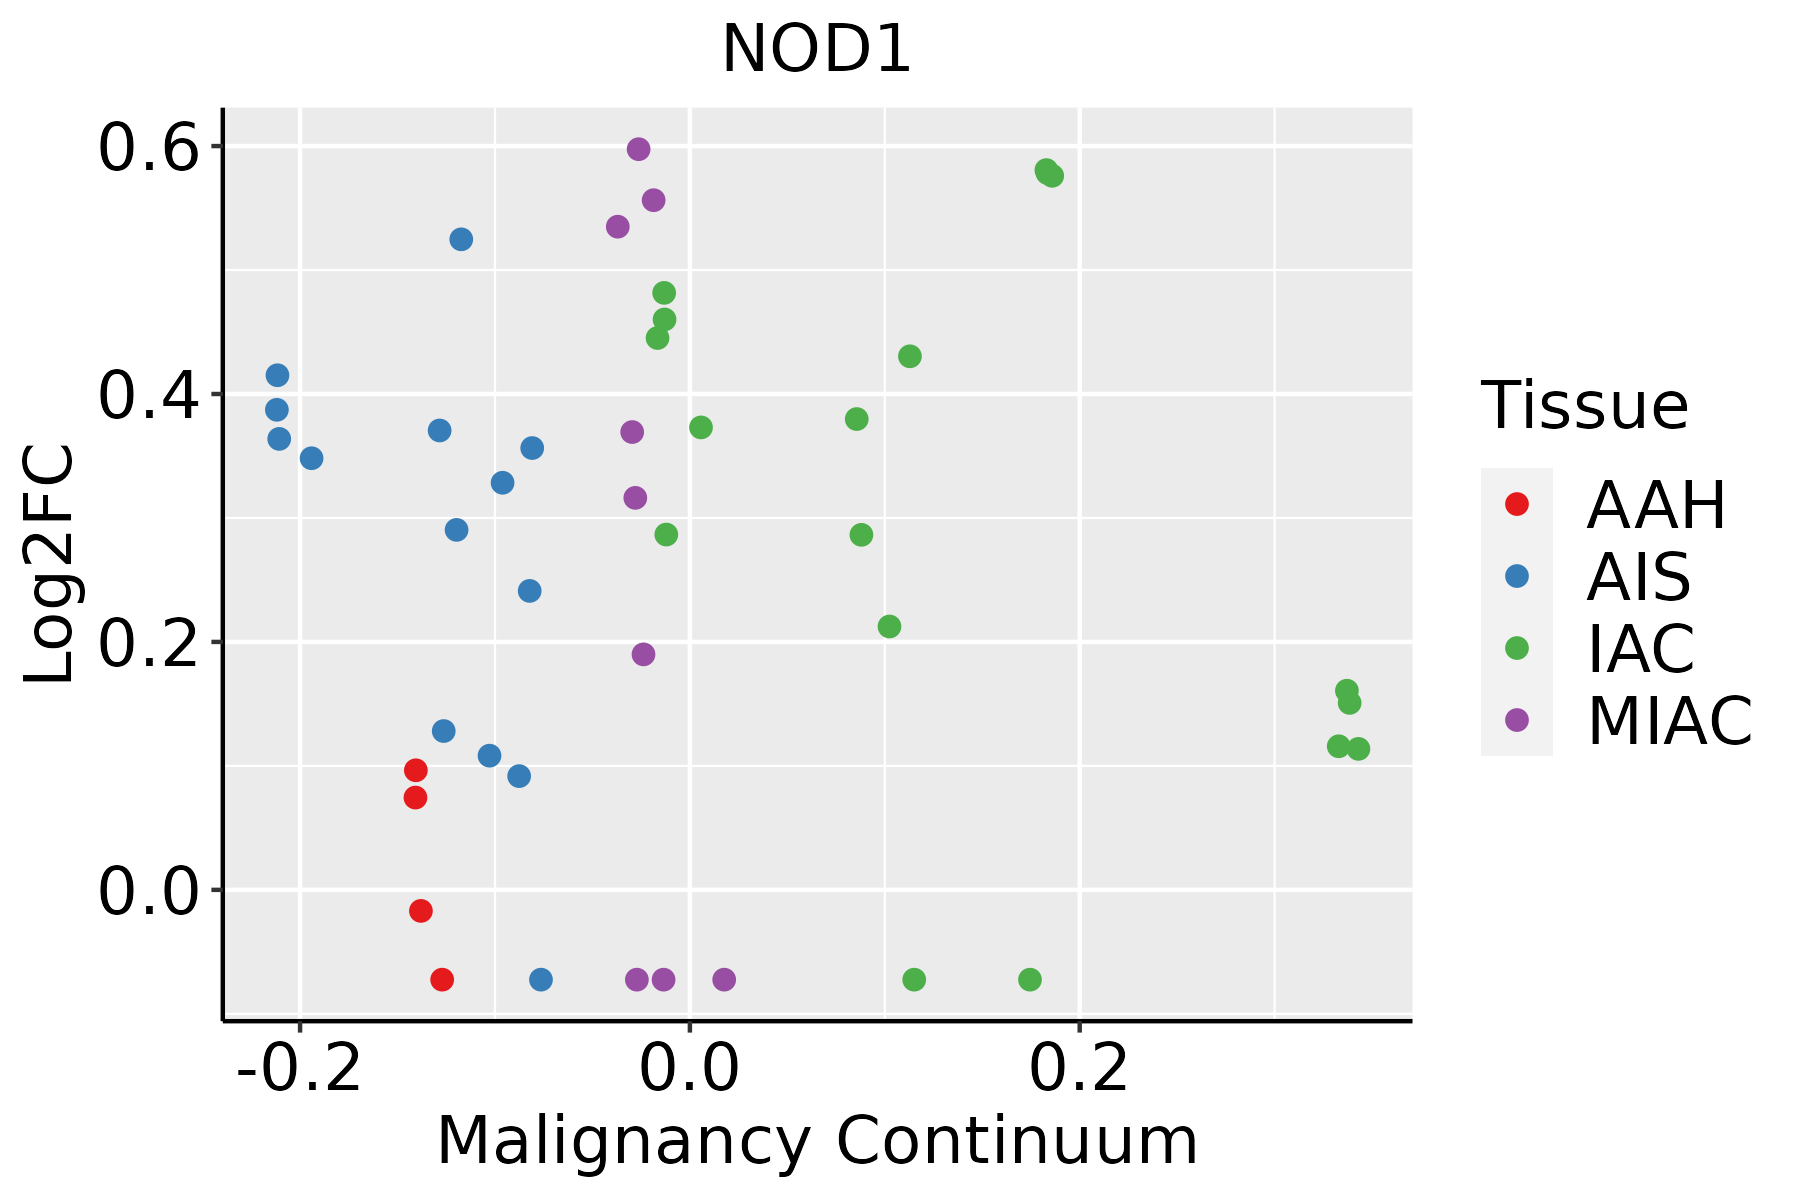 | AAH: Atypical adenomatous hyperplasia |
| AIS: Adenocarcinoma in situ | ||
| IAC: Invasive lung adenocarcinoma | ||
| MIA: Minimally invasive adenocarcinoma | ||
| Thyroid |  | ATC: Anaplastic thyroid cancer |
| HT: Hashimoto's thyroiditis | ||
| PTC: Papillary thyroid cancer |
| ∗log2FC in expression of this searched gene in stem-like cells from each diseased tissue sample relative to stem-like cells in normal samples in each tissue plotted against the malignancy continuum. Samples are colored based on if they are from different disease stage. |
Top |
Malignant transformation related pathway analysis |
| Find out the enriched GO biological processes and KEGG pathways involved in transition from healthy to precancer to cancer |
| Tissue | Disease Stage | Enriched GO biological Processes |
| Colorectum | AD |  |
| Colorectum | SER |  |
| Colorectum | MSS |  |
| Colorectum | MSI-H |  |
| Colorectum | FAP |  |
| ∗Top 15 enriched GO BP terms are showed in the bar plot of each disease state in each tissue. Each row represents a significant GO biological process which is colored according to the -log10(p.adjust). |
| Page: 1 2 3 4 5 6 7 8 9 |
| GO ID | Tissue | Disease Stage | Description | Gene Ratio | Bg Ratio | pvalue | p.adjust | Count |
| GO:00098968 | Lung | IAC | positive regulation of catabolic process | 114/2061 | 492/18723 | 4.93e-15 | 1.25e-11 | 114 |
| GO:00313318 | Lung | IAC | positive regulation of cellular catabolic process | 98/2061 | 427/18723 | 7.79e-13 | 9.25e-10 | 98 |
| GO:00458628 | Lung | IAC | positive regulation of proteolysis | 80/2061 | 372/18723 | 2.62e-09 | 4.21e-07 | 80 |
| GO:00310987 | Lung | IAC | stress-activated protein kinase signaling cascade | 57/2061 | 247/18723 | 3.95e-08 | 4.57e-06 | 57 |
| GO:00514037 | Lung | IAC | stress-activated MAPK cascade | 54/2061 | 239/18723 | 1.86e-07 | 1.56e-05 | 54 |
| GO:00072544 | Lung | IAC | JNK cascade | 42/2061 | 167/18723 | 1.99e-07 | 1.62e-05 | 42 |
| GO:00105066 | Lung | IAC | regulation of autophagy | 65/2061 | 317/18723 | 4.97e-07 | 3.14e-05 | 65 |
| GO:00703026 | Lung | IAC | regulation of stress-activated protein kinase signaling cascade | 45/2061 | 195/18723 | 1.03e-06 | 5.65e-05 | 45 |
| GO:00463284 | Lung | IAC | regulation of JNK cascade | 34/2061 | 133/18723 | 1.88e-06 | 8.87e-05 | 34 |
| GO:19016537 | Lung | IAC | cellular response to peptide | 69/2061 | 359/18723 | 2.62e-06 | 1.14e-04 | 69 |
| GO:00328726 | Lung | IAC | regulation of stress-activated MAPK cascade | 43/2061 | 192/18723 | 4.06e-06 | 1.66e-04 | 43 |
| GO:00072495 | Lung | IAC | I-kappaB kinase/NF-kappaB signaling | 56/2061 | 281/18723 | 7.39e-06 | 2.62e-04 | 56 |
| GO:00431226 | Lung | IAC | regulation of I-kappaB kinase/NF-kappaB signaling | 51/2061 | 249/18723 | 8.41e-06 | 2.87e-04 | 51 |
| GO:20001168 | Lung | IAC | regulation of cysteine-type endopeptidase activity | 48/2061 | 235/18723 | 1.65e-05 | 4.73e-04 | 48 |
| GO:00525478 | Lung | IAC | regulation of peptidase activity | 80/2061 | 461/18723 | 2.39e-05 | 6.50e-04 | 80 |
| GO:00432818 | Lung | IAC | regulation of cysteine-type endopeptidase activity involved in apoptotic process | 43/2061 | 209/18723 | 3.71e-05 | 9.14e-04 | 43 |
| GO:00525488 | Lung | IAC | regulation of endopeptidase activity | 75/2061 | 432/18723 | 4.18e-05 | 1.01e-03 | 75 |
| GO:00109528 | Lung | IAC | positive regulation of peptidase activity | 41/2061 | 197/18723 | 4.22e-05 | 1.02e-03 | 41 |
| GO:00510903 | Lung | IAC | regulation of DNA-binding transcription factor activity | 76/2061 | 440/18723 | 4.44e-05 | 1.05e-03 | 76 |
| GO:00510914 | Lung | IAC | positive regulation of DNA-binding transcription factor activity | 50/2061 | 260/18723 | 5.87e-05 | 1.29e-03 | 50 |
| Page: 1 2 3 4 5 6 7 |
| Pathway ID | Tissue | Disease Stage | Description | Gene Ratio | Bg Ratio | pvalue | p.adjust | qvalue | Count |
| hsa0513116 | Lung | IAC | Shigellosis | 58/1053 | 247/8465 | 8.21e-07 | 3.81e-05 | 2.53e-05 | 58 |
| hsa0513216 | Lung | IAC | Salmonella infection | 52/1053 | 249/8465 | 9.46e-05 | 1.28e-03 | 8.50e-04 | 52 |
| hsa051205 | Lung | IAC | Epithelial cell signaling in Helicobacter pylori infection | 20/1053 | 70/8465 | 2.31e-04 | 2.54e-03 | 1.68e-03 | 20 |
| hsa046212 | Lung | IAC | NOD-like receptor signaling pathway | 38/1053 | 186/8465 | 1.23e-03 | 8.24e-03 | 5.47e-03 | 38 |
| hsa0513117 | Lung | IAC | Shigellosis | 58/1053 | 247/8465 | 8.21e-07 | 3.81e-05 | 2.53e-05 | 58 |
| hsa0513217 | Lung | IAC | Salmonella infection | 52/1053 | 249/8465 | 9.46e-05 | 1.28e-03 | 8.50e-04 | 52 |
| hsa0512012 | Lung | IAC | Epithelial cell signaling in Helicobacter pylori infection | 20/1053 | 70/8465 | 2.31e-04 | 2.54e-03 | 1.68e-03 | 20 |
| hsa0462111 | Lung | IAC | NOD-like receptor signaling pathway | 38/1053 | 186/8465 | 1.23e-03 | 8.24e-03 | 5.47e-03 | 38 |
| hsa0513123 | Lung | AIS | Shigellosis | 53/961 | 247/8465 | 2.70e-06 | 9.71e-05 | 6.21e-05 | 53 |
| hsa0513223 | Lung | AIS | Salmonella infection | 50/961 | 249/8465 | 3.47e-05 | 5.62e-04 | 3.59e-04 | 50 |
| hsa0512021 | Lung | AIS | Epithelial cell signaling in Helicobacter pylori infection | 15/961 | 70/8465 | 1.07e-02 | 4.45e-02 | 2.85e-02 | 15 |
| hsa0513133 | Lung | AIS | Shigellosis | 53/961 | 247/8465 | 2.70e-06 | 9.71e-05 | 6.21e-05 | 53 |
| hsa0513233 | Lung | AIS | Salmonella infection | 50/961 | 249/8465 | 3.47e-05 | 5.62e-04 | 3.59e-04 | 50 |
| hsa0512031 | Lung | AIS | Epithelial cell signaling in Helicobacter pylori infection | 15/961 | 70/8465 | 1.07e-02 | 4.45e-02 | 2.85e-02 | 15 |
| Page: 1 |
Top |
Cell-cell communication analysis |
| Identification of potential cell-cell interactions between two cell types and their ligand-receptor pairs for different disease states |
| Ligand | Receptor | LRpair | Pathway | Tissue | Disease Stage |
| Page: 1 |
Top |
Single-cell gene regulatory network inference analysis |
| Find out the significant the regulons (TFs) and the target genes of each regulon across cell types for different disease states |
| TF | Cell Type | Tissue | Disease Stage | Target Gene | RSS | Regulon Activity |
| ∗The dot plots of a searched regulon are shown for all cell subpopulations in each disease state of each tissue based on the regulon specific score inferred using pySCENIC and by calculating the average expression. |
| Page: 1 |
Top |
Somatic mutation of malignant transformation related genes |
| Annotation of somatic variants for genes involved in malignant transformation |
| Hugo Symbol | Variant Class | Variant Classification | dbSNP RS | HGVSc | HGVSp | HGVSp Short | SWISSPROT | BIOTYPE | SIFT | PolyPhen | Tumor Sample Barcode | Tissue | Histology | Sex | Age | Stage | Therapy Types | Drugs | Outcome |
| NOD1 | SNV | Missense_Mutation | rs562328057 | c.1150C>A | p.Leu384Ile | p.L384I | Q9Y239 | protein_coding | deleterious(0) | possibly_damaging(0.898) | TCGA-A2-A04R-01 | Breast | breast invasive carcinoma | Female | <65 | I/II | Chemotherapy | taxol | SD |
| NOD1 | SNV | Missense_Mutation | c.2721G>T | p.Gln907His | p.Q907H | Q9Y239 | protein_coding | tolerated(0.13) | benign(0.007) | TCGA-AN-A0FL-01 | Breast | breast invasive carcinoma | Female | <65 | I/II | Unknown | Unknown | SD | |
| NOD1 | SNV | Missense_Mutation | c.7N>C | p.Glu3Gln | p.E3Q | Q9Y239 | protein_coding | tolerated(0.43) | benign(0.007) | TCGA-AR-A1AK-01 | Breast | breast invasive carcinoma | Female | >=65 | I/II | Hormone Therapy | anastrozole | SD | |
| NOD1 | SNV | Missense_Mutation | c.1319N>A | p.Ser440Asn | p.S440N | Q9Y239 | protein_coding | tolerated(0.22) | benign(0.028) | TCGA-BH-A0DQ-01 | Breast | breast invasive carcinoma | Female | <65 | I/II | Chemotherapy | doxorubicin | SD | |
| NOD1 | SNV | Missense_Mutation | novel | c.2071N>A | p.Asp691Asn | p.D691N | Q9Y239 | protein_coding | deleterious(0) | probably_damaging(0.999) | TCGA-C8-A8HR-01 | Breast | breast invasive carcinoma | Female | <65 | III/IV | Chemotherapy | 5-fluorouracil | CR |
| NOD1 | SNV | Missense_Mutation | c.2629N>G | p.Gln877Glu | p.Q877E | Q9Y239 | protein_coding | tolerated(0.95) | benign(0) | TCGA-D8-A1JA-01 | Breast | breast invasive carcinoma | Female | <65 | III/IV | Chemotherapy | adriamycin | PD | |
| NOD1 | SNV | Missense_Mutation | rs371304122 | c.2161C>T | p.Arg721Trp | p.R721W | Q9Y239 | protein_coding | deleterious(0) | benign(0.185) | TCGA-E9-A247-01 | Breast | breast invasive carcinoma | Female | <65 | I/II | Hormone Therapy | tamoxiphen | SD |
| NOD1 | insertion | Nonsense_Mutation | novel | c.2766_2767insGTAAGACATTTCCAGGCTGACTTGAACTGACCTGTGCTCTTTGTCT | p.Asn923ValfsTer10 | p.N923Vfs*10 | Q9Y239 | protein_coding | TCGA-A2-A0ER-01 | Breast | breast invasive carcinoma | Female | <65 | I/II | Chemotherapy | cytoxan | SD | ||
| NOD1 | deletion | Frame_Shift_Del | novel | c.535_536delNN | p.Ser179ProfsTer14 | p.S179Pfs*14 | Q9Y239 | protein_coding | TCGA-A2-A4S0-01 | Breast | breast invasive carcinoma | Female | >=65 | I/II | Unknown | Unknown | SD | ||
| NOD1 | insertion | Frame_Shift_Ins | novel | c.17_18insAAATAAGTAC | p.His6GlnfsTer6 | p.H6Qfs*6 | Q9Y239 | protein_coding | TCGA-A8-A08H-01 | Breast | breast invasive carcinoma | Female | >=65 | I/II | Unknown | Unknown | SD |
| Page: 1 2 3 4 5 6 7 8 9 10 11 |
Top |
Related drugs of malignant transformation related genes |
| Identification of chemicals and drugs interact with genes involved in malignant transfromation |
| (DGIdb 4.0) |
| Entrez ID | Symbol | Category | Interaction Types | Drug Claim Name | Drug Name | PMIDs |
| 10392 | NOD1 | CLINICALLY ACTIONABLE, DRUGGABLE GENOME | agonist | 178101718 | ||
| 10392 | NOD1 | CLINICALLY ACTIONABLE, DRUGGABLE GENOME | GNF-PF-3971 | CHEMBL599890 | ||
| 10392 | NOD1 | CLINICALLY ACTIONABLE, DRUGGABLE GENOME | TRACHEAL CYTOTOXIN | TRACHEAL CYTOTOXIN | 21341753 | |
| 10392 | NOD1 | CLINICALLY ACTIONABLE, DRUGGABLE GENOME | inhibitor | 310264668 |
| Page: 1 |

Copyright 2023-Present -The University of Texas Health Science Center at Houston |