
|
|||||
|
 | |
| |
| |
| |
| |
| |
|
Gene: NOCT |
Gene summary for NOCT |
| Gene information | Species | Human | Gene symbol | NOCT | Gene ID | 25819 |
| Gene name | nocturnin | |
| Gene Alias | CCR4L | |
| Cytomap | 4q31.1 | |
| Gene Type | protein-coding | GO ID | GO:0000288 | UniProtAcc | Q9UK39 |
Top |
Malignant transformation analysis |
| Identification of the aberrant gene expression in precancerous and cancerous lesions by comparing the gene expression of stem-like cells in diseased tissues with normal stem cells |
| Entrez ID | Symbol | Replicates | Species | Organ | Tissue | Adj P-value | Log2FC | Malignancy |
| 25819 | NOCT | P1T-E | Human | Esophagus | ESCC | 2.54e-06 | 2.53e-01 | 0.0875 |
| 25819 | NOCT | P2T-E | Human | Esophagus | ESCC | 1.23e-34 | 7.70e-01 | 0.1177 |
| 25819 | NOCT | P4T-E | Human | Esophagus | ESCC | 1.56e-19 | 4.93e-01 | 0.1323 |
| 25819 | NOCT | P5T-E | Human | Esophagus | ESCC | 6.85e-26 | 4.65e-01 | 0.1327 |
| 25819 | NOCT | P8T-E | Human | Esophagus | ESCC | 4.40e-09 | 2.03e-01 | 0.0889 |
| 25819 | NOCT | P9T-E | Human | Esophagus | ESCC | 4.53e-06 | 1.44e-01 | 0.1131 |
| 25819 | NOCT | P11T-E | Human | Esophagus | ESCC | 2.12e-12 | 5.25e-01 | 0.1426 |
| 25819 | NOCT | P12T-E | Human | Esophagus | ESCC | 1.05e-13 | 2.76e-01 | 0.1122 |
| 25819 | NOCT | P15T-E | Human | Esophagus | ESCC | 6.51e-09 | 2.54e-01 | 0.1149 |
| 25819 | NOCT | P16T-E | Human | Esophagus | ESCC | 1.88e-11 | 1.59e-01 | 0.1153 |
| 25819 | NOCT | P20T-E | Human | Esophagus | ESCC | 1.14e-09 | 2.54e-01 | 0.1124 |
| 25819 | NOCT | P21T-E | Human | Esophagus | ESCC | 1.14e-05 | 1.87e-01 | 0.1617 |
| 25819 | NOCT | P22T-E | Human | Esophagus | ESCC | 1.78e-03 | 7.74e-02 | 0.1236 |
| 25819 | NOCT | P23T-E | Human | Esophagus | ESCC | 3.37e-10 | 2.45e-01 | 0.108 |
| 25819 | NOCT | P24T-E | Human | Esophagus | ESCC | 2.19e-07 | 2.05e-01 | 0.1287 |
| 25819 | NOCT | P26T-E | Human | Esophagus | ESCC | 3.06e-23 | 5.13e-01 | 0.1276 |
| 25819 | NOCT | P27T-E | Human | Esophagus | ESCC | 1.85e-14 | 2.60e-01 | 0.1055 |
| 25819 | NOCT | P28T-E | Human | Esophagus | ESCC | 2.06e-08 | 2.57e-01 | 0.1149 |
| 25819 | NOCT | P30T-E | Human | Esophagus | ESCC | 7.57e-05 | 1.50e-01 | 0.137 |
| 25819 | NOCT | P31T-E | Human | Esophagus | ESCC | 5.52e-15 | 3.14e-01 | 0.1251 |
| Page: 1 2 3 |
| Tissue | Expression Dynamics | Abbreviation |
| Esophagus | 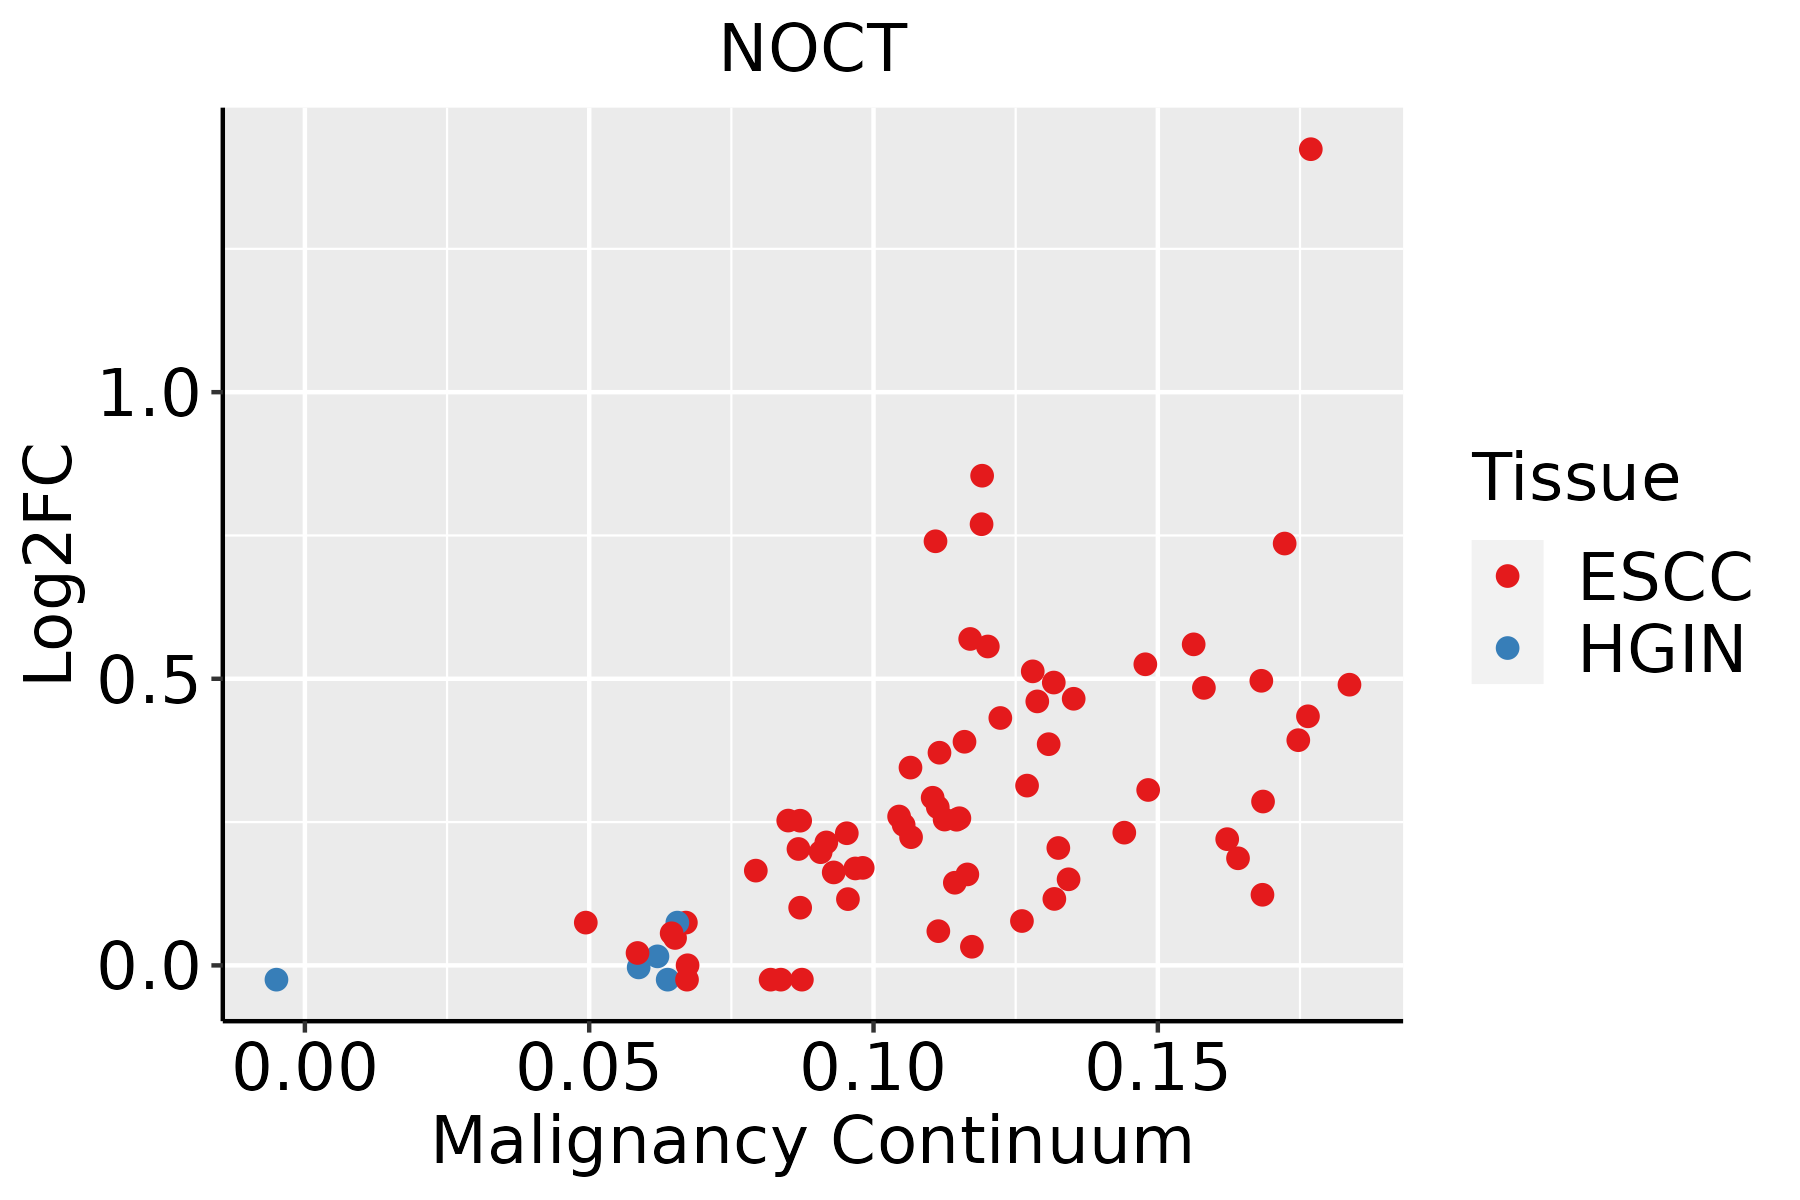 | ESCC: Esophageal squamous cell carcinoma |
| HGIN: High-grade intraepithelial neoplasias | ||
| LGIN: Low-grade intraepithelial neoplasias | ||
| Lung | 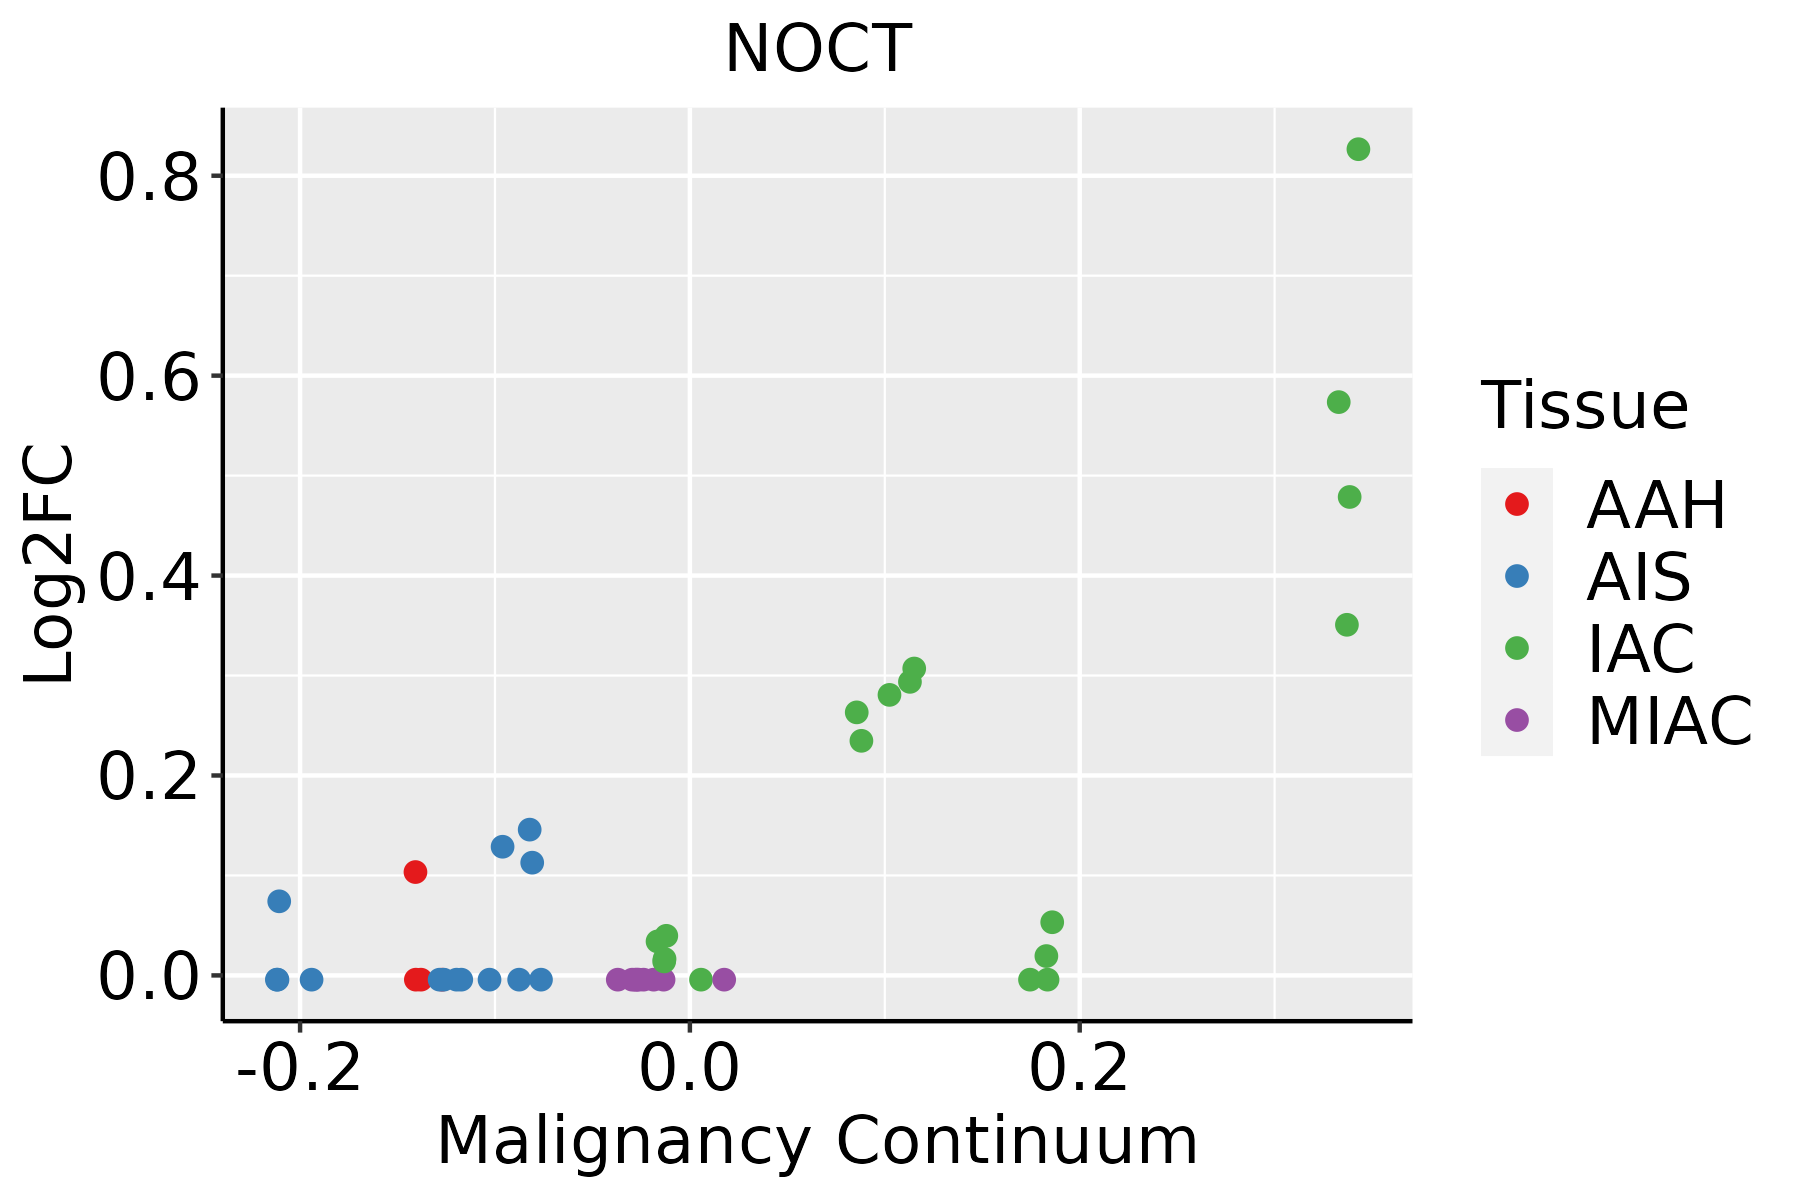 | AAH: Atypical adenomatous hyperplasia |
| AIS: Adenocarcinoma in situ | ||
| IAC: Invasive lung adenocarcinoma | ||
| MIA: Minimally invasive adenocarcinoma |
| ∗log2FC in expression of this searched gene in stem-like cells from each diseased tissue sample relative to stem-like cells in normal samples in each tissue plotted against the malignancy continuum. Samples are colored based on if they are from different disease stage. |
Top |
Malignant transformation related pathway analysis |
| Find out the enriched GO biological processes and KEGG pathways involved in transition from healthy to precancer to cancer |
| Tissue | Disease Stage | Enriched GO biological Processes |
| Colorectum | AD |  |
| Colorectum | SER |  |
| Colorectum | MSS |  |
| Colorectum | MSI-H |  |
| Colorectum | FAP |  |
| ∗Top 15 enriched GO BP terms are showed in the bar plot of each disease state in each tissue. Each row represents a significant GO biological process which is colored according to the -log10(p.adjust). |
| Page: 1 2 3 4 5 6 7 8 9 |
| GO ID | Tissue | Disease Stage | Description | Gene Ratio | Bg Ratio | pvalue | p.adjust | Count |
| GO:0009896111 | Esophagus | ESCC | positive regulation of catabolic process | 332/8552 | 492/18723 | 4.36e-23 | 9.22e-21 | 332 |
| GO:0031331111 | Esophagus | ESCC | positive regulation of cellular catabolic process | 292/8552 | 427/18723 | 8.67e-22 | 1.53e-19 | 292 |
| GO:1903311110 | Esophagus | ESCC | regulation of mRNA metabolic process | 210/8552 | 288/18723 | 3.25e-21 | 5.56e-19 | 210 |
| GO:0006401110 | Esophagus | ESCC | RNA catabolic process | 204/8552 | 278/18723 | 3.39e-21 | 5.66e-19 | 204 |
| GO:0034655110 | Esophagus | ESCC | nucleobase-containing compound catabolic process | 272/8552 | 407/18723 | 2.92e-18 | 2.90e-16 | 272 |
| GO:0006402110 | Esophagus | ESCC | mRNA catabolic process | 170/8552 | 232/18723 | 8.70e-18 | 8.00e-16 | 170 |
| GO:0006417111 | Esophagus | ESCC | regulation of translation | 304/8552 | 468/18723 | 1.53e-17 | 1.33e-15 | 304 |
| GO:004670018 | Esophagus | ESCC | heterocycle catabolic process | 286/8552 | 445/18723 | 1.12e-15 | 7.47e-14 | 286 |
| GO:004427019 | Esophagus | ESCC | cellular nitrogen compound catabolic process | 288/8552 | 451/18723 | 3.03e-15 | 1.79e-13 | 288 |
| GO:001943918 | Esophagus | ESCC | aromatic compound catabolic process | 295/8552 | 467/18723 | 1.09e-14 | 5.98e-13 | 295 |
| GO:190136118 | Esophagus | ESCC | organic cyclic compound catabolic process | 307/8552 | 495/18723 | 9.99e-14 | 4.80e-12 | 307 |
| GO:000095618 | Esophagus | ESCC | nuclear-transcribed mRNA catabolic process | 88/8552 | 112/18723 | 9.41e-13 | 4.14e-11 | 88 |
| GO:00905013 | Esophagus | ESCC | RNA phosphodiester bond hydrolysis | 110/8552 | 152/18723 | 1.95e-11 | 6.81e-10 | 110 |
| GO:0009895111 | Esophagus | ESCC | negative regulation of catabolic process | 201/8552 | 320/18723 | 3.88e-10 | 1.05e-08 | 201 |
| GO:190331316 | Esophagus | ESCC | positive regulation of mRNA metabolic process | 87/8552 | 118/18723 | 5.10e-10 | 1.32e-08 | 87 |
| GO:006101319 | Esophagus | ESCC | regulation of mRNA catabolic process | 115/8552 | 166/18723 | 5.90e-10 | 1.49e-08 | 115 |
| GO:004348719 | Esophagus | ESCC | regulation of RNA stability | 117/8552 | 170/18723 | 7.91e-10 | 1.94e-08 | 117 |
| GO:001631110 | Esophagus | ESCC | dephosphorylation | 251/8552 | 417/18723 | 1.26e-09 | 2.99e-08 | 251 |
| GO:004348819 | Esophagus | ESCC | regulation of mRNA stability | 109/8552 | 158/18723 | 2.40e-09 | 5.35e-08 | 109 |
| GO:0031330111 | Esophagus | ESCC | negative regulation of cellular catabolic process | 166/8552 | 262/18723 | 5.17e-09 | 1.08e-07 | 166 |
| Page: 1 2 3 4 |
| Pathway ID | Tissue | Disease Stage | Description | Gene Ratio | Bg Ratio | pvalue | p.adjust | qvalue | Count |
| Page: 1 |
Top |
Cell-cell communication analysis |
| Identification of potential cell-cell interactions between two cell types and their ligand-receptor pairs for different disease states |
| Ligand | Receptor | LRpair | Pathway | Tissue | Disease Stage |
| Page: 1 |
Top |
Single-cell gene regulatory network inference analysis |
| Find out the significant the regulons (TFs) and the target genes of each regulon across cell types for different disease states |
| TF | Cell Type | Tissue | Disease Stage | Target Gene | RSS | Regulon Activity |
| ∗The dot plots of a searched regulon are shown for all cell subpopulations in each disease state of each tissue based on the regulon specific score inferred using pySCENIC and by calculating the average expression. |
| Page: 1 |
Top |
Somatic mutation of malignant transformation related genes |
| Annotation of somatic variants for genes involved in malignant transformation |
| Hugo Symbol | Variant Class | Variant Classification | dbSNP RS | HGVSc | HGVSp | HGVSp Short | SWISSPROT | BIOTYPE | SIFT | PolyPhen | Tumor Sample Barcode | Tissue | Histology | Sex | Age | Stage | Therapy Types | Drugs | Outcome |
| NOCT | SNV | Missense_Mutation | c.975N>G | p.Phe325Leu | p.F325L | Q9UK39 | protein_coding | deleterious(0.03) | probably_damaging(0.936) | TCGA-AC-A23H-01 | Breast | breast invasive carcinoma | Female | >=65 | I/II | Unknown | Unknown | PD | |
| NOCT | SNV | Missense_Mutation | c.425N>T | p.Pro142Leu | p.P142L | Q9UK39 | protein_coding | deleterious(0.03) | benign(0.035) | TCGA-C8-A26X-01 | Breast | breast invasive carcinoma | Female | <65 | I/II | Chemotherapy | 5-fluorouracil | CR | |
| NOCT | insertion | Frame_Shift_Ins | novel | c.725_726insCTCCACTATTTTATCATTTACTACCATAAAATATACAC | p.Gln242HisfsTer19 | p.Q242Hfs*19 | Q9UK39 | protein_coding | TCGA-AO-A0JB-01 | Breast | breast invasive carcinoma | Female | <65 | III/IV | Chemotherapy | cyclophosphamide | SD | ||
| NOCT | deletion | Frame_Shift_Del | novel | c.1211delN | p.Arg404SerfsTer14 | p.R404Sfs*14 | Q9UK39 | protein_coding | TCGA-EW-A2FV-01 | Breast | breast invasive carcinoma | Female | <65 | III/IV | Chemotherapy | docetaxel | SD | ||
| NOCT | SNV | Missense_Mutation | c.1072N>A | p.Glu358Lys | p.E358K | Q9UK39 | protein_coding | deleterious(0) | probably_damaging(0.956) | TCGA-IR-A3LA-01 | Cervix | cervical & endocervical cancer | Female | <65 | I/II | Chemotherapy | cisplatin | CR | |
| NOCT | SNV | Missense_Mutation | novel | c.544G>A | p.Glu182Lys | p.E182K | Q9UK39 | protein_coding | deleterious(0) | probably_damaging(0.993) | TCGA-VS-A8EC-01 | Cervix | cervical & endocervical cancer | Female | <65 | III/IV | Chemotherapy | carboplatin | CR |
| NOCT | SNV | Missense_Mutation | novel | c.515G>T | p.Trp172Leu | p.W172L | Q9UK39 | protein_coding | deleterious(0) | probably_damaging(0.914) | TCGA-AA-3496-01 | Colorectum | colon adenocarcinoma | Female | >=65 | I/II | Unknown | Unknown | SD |
| NOCT | SNV | Missense_Mutation | novel | c.331C>A | p.Leu111Ile | p.L111I | Q9UK39 | protein_coding | deleterious(0.02) | possibly_damaging(0.704) | TCGA-AG-3892-01 | Colorectum | rectum adenocarcinoma | Female | <65 | I/II | Unknown | Unknown | SD |
| NOCT | SNV | Missense_Mutation | novel | c.641N>A | p.Gly214Asp | p.G214D | Q9UK39 | protein_coding | deleterious(0.01) | probably_damaging(0.954) | TCGA-A5-A1OF-01 | Endometrium | uterine corpus endometrioid carcinoma | Female | <65 | I/II | Unknown | Unknown | SD |
| NOCT | SNV | Missense_Mutation | novel | c.793G>A | p.Val265Met | p.V265M | Q9UK39 | protein_coding | deleterious(0) | probably_damaging(0.996) | TCGA-A5-A2K3-01 | Endometrium | uterine corpus endometrioid carcinoma | Female | >=65 | I/II | Chemotherapy | carboplatin | SD |
| Page: 1 2 3 4 |
Top |
Related drugs of malignant transformation related genes |
| Identification of chemicals and drugs interact with genes involved in malignant transfromation |
| (DGIdb 4.0) |
| Entrez ID | Symbol | Category | Interaction Types | Drug Claim Name | Drug Name | PMIDs |
| Page: 1 |

Copyright 2023-Present -The University of Texas Health Science Center at Houston |