
|
|||||
|
 | |
| |
| |
| |
| |
| |
|
Gene: NOC3L |
Gene summary for NOC3L |
| Gene information | Species | Human | Gene symbol | NOC3L | Gene ID | 64318 |
| Gene name | NOC3 like DNA replication regulator | |
| Gene Alias | AD24 | |
| Cytomap | 10q23.33 | |
| Gene Type | protein-coding | GO ID | GO:0006139 | UniProtAcc | Q8WTT2 |
Top |
Malignant transformation analysis |
| Identification of the aberrant gene expression in precancerous and cancerous lesions by comparing the gene expression of stem-like cells in diseased tissues with normal stem cells |
| Entrez ID | Symbol | Replicates | Species | Organ | Tissue | Adj P-value | Log2FC | Malignancy |
| 64318 | NOC3L | LZE4T | Human | Esophagus | ESCC | 1.44e-08 | 2.37e-01 | 0.0811 |
| 64318 | NOC3L | LZE8T | Human | Esophagus | ESCC | 1.40e-05 | 1.63e-01 | 0.067 |
| 64318 | NOC3L | LZE24T | Human | Esophagus | ESCC | 9.36e-11 | 2.74e-01 | 0.0596 |
| 64318 | NOC3L | LZE6T | Human | Esophagus | ESCC | 2.16e-03 | 9.14e-02 | 0.0845 |
| 64318 | NOC3L | P1T-E | Human | Esophagus | ESCC | 5.83e-09 | 3.35e-01 | 0.0875 |
| 64318 | NOC3L | P2T-E | Human | Esophagus | ESCC | 3.39e-21 | 5.07e-01 | 0.1177 |
| 64318 | NOC3L | P4T-E | Human | Esophagus | ESCC | 7.93e-16 | 2.89e-01 | 0.1323 |
| 64318 | NOC3L | P5T-E | Human | Esophagus | ESCC | 1.32e-13 | 3.17e-01 | 0.1327 |
| 64318 | NOC3L | P8T-E | Human | Esophagus | ESCC | 4.05e-11 | 1.78e-01 | 0.0889 |
| 64318 | NOC3L | P9T-E | Human | Esophagus | ESCC | 8.69e-12 | 1.85e-01 | 0.1131 |
| 64318 | NOC3L | P10T-E | Human | Esophagus | ESCC | 2.98e-11 | 1.66e-01 | 0.116 |
| 64318 | NOC3L | P11T-E | Human | Esophagus | ESCC | 2.26e-14 | 4.10e-01 | 0.1426 |
| 64318 | NOC3L | P12T-E | Human | Esophagus | ESCC | 3.26e-12 | 3.43e-01 | 0.1122 |
| 64318 | NOC3L | P15T-E | Human | Esophagus | ESCC | 1.02e-17 | 4.00e-01 | 0.1149 |
| 64318 | NOC3L | P16T-E | Human | Esophagus | ESCC | 5.22e-18 | 4.17e-01 | 0.1153 |
| 64318 | NOC3L | P17T-E | Human | Esophagus | ESCC | 1.45e-04 | 3.35e-01 | 0.1278 |
| 64318 | NOC3L | P19T-E | Human | Esophagus | ESCC | 2.83e-04 | 4.91e-01 | 0.1662 |
| 64318 | NOC3L | P20T-E | Human | Esophagus | ESCC | 4.88e-18 | 3.52e-01 | 0.1124 |
| 64318 | NOC3L | P21T-E | Human | Esophagus | ESCC | 1.99e-16 | 3.43e-01 | 0.1617 |
| 64318 | NOC3L | P22T-E | Human | Esophagus | ESCC | 4.46e-10 | 1.45e-01 | 0.1236 |
| Page: 1 2 3 4 5 |
| Tissue | Expression Dynamics | Abbreviation |
| Esophagus | 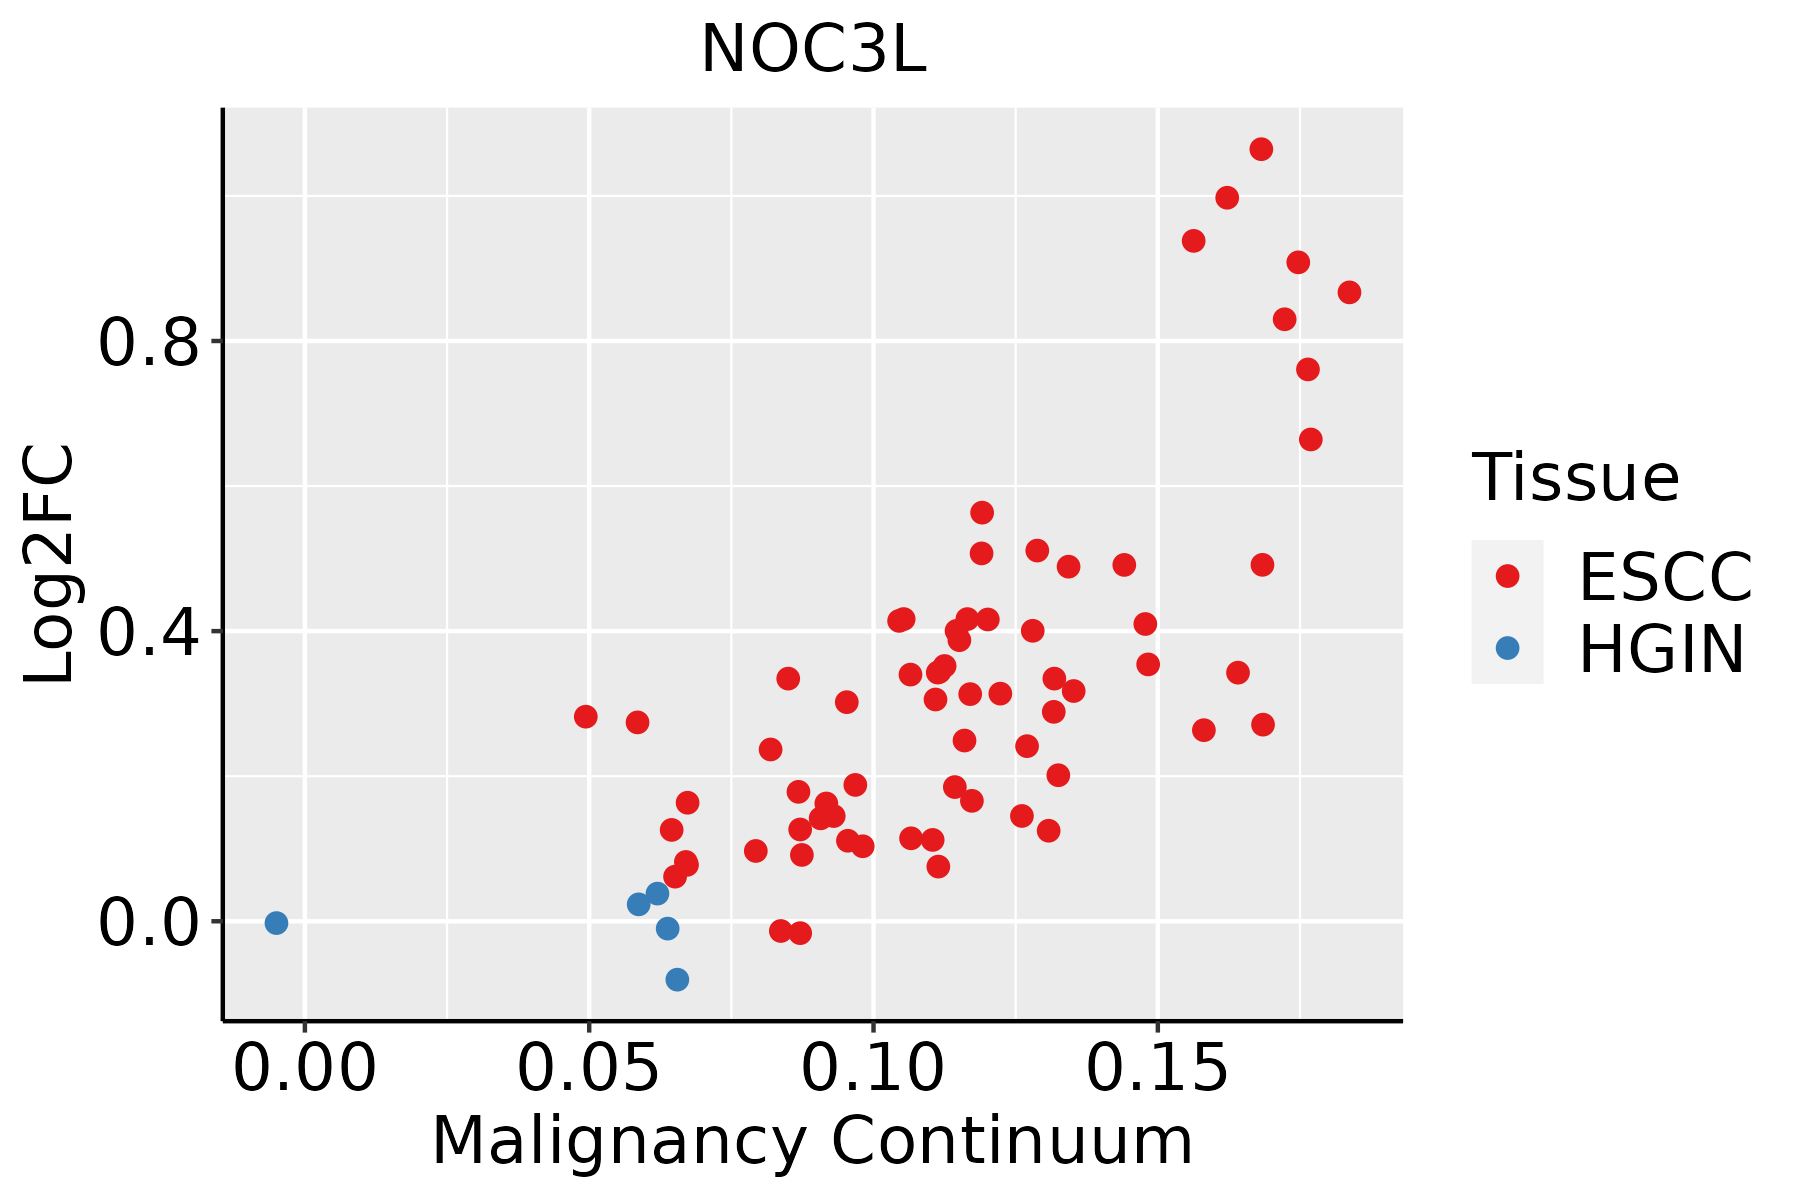 | ESCC: Esophageal squamous cell carcinoma |
| HGIN: High-grade intraepithelial neoplasias | ||
| LGIN: Low-grade intraepithelial neoplasias | ||
| Liver | 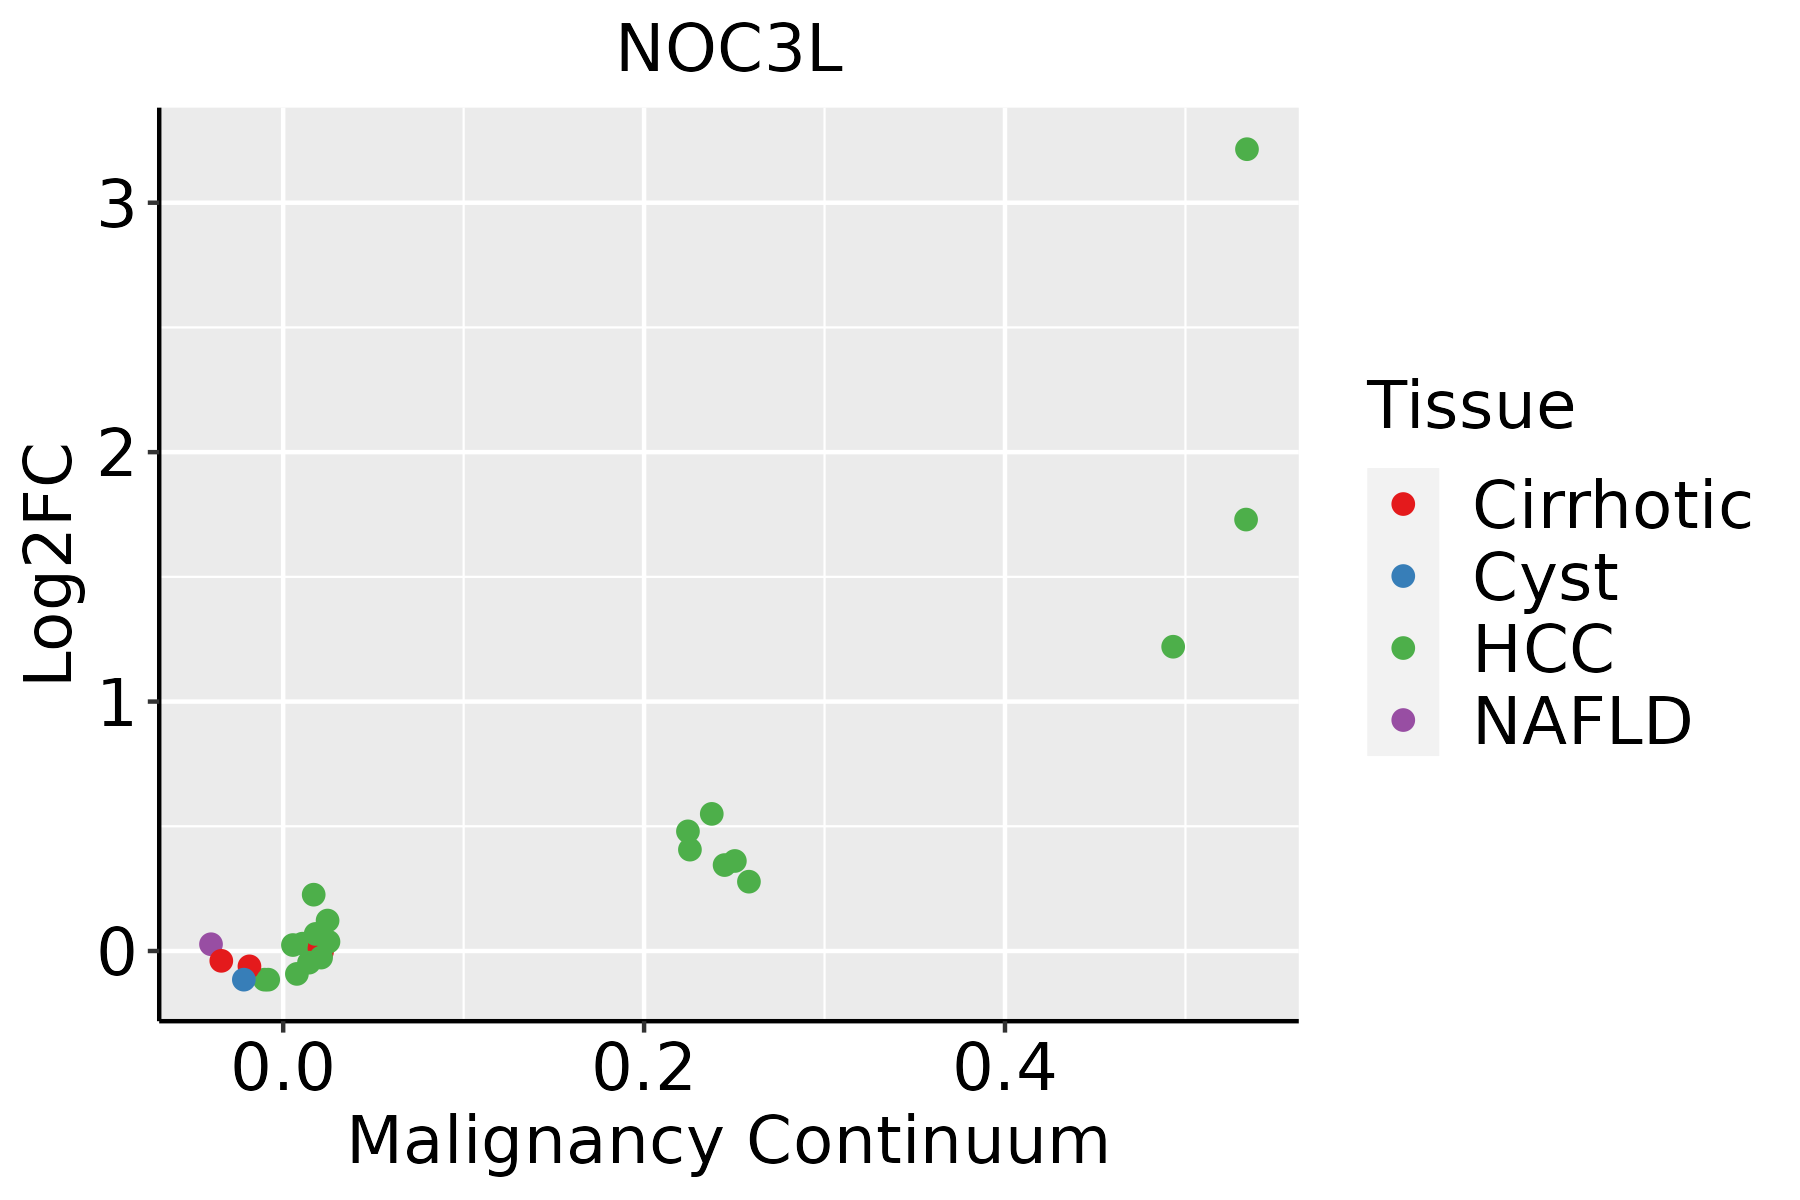 | HCC: Hepatocellular carcinoma |
| NAFLD: Non-alcoholic fatty liver disease | ||
| Oral Cavity | 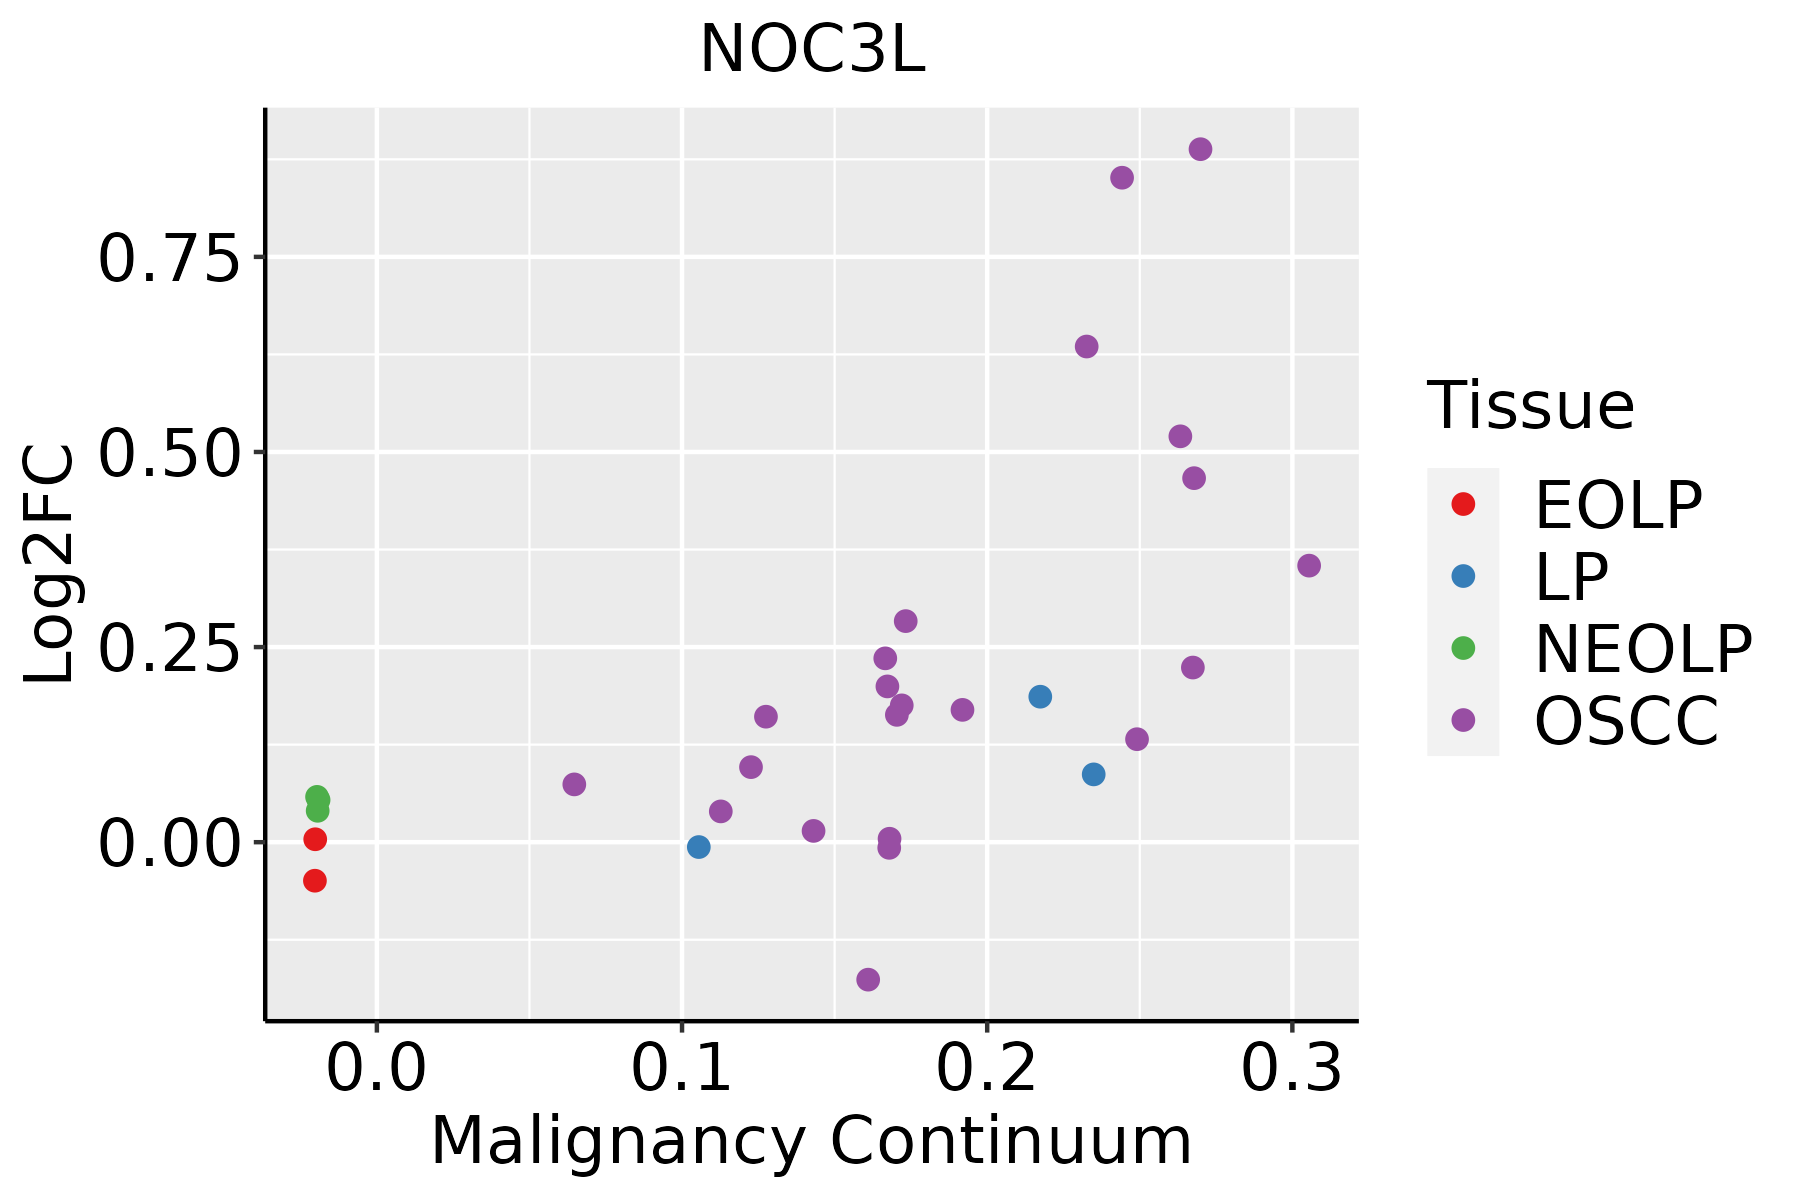 | EOLP: Erosive Oral lichen planus |
| LP: leukoplakia | ||
| NEOLP: Non-erosive oral lichen planus | ||
| OSCC: Oral squamous cell carcinoma | ||
| Skin |  | AK: Actinic keratosis |
| cSCC: Cutaneous squamous cell carcinoma | ||
| SCCIS:squamous cell carcinoma in situ | ||
| Thyroid | 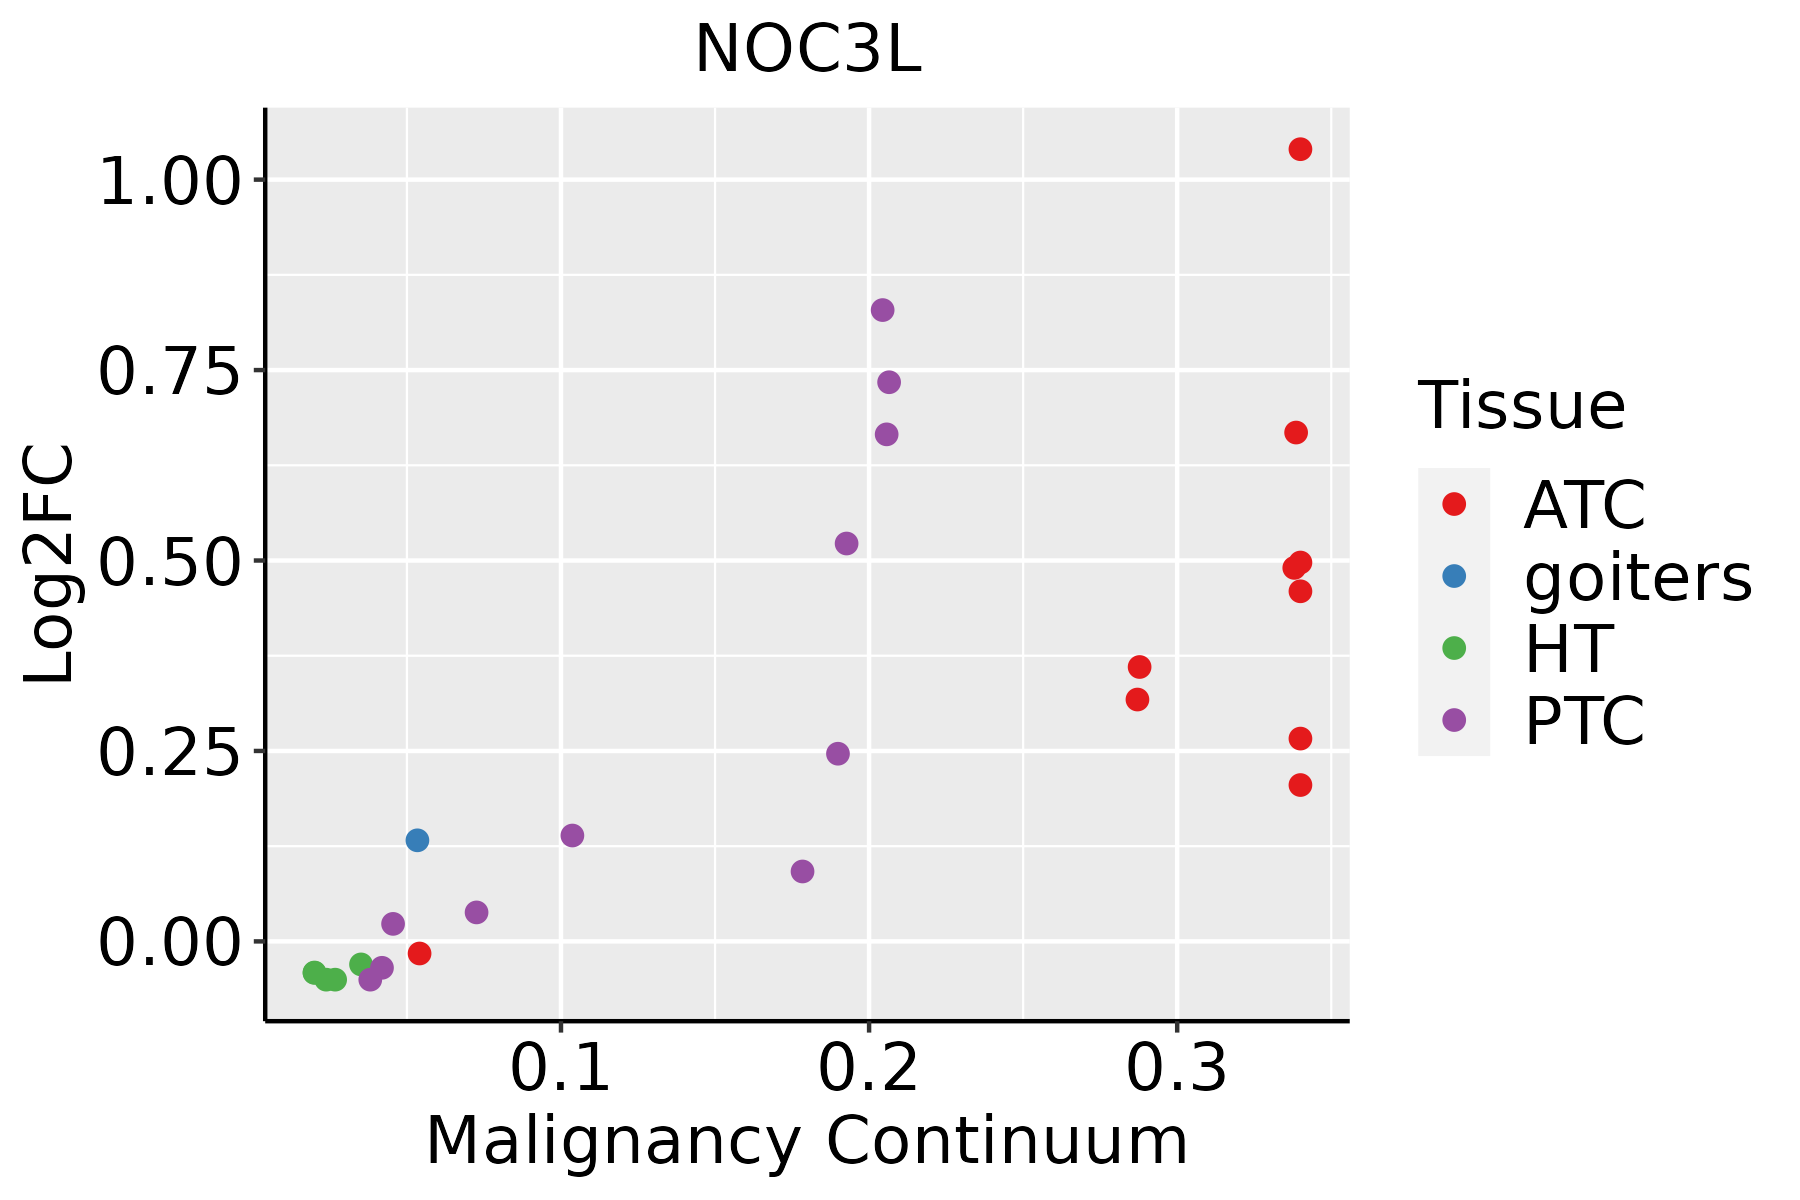 | ATC: Anaplastic thyroid cancer |
| HT: Hashimoto's thyroiditis | ||
| PTC: Papillary thyroid cancer |
| ∗log2FC in expression of this searched gene in stem-like cells from each diseased tissue sample relative to stem-like cells in normal samples in each tissue plotted against the malignancy continuum. Samples are colored based on if they are from different disease stage. |
Top |
Malignant transformation related pathway analysis |
| Find out the enriched GO biological processes and KEGG pathways involved in transition from healthy to precancer to cancer |
| Tissue | Disease Stage | Enriched GO biological Processes |
| Colorectum | AD |  |
| Colorectum | SER |  |
| Colorectum | MSS |  |
| Colorectum | MSI-H |  |
| Colorectum | FAP |  |
| ∗Top 15 enriched GO BP terms are showed in the bar plot of each disease state in each tissue. Each row represents a significant GO biological process which is colored according to the -log10(p.adjust). |
| Page: 1 2 3 4 5 6 7 8 9 |
| GO ID | Tissue | Disease Stage | Description | Gene Ratio | Bg Ratio | pvalue | p.adjust | Count |
| GO:00062604 | Esophagus | ESCC | DNA replication | 181/8552 | 260/18723 | 3.55e-15 | 2.05e-13 | 181 |
| GO:00062612 | Esophagus | ESCC | DNA-dependent DNA replication | 100/8552 | 151/18723 | 2.61e-07 | 3.94e-06 | 100 |
| GO:00454449 | Esophagus | ESCC | fat cell differentiation | 135/8552 | 229/18723 | 3.38e-05 | 2.78e-04 | 135 |
| GO:00062701 | Esophagus | ESCC | DNA replication initiation | 27/8552 | 34/18723 | 6.01e-05 | 4.62e-04 | 27 |
| GO:00062601 | Liver | HCC | DNA replication | 146/7958 | 260/18723 | 5.68e-06 | 7.02e-05 | 146 |
| GO:00454441 | Liver | HCC | fat cell differentiation | 120/7958 | 229/18723 | 1.52e-03 | 8.05e-03 | 120 |
| GO:0006261 | Liver | HCC | DNA-dependent DNA replication | 80/7958 | 151/18723 | 5.91e-03 | 2.44e-02 | 80 |
| GO:00062603 | Oral cavity | OSCC | DNA replication | 159/7305 | 260/18723 | 3.25e-13 | 1.59e-11 | 159 |
| GO:00062611 | Oral cavity | OSCC | DNA-dependent DNA replication | 84/7305 | 151/18723 | 2.46e-05 | 2.30e-04 | 84 |
| GO:00454448 | Oral cavity | OSCC | fat cell differentiation | 120/7305 | 229/18723 | 2.48e-05 | 2.32e-04 | 120 |
| GO:0006270 | Oral cavity | OSCC | DNA replication initiation | 25/7305 | 34/18723 | 4.63e-05 | 3.90e-04 | 25 |
| GO:004544410 | Skin | AK | fat cell differentiation | 43/1910 | 229/18723 | 5.87e-05 | 8.75e-04 | 43 |
| GO:00062605 | Skin | AK | DNA replication | 40/1910 | 260/18723 | 5.49e-03 | 3.03e-02 | 40 |
| GO:000626012 | Skin | cSCC | DNA replication | 106/4864 | 260/18723 | 1.18e-07 | 2.77e-06 | 106 |
| GO:00062606 | Thyroid | PTC | DNA replication | 114/5968 | 260/18723 | 3.09e-05 | 2.95e-04 | 114 |
| GO:004544418 | Thyroid | PTC | fat cell differentiation | 102/5968 | 229/18723 | 3.66e-05 | 3.40e-04 | 102 |
| GO:000626013 | Thyroid | ATC | DNA replication | 124/6293 | 260/18723 | 1.58e-06 | 1.93e-05 | 124 |
| GO:004544423 | Thyroid | ATC | fat cell differentiation | 105/6293 | 229/18723 | 7.42e-05 | 5.62e-04 | 105 |
| Page: 1 |
| Pathway ID | Tissue | Disease Stage | Description | Gene Ratio | Bg Ratio | pvalue | p.adjust | qvalue | Count |
| Page: 1 |
Top |
Cell-cell communication analysis |
| Identification of potential cell-cell interactions between two cell types and their ligand-receptor pairs for different disease states |
| Ligand | Receptor | LRpair | Pathway | Tissue | Disease Stage |
| Page: 1 |
Top |
Single-cell gene regulatory network inference analysis |
| Find out the significant the regulons (TFs) and the target genes of each regulon across cell types for different disease states |
| TF | Cell Type | Tissue | Disease Stage | Target Gene | RSS | Regulon Activity |
| ∗The dot plots of a searched regulon are shown for all cell subpopulations in each disease state of each tissue based on the regulon specific score inferred using pySCENIC and by calculating the average expression. |
| Page: 1 |
Top |
Somatic mutation of malignant transformation related genes |
| Annotation of somatic variants for genes involved in malignant transformation |
| Hugo Symbol | Variant Class | Variant Classification | dbSNP RS | HGVSc | HGVSp | HGVSp Short | SWISSPROT | BIOTYPE | SIFT | PolyPhen | Tumor Sample Barcode | Tissue | Histology | Sex | Age | Stage | Therapy Types | Drugs | Outcome |
| NOC3L | SNV | Missense_Mutation | novel | c.130N>G | p.Lys44Glu | p.K44E | Q8WTT2 | protein_coding | deleterious(0.01) | probably_damaging(0.985) | TCGA-AN-A046-01 | Breast | breast invasive carcinoma | Female | >=65 | I/II | Unknown | Unknown | SD |
| NOC3L | SNV | Missense_Mutation | c.269A>T | p.Asp90Val | p.D90V | Q8WTT2 | protein_coding | deleterious(0) | possibly_damaging(0.617) | TCGA-AN-A0AK-01 | Breast | breast invasive carcinoma | Female | >=65 | I/II | Unknown | Unknown | SD | |
| NOC3L | SNV | Missense_Mutation | rs753022530 | c.40N>T | p.Arg14Cys | p.R14C | Q8WTT2 | protein_coding | deleterious_low_confidence(0) | probably_damaging(0.996) | TCGA-BH-A0H9-01 | Breast | breast invasive carcinoma | Female | >=65 | I/II | Hormone Therapy | arimidex | SD |
| NOC3L | SNV | Missense_Mutation | novel | c.352G>A | p.Glu118Lys | p.E118K | Q8WTT2 | protein_coding | tolerated(0.19) | benign(0.012) | TCGA-E9-A5FL-01 | Breast | breast invasive carcinoma | Female | >=65 | I/II | Unknown | Unknown | SD |
| NOC3L | insertion | Frame_Shift_Ins | novel | c.48_49insCTTGGGAGGCTGAGGCAGGAGAATGGCGTGAACTCAG | p.Ile17LeufsTer16 | p.I17Lfs*16 | Q8WTT2 | protein_coding | TCGA-AO-A03R-01 | Breast | breast invasive carcinoma | Female | <65 | I/II | Chemotherapy | doxorubicin | SD | ||
| NOC3L | insertion | Nonsense_Mutation | novel | c.958_959insGGCAGATCACGAGGTCAGGAGATCGAGACCACCCCAGCTAACAT | p.Lys320ArgfsTer14 | p.K320Rfs*14 | Q8WTT2 | protein_coding | TCGA-B6-A0IN-01 | Breast | breast invasive carcinoma | Female | <65 | I/II | Unknown | Unknown | PD | ||
| NOC3L | SNV | Missense_Mutation | c.1669C>T | p.His557Tyr | p.H557Y | Q8WTT2 | protein_coding | tolerated(0.07) | probably_damaging(0.985) | TCGA-EK-A3GK-01 | Cervix | cervical & endocervical cancer | Female | <65 | I/II | Unknown | Unknown | SD | |
| NOC3L | SNV | Missense_Mutation | c.1767N>G | p.Phe589Leu | p.F589L | Q8WTT2 | protein_coding | tolerated(1) | benign(0.005) | TCGA-IR-A3LK-01 | Cervix | cervical & endocervical cancer | Female | >=65 | I/II | Chemotherapy | cisplatin | PD | |
| NOC3L | SNV | Missense_Mutation | c.1336N>C | p.Lys446Gln | p.K446Q | Q8WTT2 | protein_coding | deleterious(0.01) | possibly_damaging(0.559) | TCGA-AA-3510-01 | Colorectum | colon adenocarcinoma | Male | >=65 | I/II | Unknown | Unknown | SD | |
| NOC3L | SNV | Missense_Mutation | c.1336N>C | p.Lys446Gln | p.K446Q | Q8WTT2 | protein_coding | deleterious(0.01) | possibly_damaging(0.559) | TCGA-AA-3977-01 | Colorectum | colon adenocarcinoma | Male | >=65 | I/II | Unknown | Unknown | SD |
| Page: 1 2 3 4 5 6 7 8 |
Top |
Related drugs of malignant transformation related genes |
| Identification of chemicals and drugs interact with genes involved in malignant transfromation |
| (DGIdb 4.0) |
| Entrez ID | Symbol | Category | Interaction Types | Drug Claim Name | Drug Name | PMIDs |
| Page: 1 |

Copyright 2023-Present -The University of Texas Health Science Center at Houston |