Schematic overview of the cellular and molecular mechanisms involved in the cancer progression, including the proposed cellular and molecular mechanisms in cancer cells trajectory. AT1: alveolar type 1 cells; AT2: alveolar type 2 cells; AAH: atypical adenomatous hyperplasia; AIS: adenocarcinoma in situ; MIA: minimally invasive adenocarcinoma; IA: invasive adenocarcinoma; EMT: epithelial-mesenchymal transition

Home

Download

Statistics

Help

Contact

Center for Computational Systems Medicine
leaf

Gene summary

leaf

Malignant transformation analysis

leaf

Malignant transformation related pathway analysis

leaf

Cell-cell communication analysis

leaf

Single-cell gene regulatory network inference analysis

leaf

Somatic mutation of malignant transformation related genes

leaf

Related drugs of malignant transformation related genes

Gene: NOC2L

Gene summary for NOC2L

check button Gene summary.

Gene informationSpeciesHuman
Gene symbol

NOC2L

Gene ID

26155

Gene nameNOC2 like nucleolar associated transcriptional repressor
Gene AliasNET15
Cytomap1p36.33
Gene Typeprotein-coding
GO ID

GO:0000122

UniProtAcc

Q9Y3T9


Top

Malignant transformation analysis

check button Identification of the aberrant gene expression in precancerous and cancerous lesions by comparing the gene expression of stem-like cells in diseased tissues with normal stem cells
check button Malignant transformation involving gene list.
Entrez IDSymbolReplicatesSpeciesOrganTissueAdj P-valueLog2FCMalignancy
26155NOC2LLZE2THumanEsophagusESCC2.84e-035.15e-010.082
26155NOC2LLZE4THumanEsophagusESCC2.36e-173.69e-010.0811
26155NOC2LLZE7THumanEsophagusESCC3.51e-127.08e-010.0667
26155NOC2LLZE8THumanEsophagusESCC1.18e-043.15e-010.067
26155NOC2LLZE20THumanEsophagusESCC1.25e-072.62e-010.0662
26155NOC2LLZE22THumanEsophagusESCC1.18e-075.58e-010.068
26155NOC2LLZE24THumanEsophagusESCC1.38e-216.60e-010.0596
26155NOC2LP1T-EHumanEsophagusESCC5.85e-136.13e-010.0875
26155NOC2LP2T-EHumanEsophagusESCC5.52e-397.13e-010.1177
26155NOC2LP4T-EHumanEsophagusESCC1.14e-391.09e+000.1323
26155NOC2LP5T-EHumanEsophagusESCC2.65e-397.28e-010.1327
26155NOC2LP8T-EHumanEsophagusESCC7.74e-478.52e-010.0889
26155NOC2LP9T-EHumanEsophagusESCC9.52e-113.36e-010.1131
26155NOC2LP10T-EHumanEsophagusESCC5.00e-589.58e-010.116
26155NOC2LP11T-EHumanEsophagusESCC4.68e-096.50e-010.1426
26155NOC2LP12T-EHumanEsophagusESCC2.40e-275.49e-010.1122
26155NOC2LP15T-EHumanEsophagusESCC1.12e-348.76e-010.1149
26155NOC2LP16T-EHumanEsophagusESCC6.32e-405.68e-010.1153
26155NOC2LP17T-EHumanEsophagusESCC1.25e-138.99e-010.1278
26155NOC2LP19T-EHumanEsophagusESCC2.35e-088.63e-010.1662
Page: 1 2 3 4 5 6 

check button Transcriptomic changes along malignancy continuum.
TissueExpression DynamicsAbbreviation
EsophagusThe image shows the transcriptomic changes along malignancy continuum.log2FC in expression of this searched gene in stem-like cells from each diseased tissue sample relative to stem-like cells in normal samples in each tissue plotted against the malignancy continuum. Samples are colored based on if they are from different disease stage.
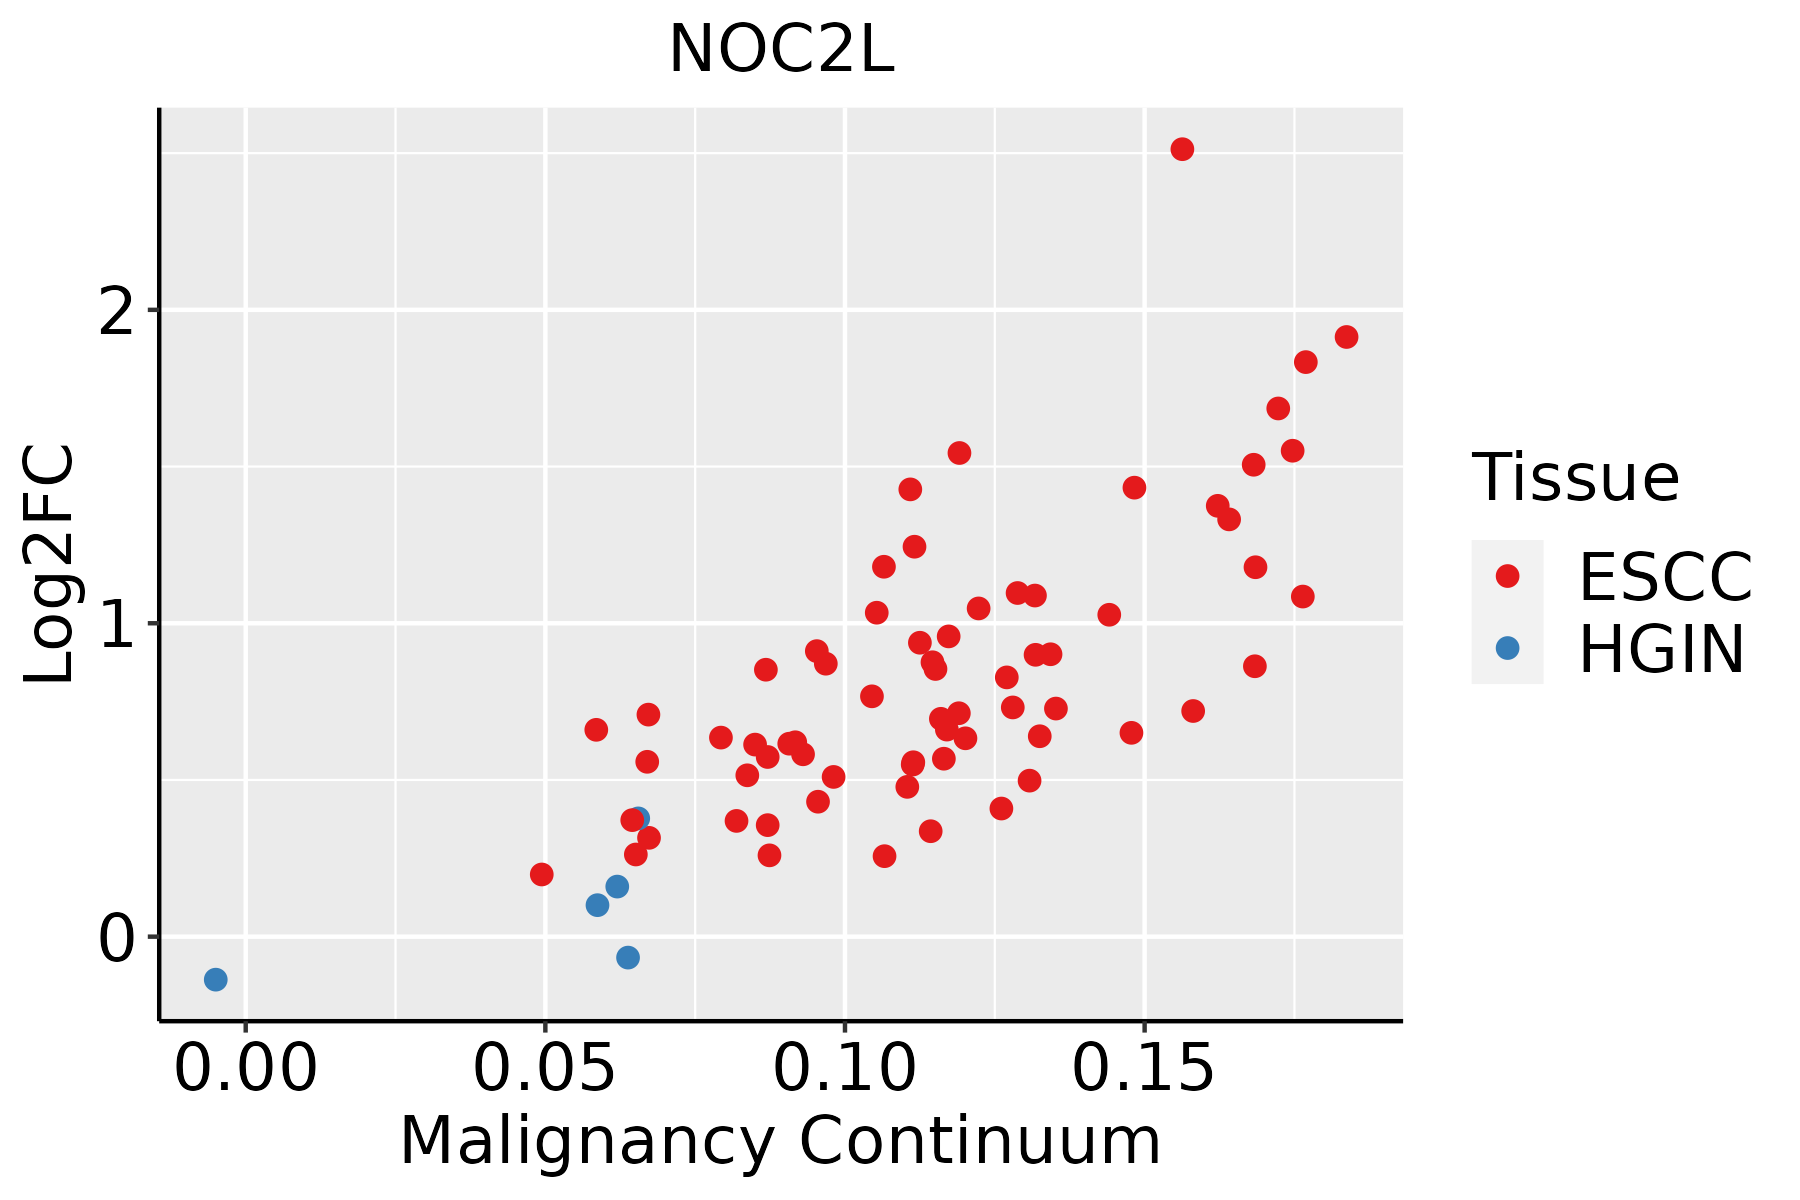
ESCC: Esophageal squamous cell carcinoma
HGIN: High-grade intraepithelial neoplasias
LGIN: Low-grade intraepithelial neoplasias
LiverThe image shows the transcriptomic changes along malignancy continuum.log2FC in expression of this searched gene in stem-like cells from each diseased tissue sample relative to stem-like cells in normal samples in each tissue plotted against the malignancy continuum. Samples are colored based on if they are from different disease stage.
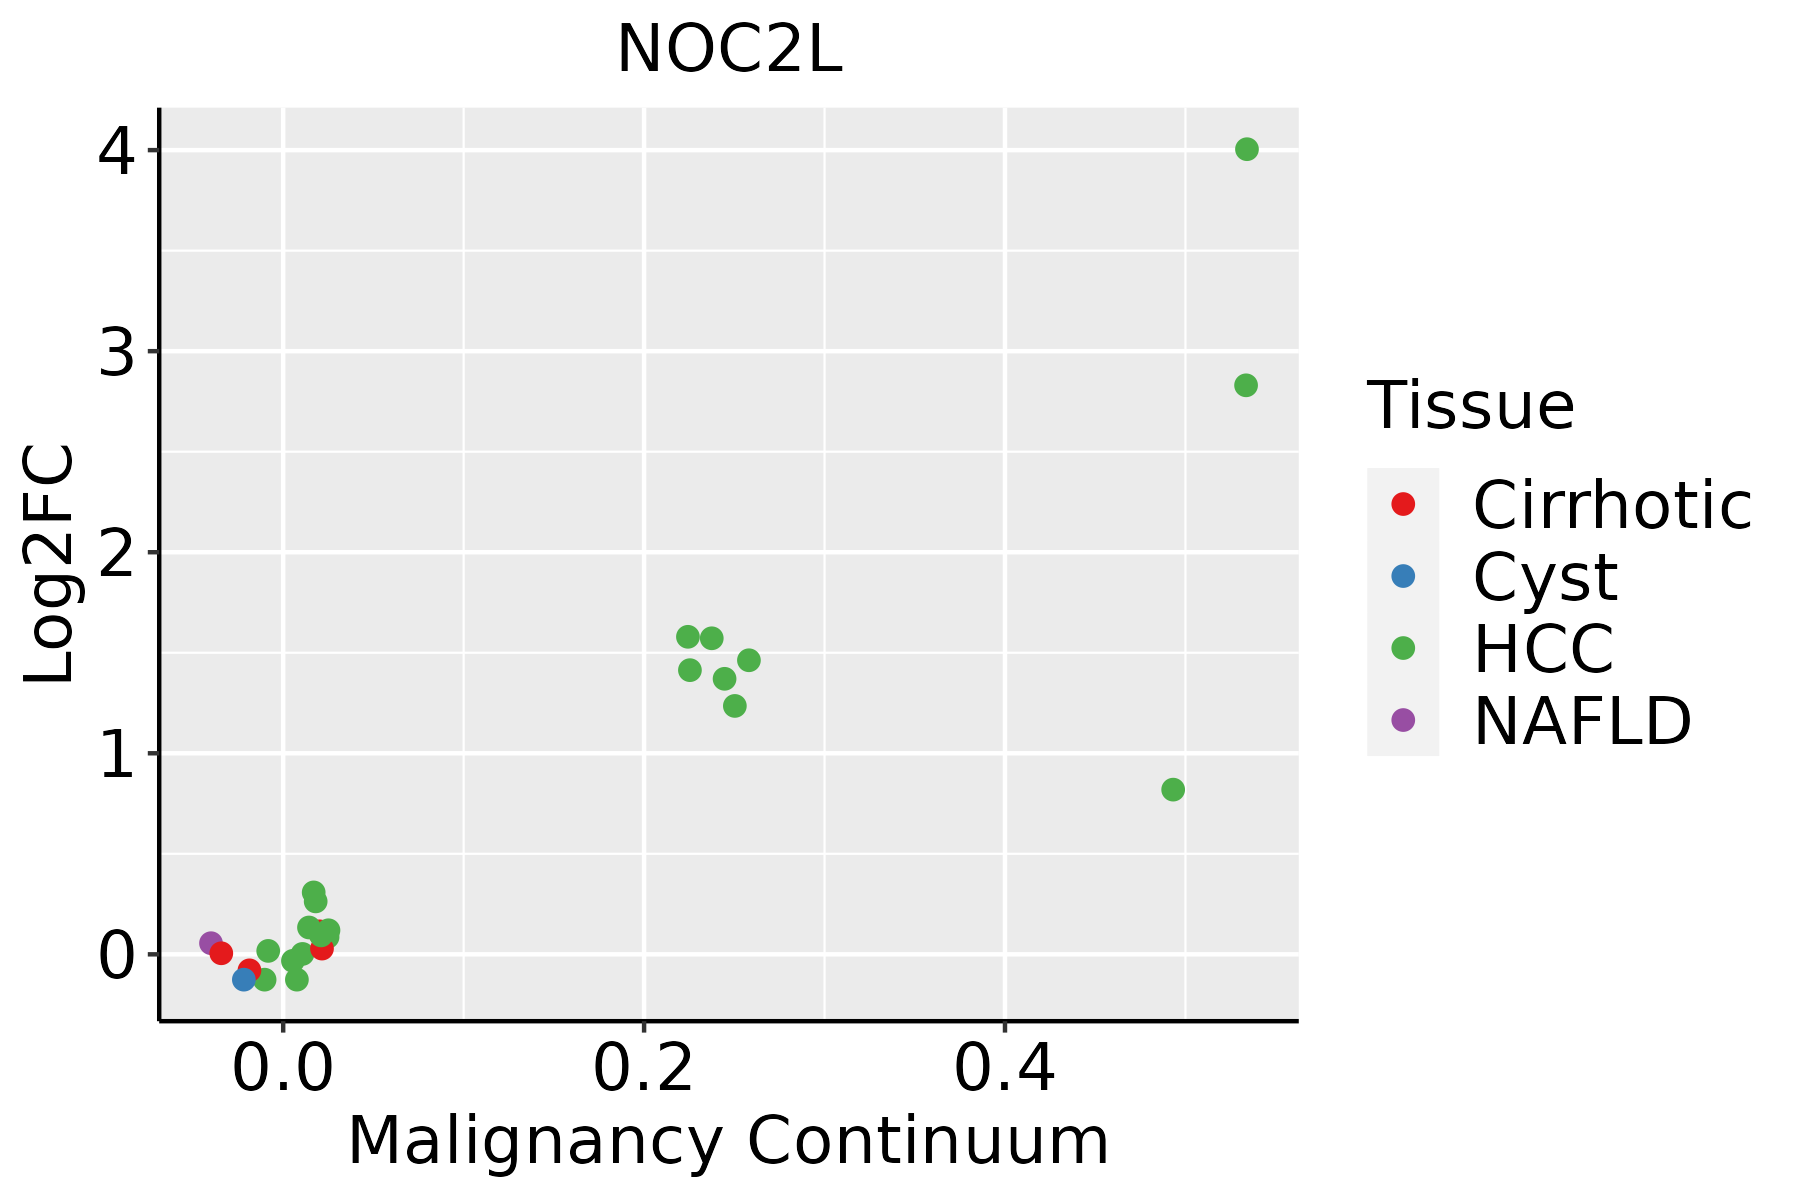
HCC: Hepatocellular carcinoma
NAFLD: Non-alcoholic fatty liver disease
Oral CavityThe image shows the transcriptomic changes along malignancy continuum.log2FC in expression of this searched gene in stem-like cells from each diseased tissue sample relative to stem-like cells in normal samples in each tissue plotted against the malignancy continuum. Samples are colored based on if they are from different disease stage.
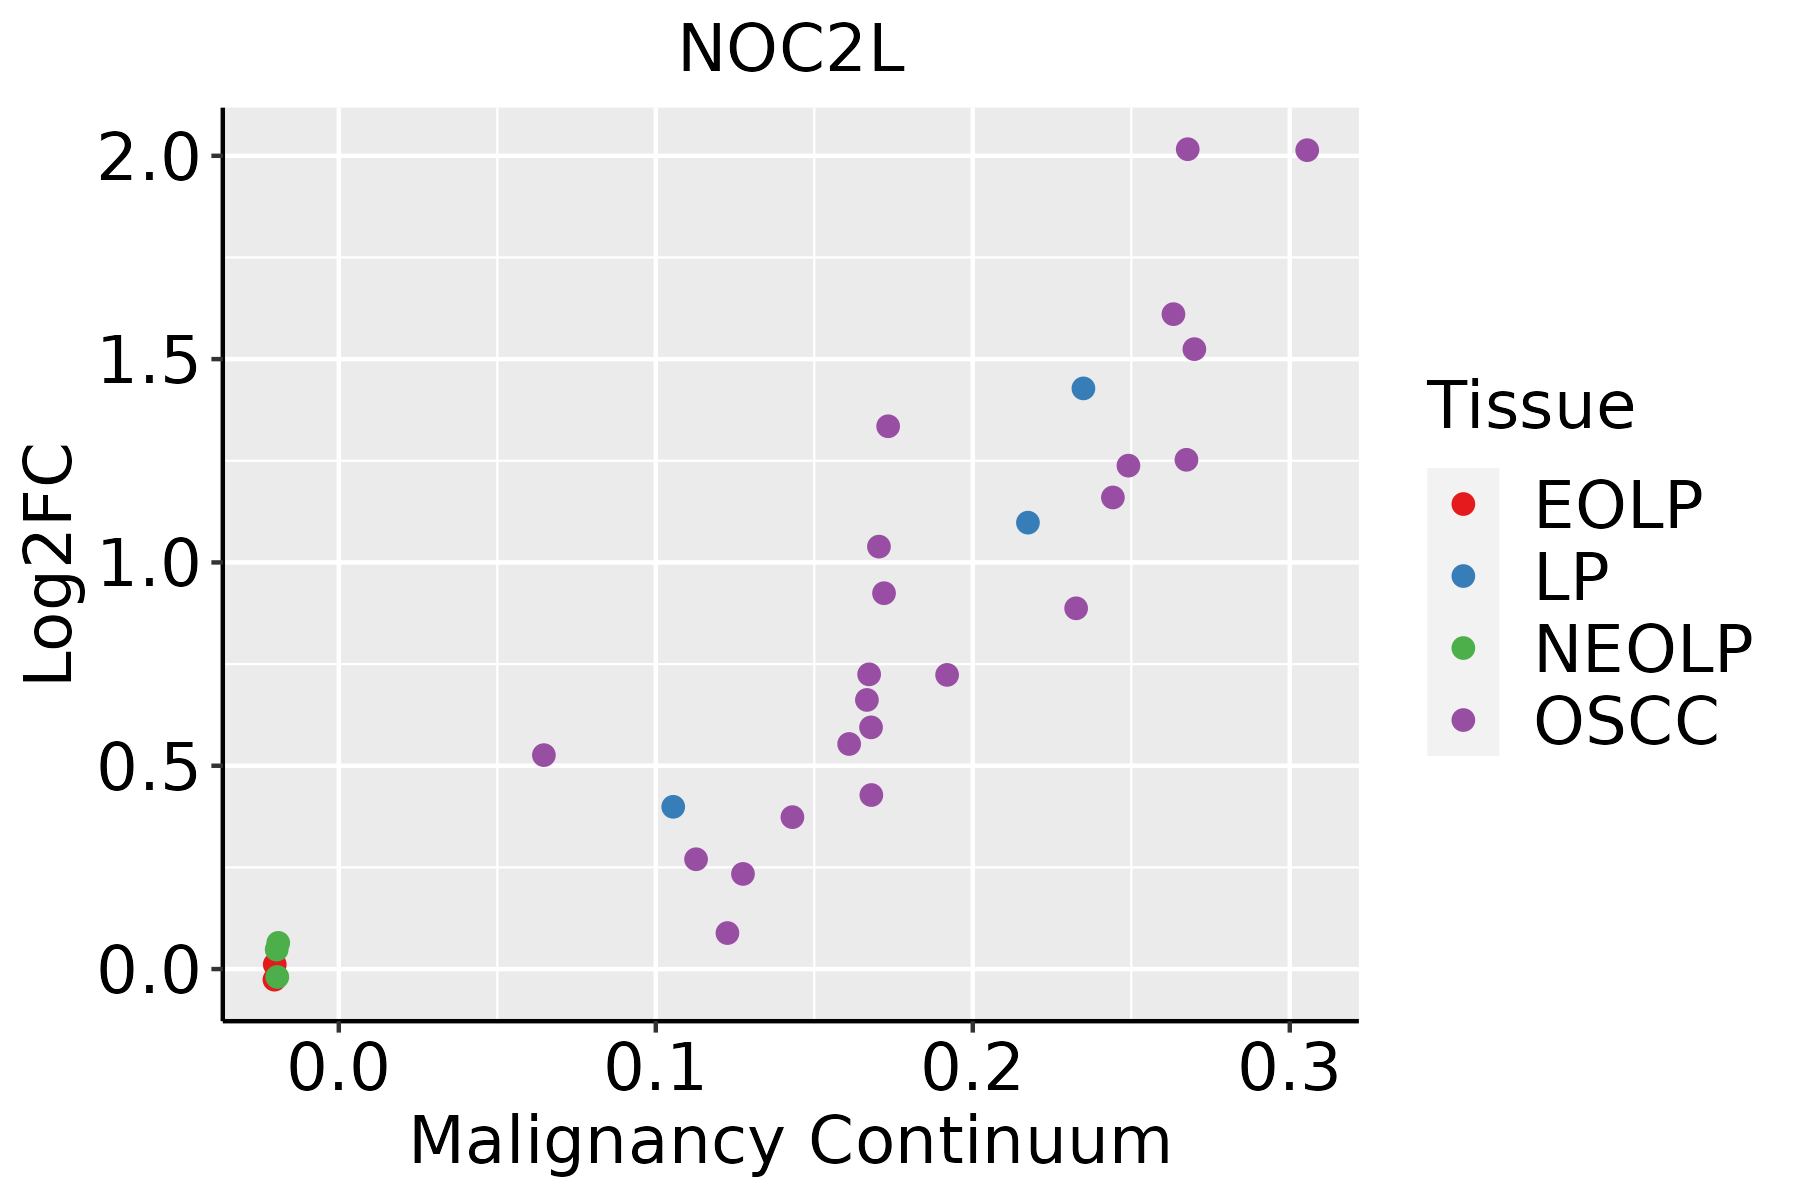
EOLP: Erosive Oral lichen planus
LP: leukoplakia
NEOLP: Non-erosive oral lichen planus
OSCC: Oral squamous cell carcinoma
SkinThe image shows the transcriptomic changes along malignancy continuum.log2FC in expression of this searched gene in stem-like cells from each diseased tissue sample relative to stem-like cells in normal samples in each tissue plotted against the malignancy continuum. Samples are colored based on if they are from different disease stage.
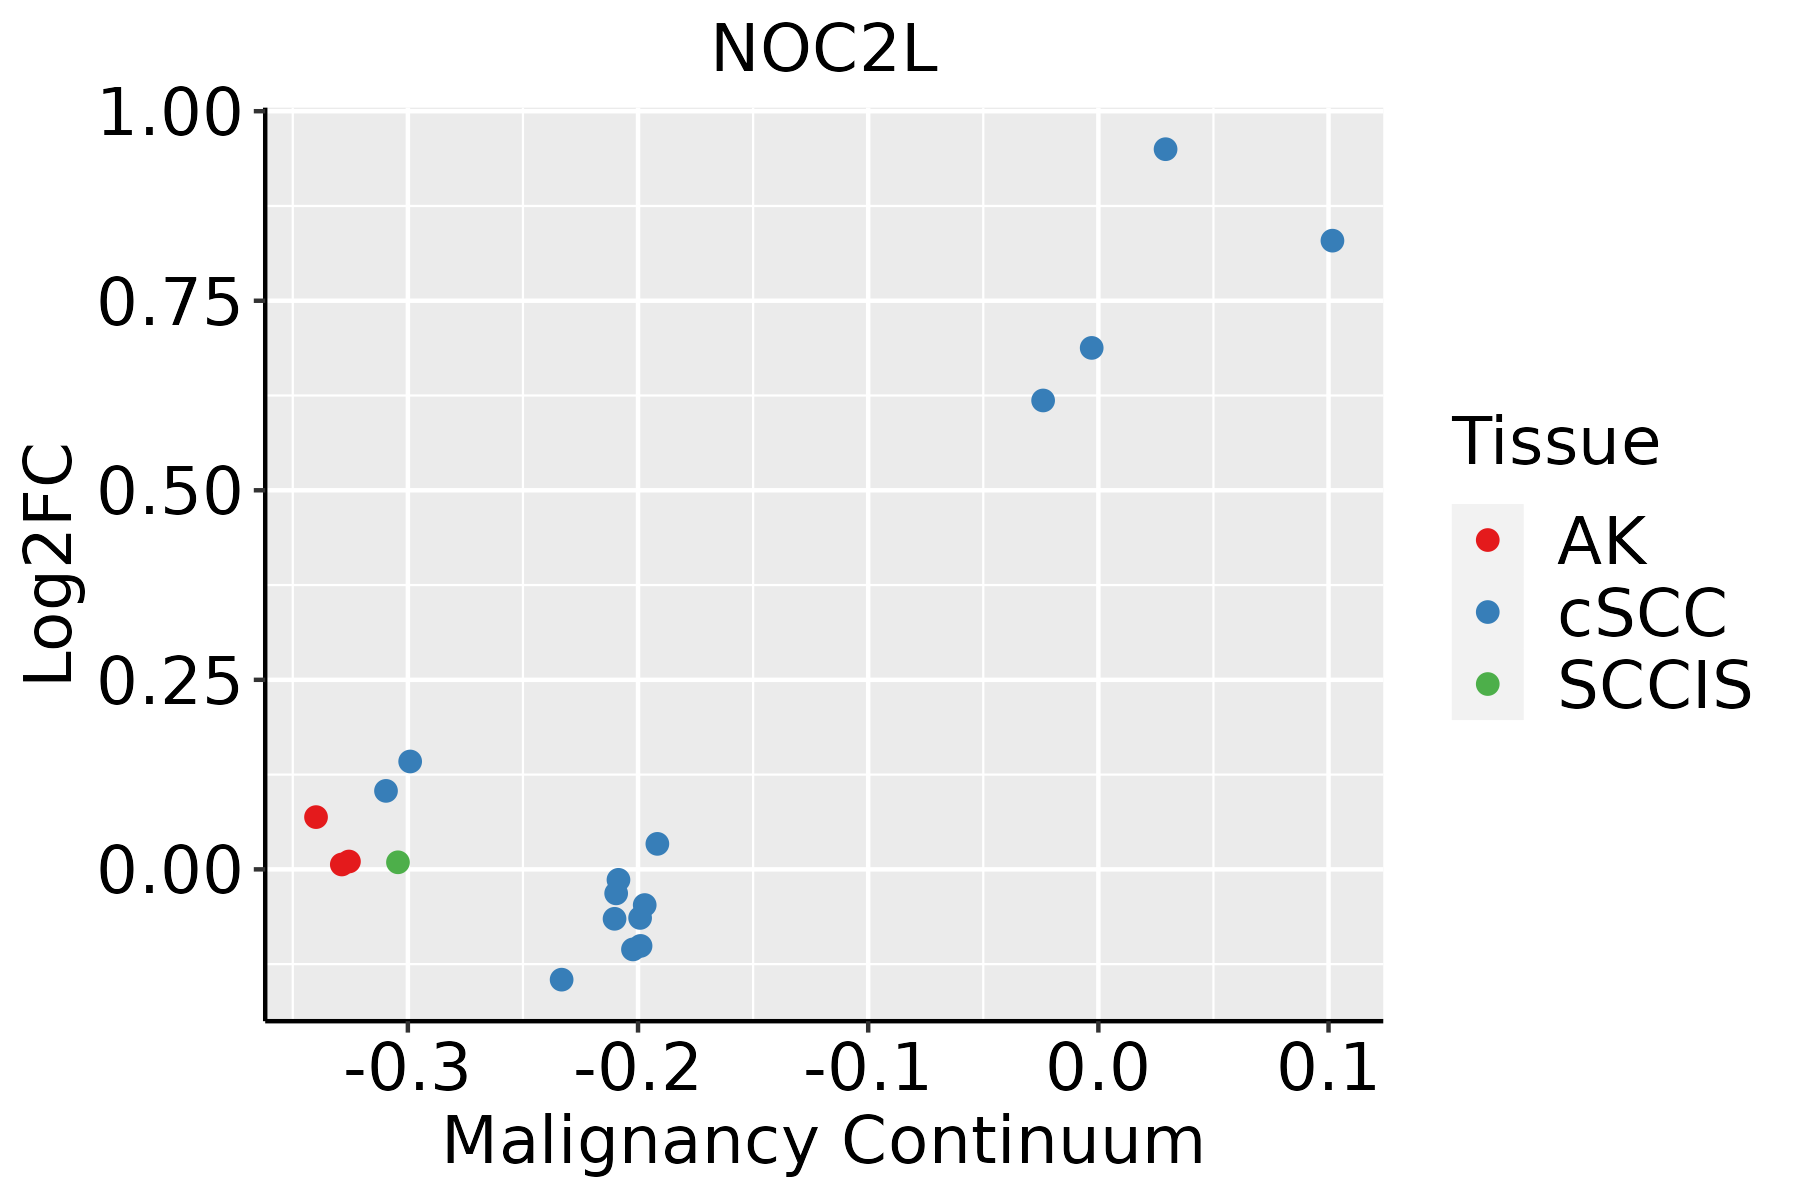
AK: Actinic keratosis
cSCC: Cutaneous squamous cell carcinoma
SCCIS:squamous cell carcinoma in situ
ThyroidThe image shows the transcriptomic changes along malignancy continuum.log2FC in expression of this searched gene in stem-like cells from each diseased tissue sample relative to stem-like cells in normal samples in each tissue plotted against the malignancy continuum. Samples are colored based on if they are from different disease stage.
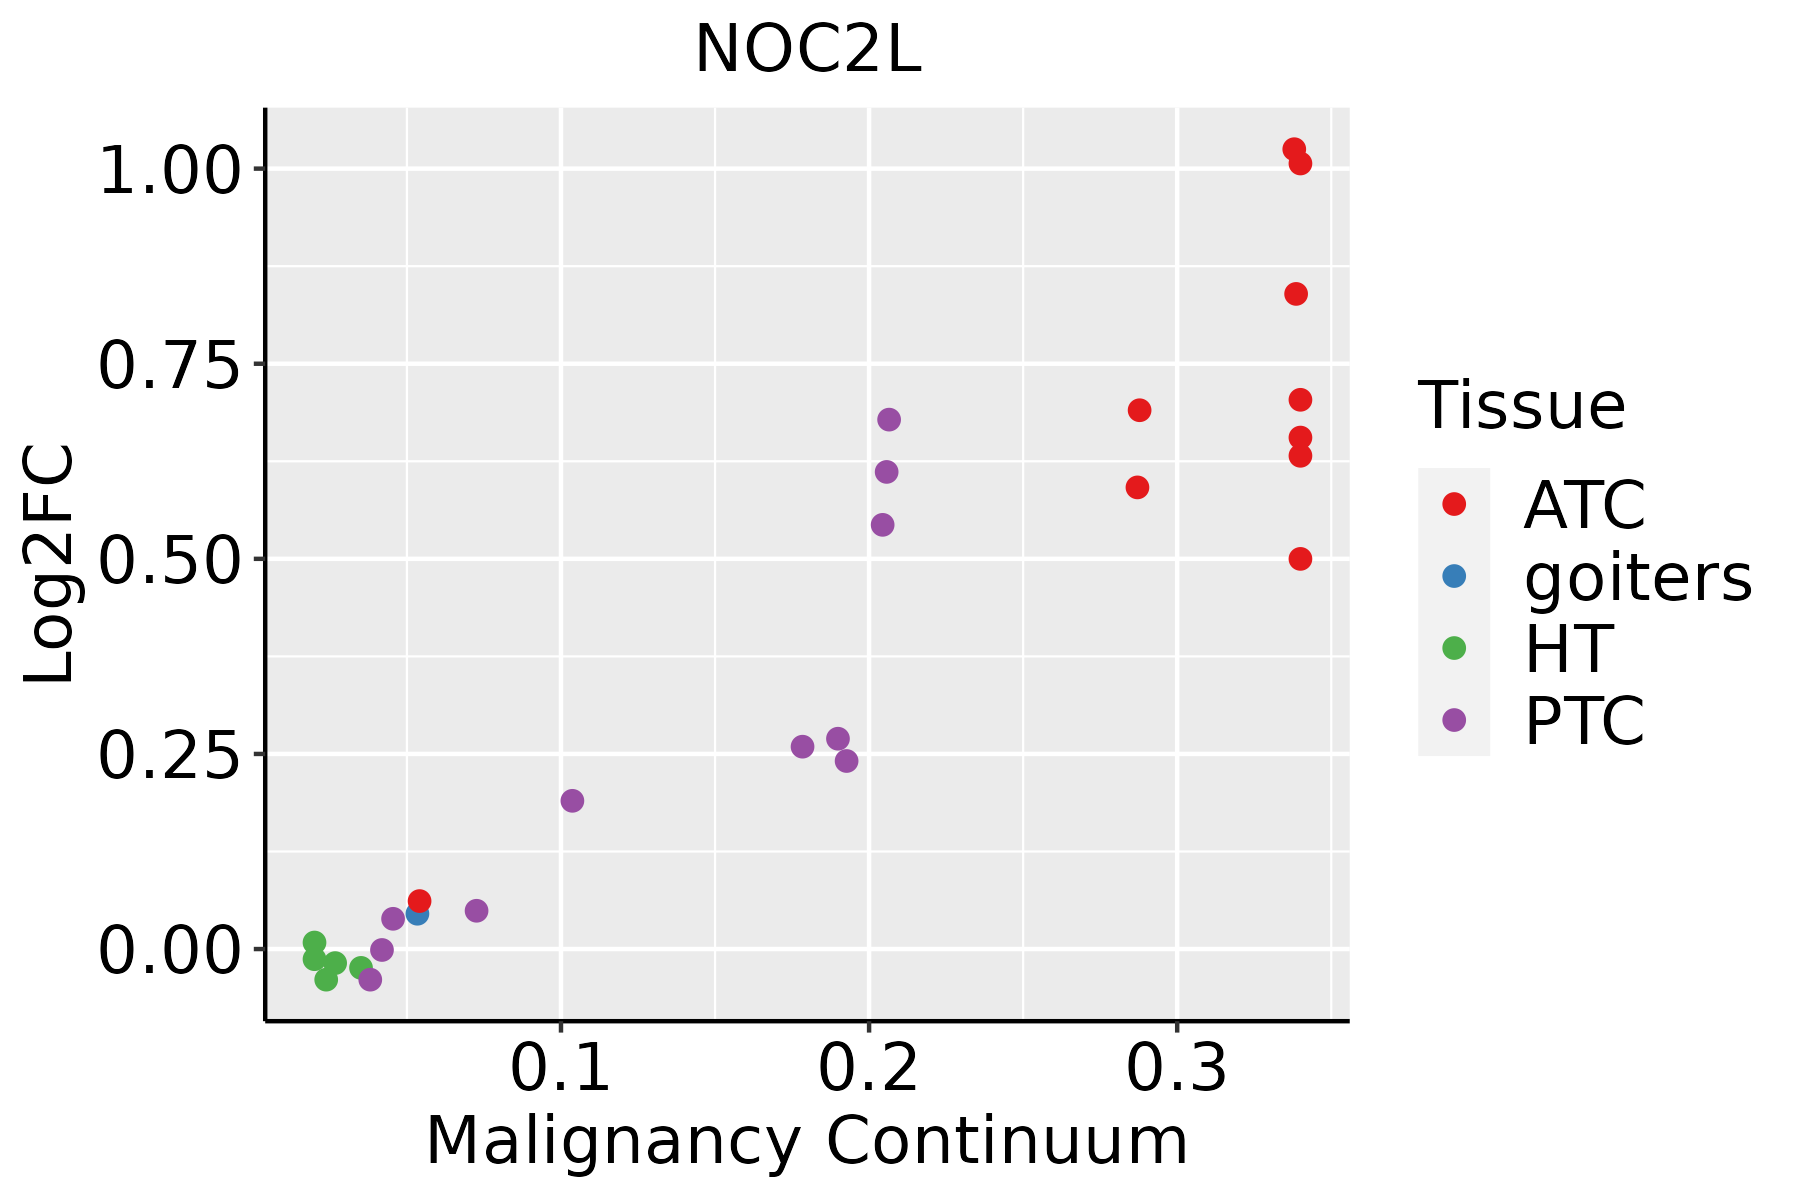
ATC: Anaplastic thyroid cancer
HT: Hashimoto's thyroiditis
PTC: Papillary thyroid cancer
∗log2FC in expression of this searched gene in stem-like cells from each diseased tissue sample relative to stem-like cells in normal samples in each tissue plotted against the malignancy continuum. Samples are colored based on if they are from different disease stage.

Top

Malignant transformation related pathway analysis

check buttonFind out the enriched GO biological processes and KEGG pathways involved in transition from healthy to precancer to cancer
check button Figure of enriched GO biological processes.
TissueDisease StageEnriched GO biological Processes
ColorectumADGO analysis - Figure of enriched GO biological processes: Top 15 enriched GO BP terms are showed in the bar plot of each disease state in each tissue. Each row represents a significant GO biological process which is colored according to the -log10(p.adjust).
ColorectumSERGO analysis - Figure of enriched GO biological processes: Top 15 enriched GO BP terms are showed in the bar plot of each disease state in each tissue. Each row represents a significant GO biological process which is colored according to the -log10(p.adjust).
ColorectumMSSGO analysis - Figure of enriched GO biological processes: Top 15 enriched GO BP terms are showed in the bar plot of each disease state in each tissue. Each row represents a significant GO biological process which is colored according to the -log10(p.adjust).
ColorectumMSI-HGO analysis - Figure of enriched GO biological processes: Top 15 enriched GO BP terms are showed in the bar plot of each disease state in each tissue. Each row represents a significant GO biological process which is colored according to the -log10(p.adjust).
ColorectumFAPGO analysis - Figure of enriched GO biological processes: Top 15 enriched GO BP terms are showed in the bar plot of each disease state in each tissue. Each row represents a significant GO biological process which is colored according to the -log10(p.adjust).
∗Top 15 enriched GO BP terms are showed in the bar plot of each disease state in each tissue. Each row represents a significant GO biological process which is colored according to the -log10(p.adjust).
Page: 1 2 3 4 5 6 7 8 9 

check button Enriched GO biological processes.
GO IDTissueDisease StageDescriptionGene RatioBg Ratiopvaluep.adjustCount
GO:0022613111EsophagusESCCribonucleoprotein complex biogenesis365/8552463/187231.74e-491.11e-45365
GO:0042254111EsophagusESCCribosome biogenesis252/8552299/187233.27e-441.04e-40252
GO:0097193111EsophagusESCCintrinsic apoptotic signaling pathway222/8552288/187235.87e-282.02e-25222
GO:001657015EsophagusESCChistone modification323/8552463/187232.61e-267.88e-24323
GO:2001233111EsophagusESCCregulation of apoptotic signaling pathway256/8552356/187234.11e-241.04e-21256
GO:001820514EsophagusESCCpeptidyl-lysine modification259/8552376/187233.90e-205.26e-18259
GO:2001242111EsophagusESCCregulation of intrinsic apoptotic signaling pathway128/8552164/187231.75e-171.50e-15128
GO:2001234111EsophagusESCCnegative regulation of apoptotic signaling pathway161/8552224/187231.24e-158.09e-14161
GO:0042273111EsophagusESCCribosomal large subunit biogenesis65/855272/187231.53e-159.82e-1465
GO:000941113EsophagusESCCresponse to UV115/8552149/187233.29e-151.93e-13115
GO:001839413EsophagusESCCpeptidyl-lysine acetylation123/8552169/187236.58e-132.94e-11123
GO:004354313EsophagusESCCprotein acylation165/8552243/187231.69e-127.14e-11165
GO:000647313EsophagusESCCprotein acetylation140/8552201/187234.37e-121.69e-10140
GO:2001243111EsophagusESCCnegative regulation of intrinsic apoptotic signaling pathway78/855298/187235.50e-122.10e-1078
GO:001839313EsophagusESCCinternal peptidyl-lysine acetylation114/8552158/187231.16e-114.24e-10114
GO:000647513EsophagusESCCinternal protein amino acid acetylation115/8552160/187231.43e-115.08e-10115
GO:00165735EsophagusESCChistone acetylation110/8552152/187231.95e-116.81e-10110
GO:000931419EsophagusESCCresponse to radiation277/8552456/187234.42e-111.43e-09277
GO:003464413EsophagusESCCcellular response to UV70/855290/187234.59e-101.20e-0870
GO:007121419EsophagusESCCcellular response to abiotic stimulus206/8552331/187237.52e-101.88e-08206
Page: 1 2 3 4 5 6 7 8 9 10 11 12 13 

check button Enriched KEGG pathways.
Pathway IDTissueDisease StageDescriptionGene RatioBg Ratiopvaluep.adjustqvalueCount
Page: 1 

Top

Cell-cell communication analysis

check buttonIdentification of potential cell-cell interactions between two cell types and their ligand-receptor pairs for different disease states
LigandReceptorLRpairPathwayTissueDisease Stage
Page: 1 

Top

Single-cell gene regulatory network inference analysis

check buttonFind out the significant the regulons (TFs) and the target genes of each regulon across cell types for different disease states
TFCell TypeTissueDisease StageTarget GeneRSSRegulon Activity
∗The dot plots of a searched regulon are shown for all cell subpopulations in each disease state of each tissue based on the regulon specific score inferred using pySCENIC and by calculating the average expression.
Page: 1 

Top

Somatic mutation of malignant transformation related genes

check buttonAnnotation of somatic variants for genes involved in malignant transformation
Hugo SymbolVariant ClassVariant ClassificationdbSNP RSHGVScHGVSpHGVSp ShortSWISSPROTBIOTYPESIFTPolyPhenTumor Sample BarcodeTissueHistologySexAgeStageTherapy TypesDrugsOutcome
NOC2LSNVMissense_Mutationc.576N>Tp.Glu192Aspp.E192DQ9Y3T9protein_codingtolerated(0.37)benign(0.015)TCGA-A8-A08H-01Breastbreast invasive carcinomaFemale>=65I/IIUnknownUnknownSD
NOC2LSNVMissense_Mutationrs144525853c.469T>Cp.Trp157Argp.W157RQ9Y3T9protein_codingdeleterious(0)probably_damaging(0.99)TCGA-GM-A2DM-01Breastbreast invasive carcinomaFemale<65I/IIChemotherapytaxolCR
NOC2LSNVMissense_Mutationc.468A>Tp.Arg156Serp.R156SQ9Y3T9protein_codingtolerated(0.16)benign(0.079)TCGA-GM-A2DM-01Breastbreast invasive carcinomaFemale<65I/IIChemotherapytaxolCR
NOC2LinsertionNonsense_Mutationnovelc.52_53insTATGTTGGTGAGTTGTGCAAAAATp.Glu18delinsValCysTrpTerValValGlnLysTerp.E18delinsVCW*VVQK*Q9Y3T9protein_codingTCGA-A8-A06P-01Breastbreast invasive carcinomaFemale<65III/IVUnspecificSD
NOC2LinsertionFrame_Shift_Insnovelc.535_536insGACACTTTp.Ala179GlyfsTer110p.A179Gfs*110Q9Y3T9protein_codingTCGA-A8-A07J-01Breastbreast invasive carcinomaFemale<65I/IIChemotherapy5-fluorouracilCR
NOC2LdeletionFrame_Shift_Delnovelc.1438delCp.Leu480TrpfsTer16p.L480Wfs*16Q9Y3T9protein_codingTCGA-EW-A2FV-01Breastbreast invasive carcinomaFemale<65III/IVChemotherapydocetaxelSD
NOC2LSNVMissense_Mutationrs777608108c.1556G>Ap.Arg519Glnp.R519QQ9Y3T9protein_codingdeleterious(0.02)benign(0.058)TCGA-2W-A8YY-01Cervixcervical & endocervical cancerFemale<65I/IIChemotherapycisplatinCR
NOC2LSNVMissense_Mutationnovelc.133N>Cp.Glu45Glnp.E45QQ9Y3T9protein_codingtolerated(0.53)benign(0.225)TCGA-JW-A5VL-01Cervixcervical & endocervical cancerFemale<65I/IIUnknownUnknownSD
NOC2LSNVMissense_Mutationrs112703241c.1378N>Tp.Arg460Cysp.R460CQ9Y3T9protein_codingdeleterious(0)probably_damaging(1)TCGA-A6-6653-01Colorectumcolon adenocarcinomaMale>=65I/IIUnknownUnknownSD
NOC2LSNVMissense_Mutationrs773184606c.326N>Tp.Pro109Leup.P109LQ9Y3T9protein_codingtolerated(0.22)benign(0.031)TCGA-AY-4071-01Colorectumcolon adenocarcinomaFemale<65I/IIUnknownUnknownSD
Page: 1 2 3 4 5 6 

Top

Related drugs of malignant transformation related genes

check buttonIdentification of chemicals and drugs interact with genes involved in malignant transfromation
(DGIdb 4.0)
Entrez IDSymbolCategoryInteraction TypesDrug Claim NameDrug NamePMIDs
Page: 1