
|
|||||
|
 | |
| |
| |
| |
| |
| |
|
Gene: NOB1 |
Gene summary for NOB1 |
| Gene information | Species | Human | Gene symbol | NOB1 | Gene ID | 28987 |
| Gene name | NIN1 (RPN12) binding protein 1 homolog | |
| Gene Alias | ART-4 | |
| Cytomap | 16q22.1 | |
| Gene Type | protein-coding | GO ID | GO:0000469 | UniProtAcc | Q9ULX3 |
Top |
Malignant transformation analysis |
| Identification of the aberrant gene expression in precancerous and cancerous lesions by comparing the gene expression of stem-like cells in diseased tissues with normal stem cells |
| Entrez ID | Symbol | Replicates | Species | Organ | Tissue | Adj P-value | Log2FC | Malignancy |
| 28987 | NOB1 | HTA11_3410_2000001011 | Human | Colorectum | AD | 5.96e-07 | 2.52e-01 | 0.0155 |
| 28987 | NOB1 | HTA11_1938_2000001011 | Human | Colorectum | AD | 9.55e-07 | 4.22e-01 | -0.0811 |
| 28987 | NOB1 | HTA11_78_2000001011 | Human | Colorectum | AD | 6.50e-05 | 3.46e-01 | -0.1088 |
| 28987 | NOB1 | HTA11_347_2000001011 | Human | Colorectum | AD | 6.03e-09 | 3.83e-01 | -0.1954 |
| 28987 | NOB1 | HTA11_1391_2000001011 | Human | Colorectum | AD | 2.86e-13 | 5.94e-01 | -0.059 |
| 28987 | NOB1 | HTA11_546_2000001011 | Human | Colorectum | AD | 2.09e-03 | 3.78e-01 | -0.0842 |
| 28987 | NOB1 | HTA11_7862_2000001011 | Human | Colorectum | AD | 3.49e-04 | 4.79e-01 | -0.0179 |
| 28987 | NOB1 | HTA11_866_3004761011 | Human | Colorectum | AD | 2.50e-32 | 8.32e-01 | 0.096 |
| 28987 | NOB1 | HTA11_8622_2000001021 | Human | Colorectum | SER | 7.58e-14 | 8.86e-01 | 0.0528 |
| 28987 | NOB1 | HTA11_7663_2000001011 | Human | Colorectum | SER | 1.61e-03 | 5.29e-01 | 0.0131 |
| 28987 | NOB1 | HTA11_10623_2000001011 | Human | Colorectum | AD | 1.06e-02 | 3.60e-01 | -0.0177 |
| 28987 | NOB1 | HTA11_6801_2000001011 | Human | Colorectum | SER | 5.65e-03 | 5.20e-01 | 0.0171 |
| 28987 | NOB1 | HTA11_10711_2000001011 | Human | Colorectum | AD | 1.64e-07 | 4.90e-01 | 0.0338 |
| 28987 | NOB1 | HTA11_7696_3000711011 | Human | Colorectum | AD | 2.16e-19 | 5.93e-01 | 0.0674 |
| 28987 | NOB1 | HTA11_6818_2000001011 | Human | Colorectum | AD | 1.47e-04 | 5.85e-01 | 0.0112 |
| 28987 | NOB1 | HTA11_7469_2000001011 | Human | Colorectum | AD | 2.01e-03 | 5.94e-01 | -0.0124 |
| 28987 | NOB1 | HTA11_6818_2000001021 | Human | Colorectum | AD | 2.16e-15 | 6.74e-01 | 0.0588 |
| 28987 | NOB1 | HTA11_99999970781_79442 | Human | Colorectum | MSS | 7.27e-09 | 4.15e-01 | 0.294 |
| 28987 | NOB1 | HTA11_99999965062_69753 | Human | Colorectum | MSI-H | 2.21e-05 | 1.06e+00 | 0.3487 |
| 28987 | NOB1 | HTA11_99999971662_82457 | Human | Colorectum | MSS | 2.89e-30 | 8.18e-01 | 0.3859 |
| Page: 1 2 3 4 5 6 7 |
| Tissue | Expression Dynamics | Abbreviation |
| Colorectum (GSE201348) | 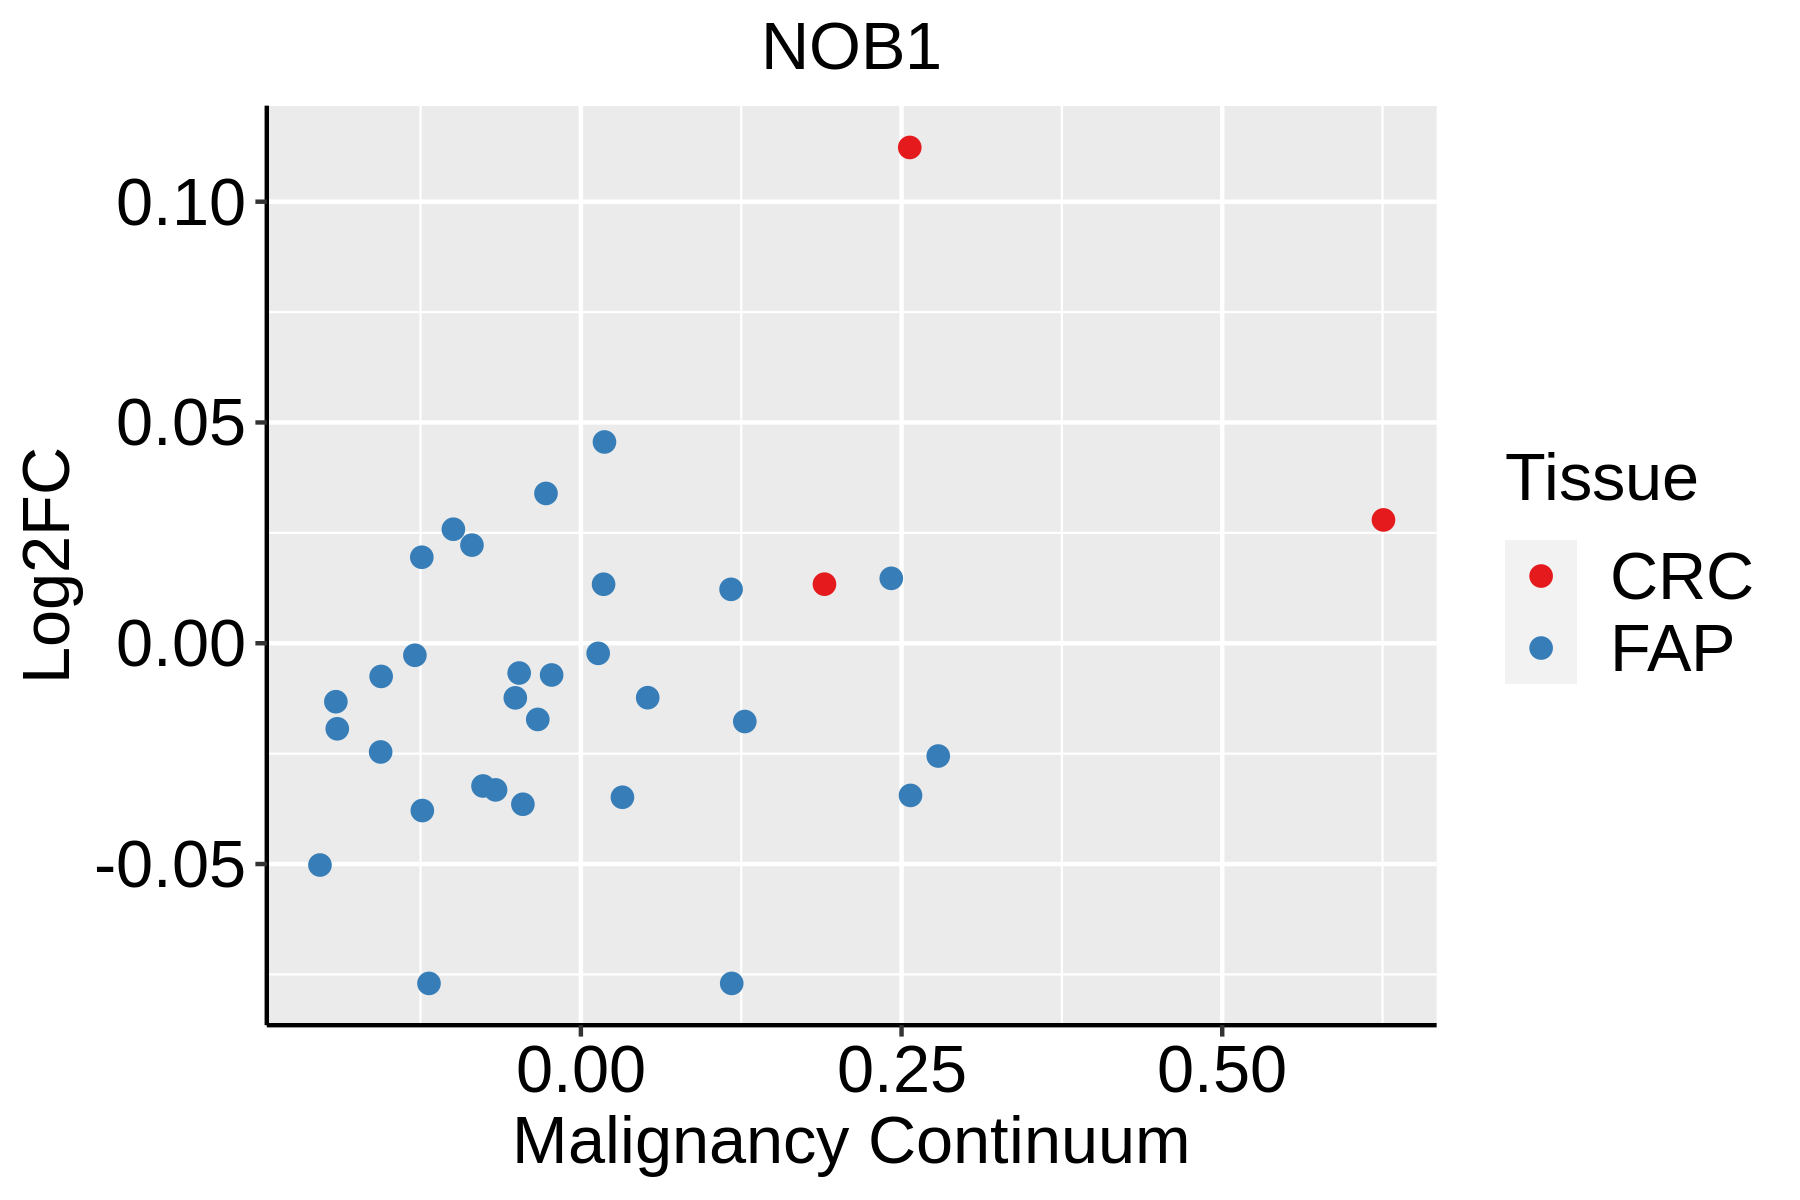 | FAP: Familial adenomatous polyposis |
| CRC: Colorectal cancer | ||
| Colorectum (HTA11) |  | AD: Adenomas |
| SER: Sessile serrated lesions | ||
| MSI-H: Microsatellite-high colorectal cancer | ||
| MSS: Microsatellite stable colorectal cancer | ||
| Esophagus |  | ESCC: Esophageal squamous cell carcinoma |
| HGIN: High-grade intraepithelial neoplasias | ||
| LGIN: Low-grade intraepithelial neoplasias | ||
| Liver |  | HCC: Hepatocellular carcinoma |
| NAFLD: Non-alcoholic fatty liver disease | ||
| Oral Cavity | 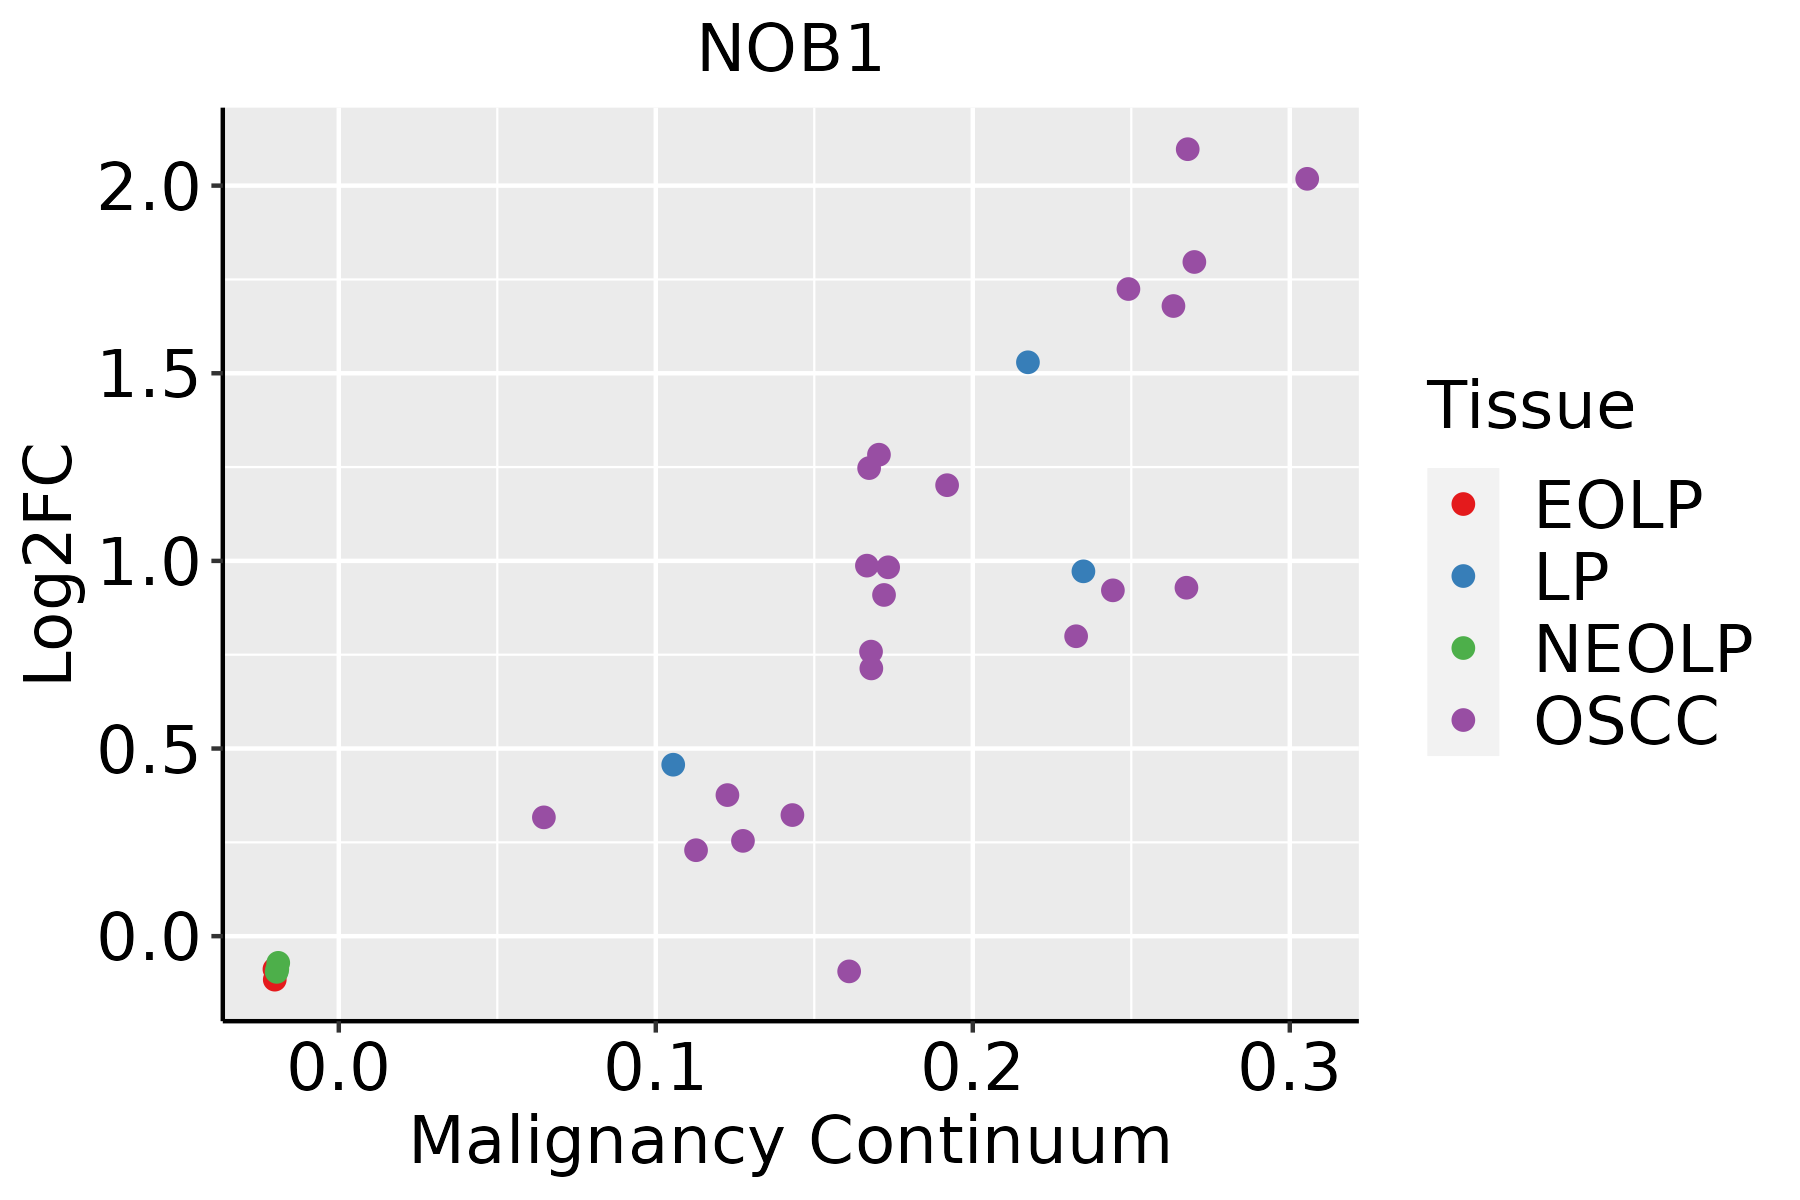 | EOLP: Erosive Oral lichen planus |
| LP: leukoplakia | ||
| NEOLP: Non-erosive oral lichen planus | ||
| OSCC: Oral squamous cell carcinoma | ||
| Skin | 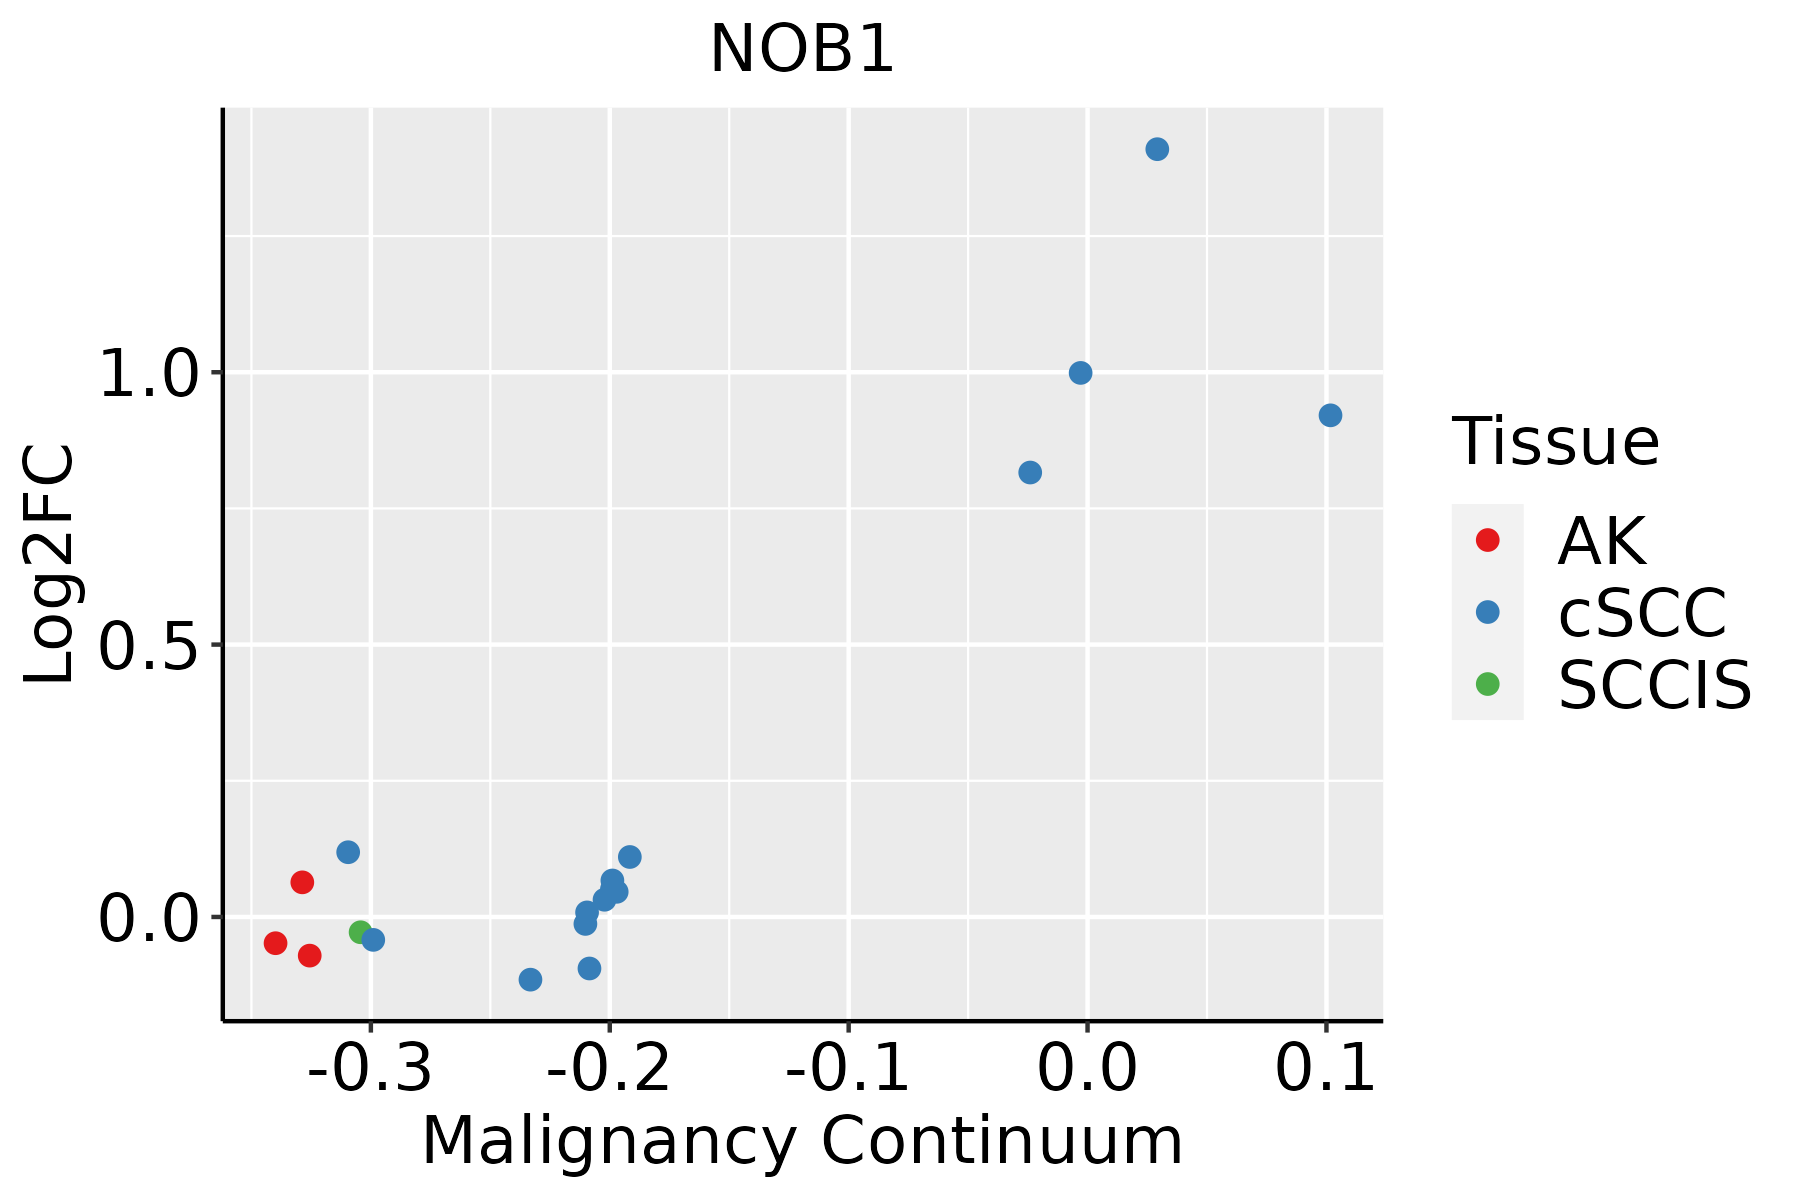 | AK: Actinic keratosis |
| cSCC: Cutaneous squamous cell carcinoma | ||
| SCCIS:squamous cell carcinoma in situ | ||
| Thyroid |  | ATC: Anaplastic thyroid cancer |
| HT: Hashimoto's thyroiditis | ||
| PTC: Papillary thyroid cancer |
| ∗log2FC in expression of this searched gene in stem-like cells from each diseased tissue sample relative to stem-like cells in normal samples in each tissue plotted against the malignancy continuum. Samples are colored based on if they are from different disease stage. |
Top |
Malignant transformation related pathway analysis |
| Find out the enriched GO biological processes and KEGG pathways involved in transition from healthy to precancer to cancer |
| Tissue | Disease Stage | Enriched GO biological Processes |
| Colorectum | AD |  |
| Colorectum | SER |  |
| Colorectum | MSS |  |
| Colorectum | MSI-H |  |
| Colorectum | FAP |  |
| ∗Top 15 enriched GO BP terms are showed in the bar plot of each disease state in each tissue. Each row represents a significant GO biological process which is colored according to the -log10(p.adjust). |
| Page: 1 2 3 4 5 6 7 8 9 |
| GO ID | Tissue | Disease Stage | Description | Gene Ratio | Bg Ratio | pvalue | p.adjust | Count |
| GO:0022613 | Colorectum | AD | ribonucleoprotein complex biogenesis | 151/3918 | 463/18723 | 1.96e-09 | 1.39e-07 | 151 |
| GO:0042254 | Colorectum | AD | ribosome biogenesis | 84/3918 | 299/18723 | 1.82e-03 | 1.50e-02 | 84 |
| GO:0042274 | Colorectum | AD | ribosomal small subunit biogenesis | 25/3918 | 73/18723 | 5.69e-03 | 3.64e-02 | 25 |
| GO:00226131 | Colorectum | SER | ribonucleoprotein complex biogenesis | 112/2897 | 463/18723 | 5.01e-07 | 2.48e-05 | 112 |
| GO:00422741 | Colorectum | SER | ribosomal small subunit biogenesis | 23/2897 | 73/18723 | 4.50e-04 | 6.57e-03 | 23 |
| GO:00422541 | Colorectum | SER | ribosome biogenesis | 66/2897 | 299/18723 | 1.48e-03 | 1.60e-02 | 66 |
| GO:00226132 | Colorectum | MSS | ribonucleoprotein complex biogenesis | 144/3467 | 463/18723 | 2.76e-11 | 3.67e-09 | 144 |
| GO:00422542 | Colorectum | MSS | ribosome biogenesis | 79/3467 | 299/18723 | 4.32e-04 | 5.23e-03 | 79 |
| GO:0006364 | Colorectum | MSS | rRNA processing | 58/3467 | 225/18723 | 4.17e-03 | 3.03e-02 | 58 |
| GO:0016072 | Colorectum | MSS | rRNA metabolic process | 60/3467 | 236/18723 | 5.01e-03 | 3.46e-02 | 60 |
| GO:00226133 | Colorectum | MSI-H | ribonucleoprotein complex biogenesis | 95/1319 | 463/18723 | 1.04e-21 | 8.32e-19 | 95 |
| GO:00422543 | Colorectum | MSI-H | ribosome biogenesis | 54/1319 | 299/18723 | 1.27e-10 | 2.07e-08 | 54 |
| GO:00422742 | Colorectum | MSI-H | ribosomal small subunit biogenesis | 20/1319 | 73/18723 | 9.17e-08 | 9.10e-06 | 20 |
| GO:00063641 | Colorectum | MSI-H | rRNA processing | 39/1319 | 225/18723 | 1.45e-07 | 1.32e-05 | 39 |
| GO:00160721 | Colorectum | MSI-H | rRNA metabolic process | 39/1319 | 236/18723 | 5.20e-07 | 3.91e-05 | 39 |
| GO:0034470 | Colorectum | MSI-H | ncRNA processing | 48/1319 | 395/18723 | 1.54e-04 | 4.47e-03 | 48 |
| GO:0034660 | Colorectum | MSI-H | ncRNA metabolic process | 53/1319 | 485/18723 | 9.66e-04 | 1.68e-02 | 53 |
| GO:002261327 | Esophagus | HGIN | ribonucleoprotein complex biogenesis | 158/2587 | 463/18723 | 2.61e-29 | 5.23e-26 | 158 |
| GO:004225426 | Esophagus | HGIN | ribosome biogenesis | 101/2587 | 299/18723 | 8.74e-19 | 4.03e-16 | 101 |
| GO:001607219 | Esophagus | HGIN | rRNA metabolic process | 72/2587 | 236/18723 | 2.26e-11 | 2.56e-09 | 72 |
| Page: 1 2 3 4 5 6 |
| Pathway ID | Tissue | Disease Stage | Description | Gene Ratio | Bg Ratio | pvalue | p.adjust | qvalue | Count |
| Page: 1 |
Top |
Cell-cell communication analysis |
| Identification of potential cell-cell interactions between two cell types and their ligand-receptor pairs for different disease states |
| Ligand | Receptor | LRpair | Pathway | Tissue | Disease Stage |
| Page: 1 |
Top |
Single-cell gene regulatory network inference analysis |
| Find out the significant the regulons (TFs) and the target genes of each regulon across cell types for different disease states |
| TF | Cell Type | Tissue | Disease Stage | Target Gene | RSS | Regulon Activity |
| ∗The dot plots of a searched regulon are shown for all cell subpopulations in each disease state of each tissue based on the regulon specific score inferred using pySCENIC and by calculating the average expression. |
| Page: 1 |
Top |
Somatic mutation of malignant transformation related genes |
| Annotation of somatic variants for genes involved in malignant transformation |
| Hugo Symbol | Variant Class | Variant Classification | dbSNP RS | HGVSc | HGVSp | HGVSp Short | SWISSPROT | BIOTYPE | SIFT | PolyPhen | Tumor Sample Barcode | Tissue | Histology | Sex | Age | Stage | Therapy Types | Drugs | Outcome |
| NOB1 | SNV | Missense_Mutation | c.1080C>A | p.Asn360Lys | p.N360K | Q9ULX3 | protein_coding | deleterious(0) | benign(0.056) | TCGA-D8-A1XK-01 | Breast | breast invasive carcinoma | Female | <65 | I/II | Chemotherapy | doxorubicine+cyclophosphamide | SD | |
| NOB1 | insertion | Nonsense_Mutation | novel | c.141_142insTGAGTTG | p.Val48Ter | p.V48* | Q9ULX3 | protein_coding | TCGA-A2-A0EO-01 | Breast | breast invasive carcinoma | Female | <65 | I/II | Hormone Therapy | tamoxiphen | SD | ||
| NOB1 | insertion | Nonsense_Mutation | novel | c.139_140insTTTCTTGACCACTGACCTCTCATTGCTTTTCTGACT | p.Ala47delinsValSerTerProLeuThrSerHisCysPheSerAspSer | p.A47delinsVS*PLTSHCFSDS | Q9ULX3 | protein_coding | TCGA-A2-A0EO-01 | Breast | breast invasive carcinoma | Female | <65 | I/II | Hormone Therapy | tamoxiphen | SD | ||
| NOB1 | SNV | Missense_Mutation | rs200973241 | c.1003N>A | p.Ala335Thr | p.A335T | Q9ULX3 | protein_coding | deleterious(0.01) | benign(0.003) | TCGA-AA-3811-01 | Colorectum | colon adenocarcinoma | Female | >=65 | III/IV | Unknown | Unknown | PD |
| NOB1 | SNV | Missense_Mutation | c.449A>T | p.Glu150Val | p.E150V | Q9ULX3 | protein_coding | tolerated(0.06) | benign(0.007) | TCGA-CK-4951-01 | Colorectum | colon adenocarcinoma | Female | >=65 | I/II | Unknown | Unknown | PD | |
| NOB1 | SNV | Missense_Mutation | rs145274258 | c.1141C>T | p.Arg381Cys | p.R381C | Q9ULX3 | protein_coding | deleterious(0) | probably_damaging(0.964) | TCGA-G4-6628-01 | Colorectum | colon adenocarcinoma | Male | >=65 | I/II | Unknown | Unknown | SD |
| NOB1 | insertion | In_Frame_Ins | novel | c.991_992insTCA | p.Gly331delinsValArg | p.G331delinsVR | Q9ULX3 | protein_coding | TCGA-AM-5820-01 | Colorectum | colon adenocarcinoma | Female | <65 | I/II | Unknown | Unknown | SD | ||
| NOB1 | insertion | Nonsense_Mutation | novel | c.1001dupA | p.Tyr334Ter | p.Y334* | Q9ULX3 | protein_coding | TCGA-AF-2690-01 | Colorectum | rectum adenocarcinoma | Female | >=65 | III/IV | Unknown | Unknown | SD | ||
| NOB1 | SNV | Missense_Mutation | rs768728190 | c.1192N>T | p.Arg398Cys | p.R398C | Q9ULX3 | protein_coding | deleterious(0) | probably_damaging(0.964) | TCGA-AJ-A3OK-01 | Endometrium | uterine corpus endometrioid carcinoma | Female | >=65 | I/II | Chemotherapy | carboplatin | CR |
| NOB1 | SNV | Missense_Mutation | c.516G>T | p.Gln172His | p.Q172H | Q9ULX3 | protein_coding | tolerated(0.1) | possibly_damaging(0.864) | TCGA-AP-A051-01 | Endometrium | uterine corpus endometrioid carcinoma | Female | >=65 | I/II | Unknown | Unknown | SD |
| Page: 1 2 3 |
Top |
Related drugs of malignant transformation related genes |
| Identification of chemicals and drugs interact with genes involved in malignant transfromation |
| (DGIdb 4.0) |
| Entrez ID | Symbol | Category | Interaction Types | Drug Claim Name | Drug Name | PMIDs |
| Page: 1 |

Copyright 2023-Present -The University of Texas Health Science Center at Houston |