
|
|||||
|
 | |
| |
| |
| |
| |
| |
|
Gene: NNT |
Gene summary for NNT |
| Gene information | Species | Human | Gene symbol | NNT | Gene ID | 23530 |
| Gene name | nicotinamide nucleotide transhydrogenase | |
| Gene Alias | GCCD4 | |
| Cytomap | 5p12 | |
| Gene Type | protein-coding | GO ID | GO:0001932 | UniProtAcc | E9PCX7 |
Top |
Malignant transformation analysis |
| Identification of the aberrant gene expression in precancerous and cancerous lesions by comparing the gene expression of stem-like cells in diseased tissues with normal stem cells |
| Entrez ID | Symbol | Replicates | Species | Organ | Tissue | Adj P-value | Log2FC | Malignancy |
| 23530 | NNT | LZE4T | Human | Esophagus | ESCC | 5.76e-09 | 2.07e-01 | 0.0811 |
| 23530 | NNT | LZE7T | Human | Esophagus | ESCC | 4.35e-05 | 3.23e-01 | 0.0667 |
| 23530 | NNT | LZE8T | Human | Esophagus | ESCC | 1.33e-04 | 2.05e-01 | 0.067 |
| 23530 | NNT | LZE22T | Human | Esophagus | ESCC | 2.28e-02 | 2.16e-01 | 0.068 |
| 23530 | NNT | LZE24T | Human | Esophagus | ESCC | 2.98e-10 | 1.80e-01 | 0.0596 |
| 23530 | NNT | LZE6T | Human | Esophagus | ESCC | 3.07e-04 | 1.59e-01 | 0.0845 |
| 23530 | NNT | P2T-E | Human | Esophagus | ESCC | 5.99e-17 | 1.72e-01 | 0.1177 |
| 23530 | NNT | P4T-E | Human | Esophagus | ESCC | 8.17e-11 | 1.94e-01 | 0.1323 |
| 23530 | NNT | P5T-E | Human | Esophagus | ESCC | 2.36e-05 | 5.12e-02 | 0.1327 |
| 23530 | NNT | P8T-E | Human | Esophagus | ESCC | 3.45e-30 | 5.33e-01 | 0.0889 |
| 23530 | NNT | P9T-E | Human | Esophagus | ESCC | 4.94e-05 | 1.10e-01 | 0.1131 |
| 23530 | NNT | P10T-E | Human | Esophagus | ESCC | 2.32e-30 | 5.56e-01 | 0.116 |
| 23530 | NNT | P11T-E | Human | Esophagus | ESCC | 8.34e-04 | 2.44e-01 | 0.1426 |
| 23530 | NNT | P12T-E | Human | Esophagus | ESCC | 6.59e-17 | 2.70e-01 | 0.1122 |
| 23530 | NNT | P15T-E | Human | Esophagus | ESCC | 2.18e-07 | 1.98e-01 | 0.1149 |
| 23530 | NNT | P16T-E | Human | Esophagus | ESCC | 7.42e-15 | 2.55e-01 | 0.1153 |
| 23530 | NNT | P17T-E | Human | Esophagus | ESCC | 6.37e-03 | 2.52e-01 | 0.1278 |
| 23530 | NNT | P19T-E | Human | Esophagus | ESCC | 6.13e-03 | 2.53e-01 | 0.1662 |
| 23530 | NNT | P20T-E | Human | Esophagus | ESCC | 1.93e-16 | 2.55e-01 | 0.1124 |
| 23530 | NNT | P21T-E | Human | Esophagus | ESCC | 1.69e-14 | 2.92e-01 | 0.1617 |
| Page: 1 2 3 4 5 |
| Tissue | Expression Dynamics | Abbreviation |
| Esophagus | 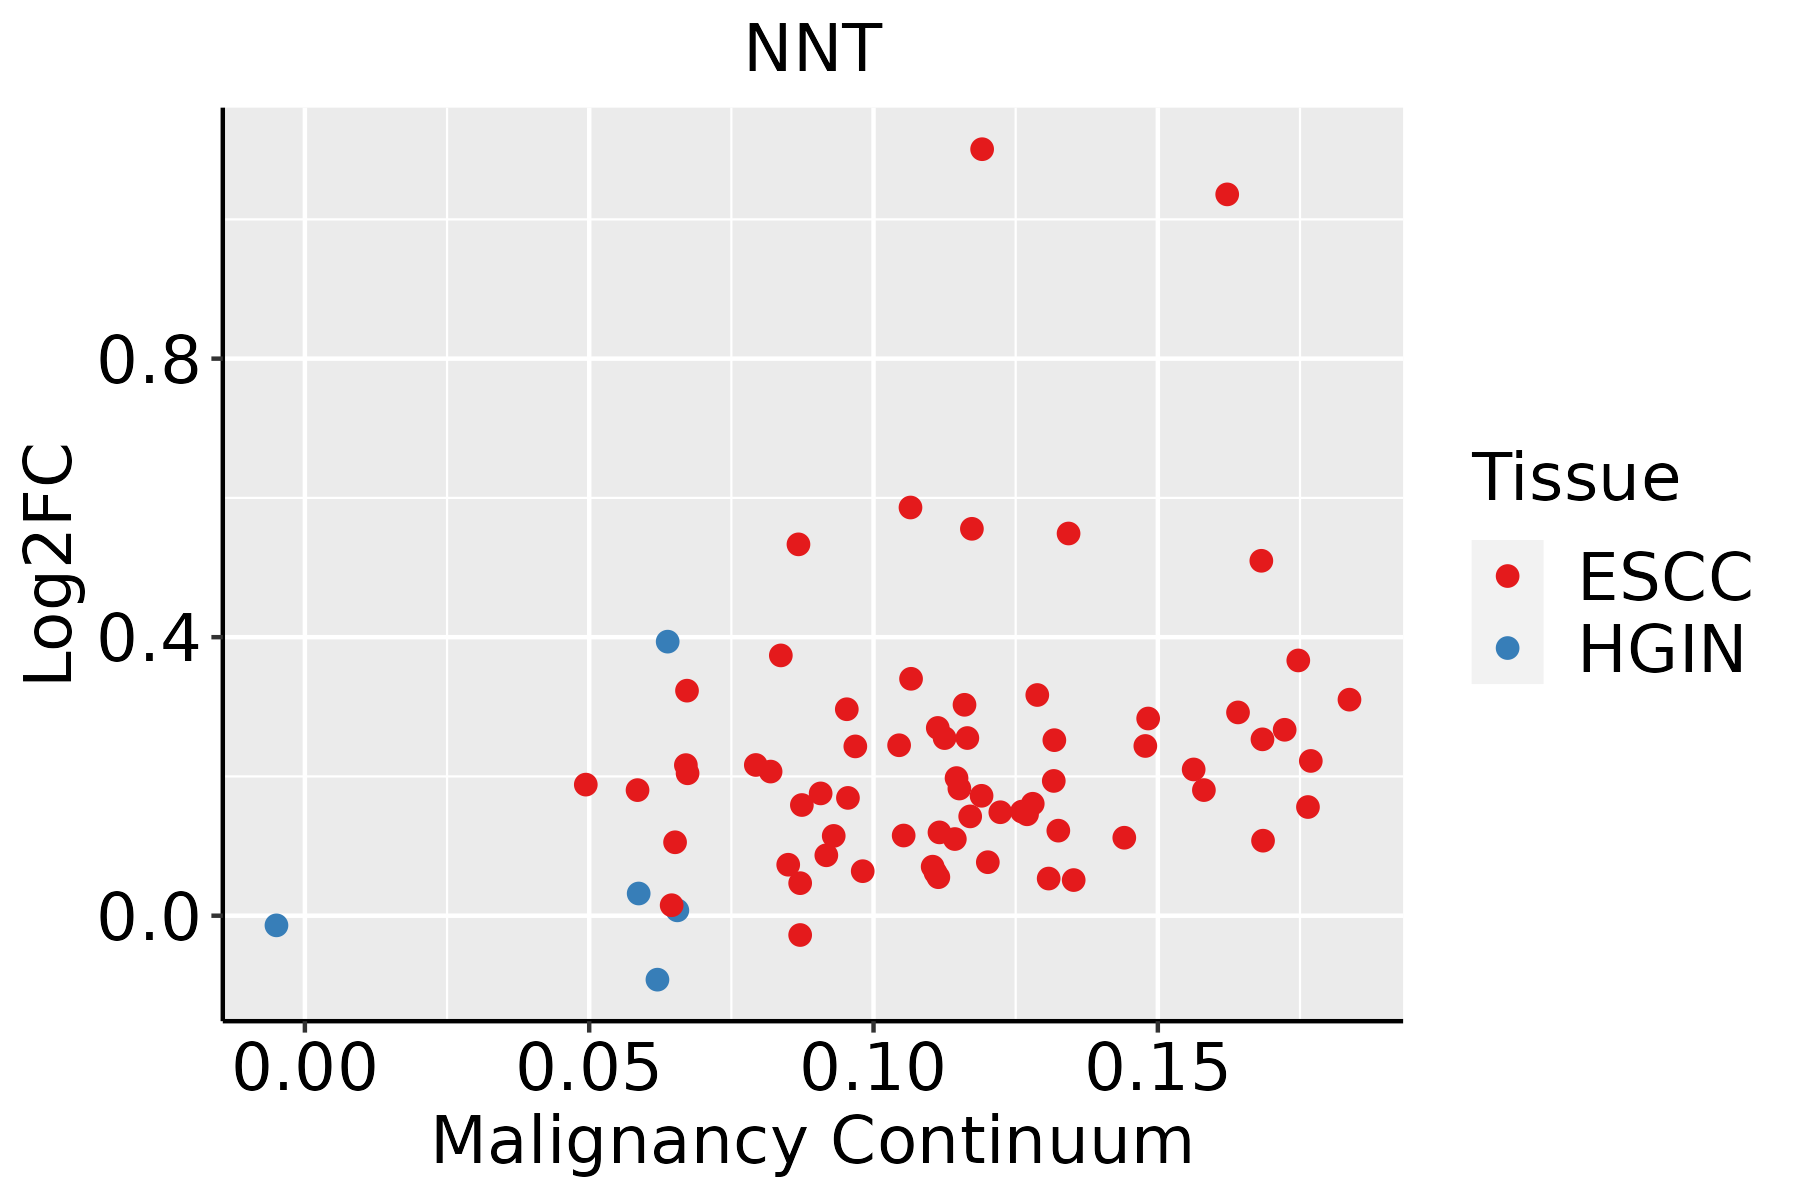 | ESCC: Esophageal squamous cell carcinoma |
| HGIN: High-grade intraepithelial neoplasias | ||
| LGIN: Low-grade intraepithelial neoplasias | ||
| Liver | 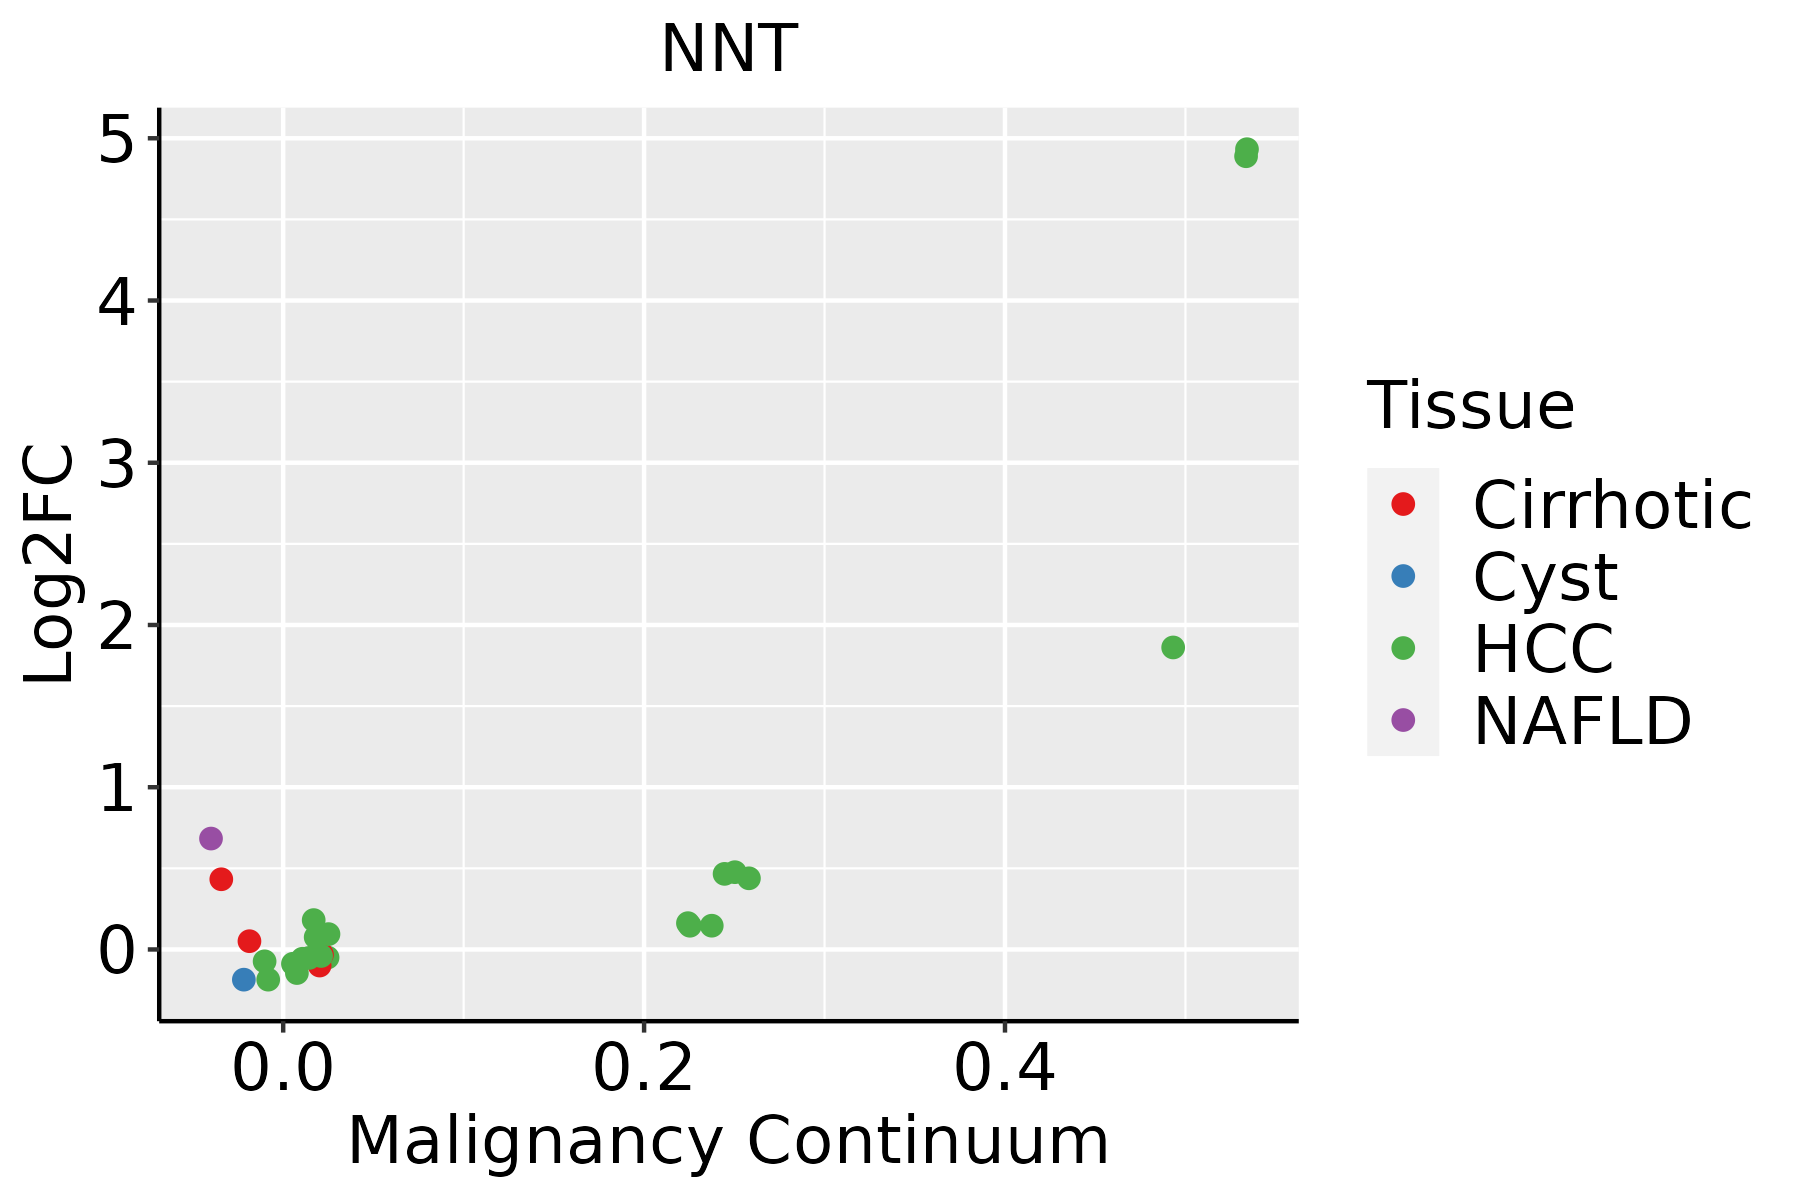 | HCC: Hepatocellular carcinoma |
| NAFLD: Non-alcoholic fatty liver disease | ||
| Oral Cavity | 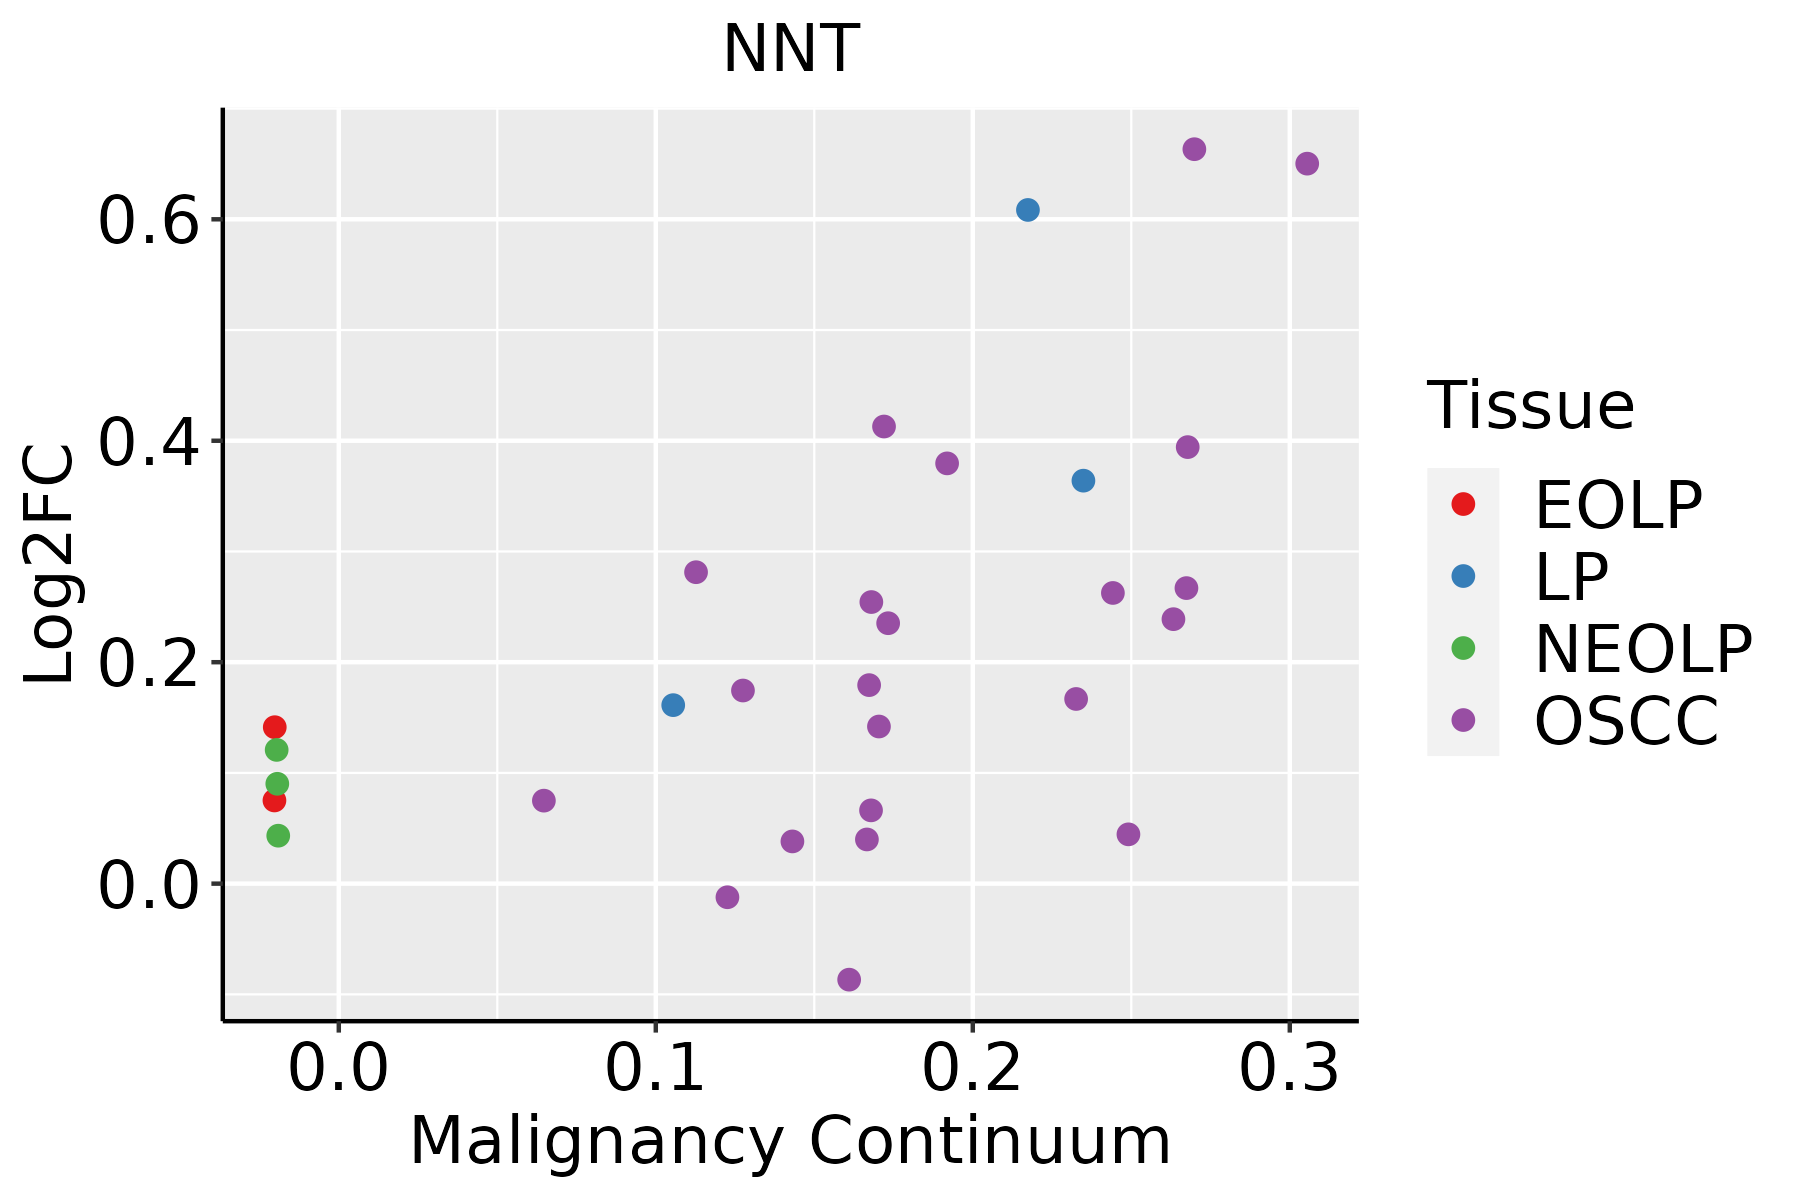 | EOLP: Erosive Oral lichen planus |
| LP: leukoplakia | ||
| NEOLP: Non-erosive oral lichen planus | ||
| OSCC: Oral squamous cell carcinoma | ||
| Thyroid |  | ATC: Anaplastic thyroid cancer |
| HT: Hashimoto's thyroiditis | ||
| PTC: Papillary thyroid cancer |
| ∗log2FC in expression of this searched gene in stem-like cells from each diseased tissue sample relative to stem-like cells in normal samples in each tissue plotted against the malignancy continuum. Samples are colored based on if they are from different disease stage. |
Top |
Malignant transformation related pathway analysis |
| Find out the enriched GO biological processes and KEGG pathways involved in transition from healthy to precancer to cancer |
| Tissue | Disease Stage | Enriched GO biological Processes |
| Colorectum | AD |  |
| Colorectum | SER |  |
| Colorectum | MSS |  |
| Colorectum | MSI-H |  |
| Colorectum | FAP |  |
| ∗Top 15 enriched GO BP terms are showed in the bar plot of each disease state in each tissue. Each row represents a significant GO biological process which is colored according to the -log10(p.adjust). |
| Page: 1 2 3 4 5 6 7 8 9 |
| GO ID | Tissue | Disease Stage | Description | Gene Ratio | Bg Ratio | pvalue | p.adjust | Count |
| GO:00426923 | Breast | IDC | muscle cell differentiation | 44/1434 | 384/18723 | 4.77e-03 | 3.66e-02 | 44 |
| GO:00030125 | Breast | IDC | muscle system process | 50/1434 | 452/18723 | 5.52e-03 | 4.05e-02 | 50 |
| GO:00511463 | Breast | IDC | striated muscle cell differentiation | 34/1434 | 283/18723 | 6.00e-03 | 4.31e-02 | 34 |
| GO:000301212 | Breast | DCIS | muscle system process | 50/1390 | 452/18723 | 3.02e-03 | 2.57e-02 | 50 |
| GO:004269211 | Breast | DCIS | muscle cell differentiation | 43/1390 | 384/18723 | 4.56e-03 | 3.49e-02 | 43 |
| GO:00310328 | Breast | DCIS | actomyosin structure organization | 25/1390 | 196/18723 | 5.59e-03 | 4.06e-02 | 25 |
| GO:005114611 | Breast | DCIS | striated muscle cell differentiation | 33/1390 | 283/18723 | 6.63e-03 | 4.62e-02 | 33 |
| GO:00310329 | Cervix | CC | actomyosin structure organization | 43/2311 | 196/18723 | 1.11e-04 | 1.40e-03 | 43 |
| GO:00426924 | Cervix | CC | muscle cell differentiation | 69/2311 | 384/18723 | 8.12e-04 | 7.09e-03 | 69 |
| GO:00511464 | Cervix | CC | striated muscle cell differentiation | 50/2311 | 283/18723 | 5.53e-03 | 3.19e-02 | 50 |
| GO:00902578 | Cervix | CC | regulation of muscle system process | 45/2311 | 252/18723 | 6.73e-03 | 3.70e-02 | 45 |
| GO:00435024 | Cervix | CC | regulation of muscle adaptation | 21/2311 | 98/18723 | 7.71e-03 | 4.09e-02 | 21 |
| GO:005114612 | Cervix | HSIL_HPV | striated muscle cell differentiation | 22/737 | 283/18723 | 1.94e-03 | 2.04e-02 | 22 |
| GO:0006091110 | Esophagus | ESCC | generation of precursor metabolites and energy | 331/8552 | 490/18723 | 3.86e-23 | 8.45e-21 | 331 |
| GO:0009896111 | Esophagus | ESCC | positive regulation of catabolic process | 332/8552 | 492/18723 | 4.36e-23 | 9.22e-21 | 332 |
| GO:0031331111 | Esophagus | ESCC | positive regulation of cellular catabolic process | 292/8552 | 427/18723 | 8.67e-22 | 1.53e-19 | 292 |
| GO:0045333110 | Esophagus | ESCC | cellular respiration | 173/8552 | 230/18723 | 4.53e-20 | 5.99e-18 | 173 |
| GO:0009060110 | Esophagus | ESCC | aerobic respiration | 145/8552 | 189/18723 | 2.16e-18 | 2.21e-16 | 145 |
| GO:0015980110 | Esophagus | ESCC | energy derivation by oxidation of organic compounds | 220/8552 | 318/18723 | 1.20e-17 | 1.09e-15 | 220 |
| GO:0010563111 | Esophagus | ESCC | negative regulation of phosphorus metabolic process | 274/8552 | 442/18723 | 2.32e-12 | 9.41e-11 | 274 |
| Page: 1 2 3 4 5 6 7 8 9 10 11 |
| Pathway ID | Tissue | Disease Stage | Description | Gene Ratio | Bg Ratio | pvalue | p.adjust | qvalue | Count |
| Page: 1 |
Top |
Cell-cell communication analysis |
| Identification of potential cell-cell interactions between two cell types and their ligand-receptor pairs for different disease states |
| Ligand | Receptor | LRpair | Pathway | Tissue | Disease Stage |
| Page: 1 |
Top |
Single-cell gene regulatory network inference analysis |
| Find out the significant the regulons (TFs) and the target genes of each regulon across cell types for different disease states |
| TF | Cell Type | Tissue | Disease Stage | Target Gene | RSS | Regulon Activity |
| NNT | MYOFIB | Stomach | CAG with IM | CENPK,NMNAT3,ACTG2, etc. | 1.90e-01 |  |
| NNT | MYOFIB | Stomach | SIM | CENPK,NMNAT3,ACTG2, etc. | 1.50e-01 |  |
| ∗The dot plots of a searched regulon are shown for all cell subpopulations in each disease state of each tissue based on the regulon specific score inferred using pySCENIC and by calculating the average expression. |
| Page: 1 |
Top |
Somatic mutation of malignant transformation related genes |
| Annotation of somatic variants for genes involved in malignant transformation |
| Hugo Symbol | Variant Class | Variant Classification | dbSNP RS | HGVSc | HGVSp | HGVSp Short | SWISSPROT | BIOTYPE | SIFT | PolyPhen | Tumor Sample Barcode | Tissue | Histology | Sex | Age | Stage | Therapy Types | Drugs | Outcome |
| NNT | SNV | Missense_Mutation | c.3171N>G | p.Phe1057Leu | p.F1057L | Q13423 | protein_coding | deleterious(0.02) | probably_damaging(1) | TCGA-A2-A04X-01 | Breast | breast invasive carcinoma | Female | <65 | I/II | Chemotherapy | adriamycin | SD | |
| NNT | SNV | Missense_Mutation | novel | c.1197N>G | p.Ile399Met | p.I399M | Q13423 | protein_coding | tolerated(1) | benign(0.005) | TCGA-AC-A23H-01 | Breast | breast invasive carcinoma | Female | >=65 | I/II | Unknown | Unknown | PD |
| NNT | SNV | Missense_Mutation | c.3111N>C | p.Gln1037His | p.Q1037H | Q13423 | protein_coding | tolerated(0.11) | benign(0.074) | TCGA-B6-A0IM-01 | Breast | breast invasive carcinoma | Female | >=65 | I/II | Unknown | Unknown | SD | |
| NNT | SNV | Missense_Mutation | c.2028G>T | p.Met676Ile | p.M676I | Q13423 | protein_coding | tolerated(0.28) | possibly_damaging(0.761) | TCGA-BH-A0C0-01 | Breast | breast invasive carcinoma | Female | <65 | I/II | Chemotherapy | carboplatin | SD | |
| NNT | SNV | Missense_Mutation | c.1243N>C | p.Asp415His | p.D415H | Q13423 | protein_coding | deleterious(0.01) | possibly_damaging(0.56) | TCGA-BH-A18J-01 | Breast | breast invasive carcinoma | Female | <65 | III/IV | Unknown | Unknown | PD | |
| NNT | insertion | Nonsense_Mutation | novel | c.1552_1553insACAACCCTATGCAACTTCTCTAATTTTTAACTGGAA | p.Gly518delinsAspAsnProMetGlnLeuLeuTerPheLeuThrGlyArg | p.G518delinsDNPMQLL*FLTGR | Q13423 | protein_coding | TCGA-A2-A0CP-01 | Breast | breast invasive carcinoma | Female | <65 | I/II | Chemotherapy | cytoxan | SD | ||
| NNT | insertion | Nonsense_Mutation | novel | c.3216_3217insGATTGTTCCAGCCCCTAATTTGCTTATAC | p.Cys1073AspfsTer6 | p.C1073Dfs*6 | Q13423 | protein_coding | TCGA-A2-A0CP-01 | Breast | breast invasive carcinoma | Female | <65 | I/II | Chemotherapy | cytoxan | SD | ||
| NNT | deletion | Frame_Shift_Del | c.639delN | p.Phe215LeufsTer17 | p.F215Lfs*17 | Q13423 | protein_coding | TCGA-A8-A09Z-01 | Breast | breast invasive carcinoma | Female | >=65 | I/II | Unknown | Unknown | SD | |||
| NNT | deletion | Frame_Shift_Del | novel | c.431delN | p.Leu145Ter | p.L145* | Q13423 | protein_coding | TCGA-D8-A27V-01 | Breast | breast invasive carcinoma | Female | <65 | I/II | Hormone Therapy | tamoxiphen | SD | ||
| NNT | deletion | Frame_Shift_Del | novel | c.1304delN | p.Phe436SerfsTer15 | p.F436Sfs*15 | Q13423 | protein_coding | TCGA-EW-A2FV-01 | Breast | breast invasive carcinoma | Female | <65 | III/IV | Chemotherapy | docetaxel | SD |
| Page: 1 2 3 4 5 6 7 8 9 10 11 |
Top |
Related drugs of malignant transformation related genes |
| Identification of chemicals and drugs interact with genes involved in malignant transfromation |
| (DGIdb 4.0) |
| Entrez ID | Symbol | Category | Interaction Types | Drug Claim Name | Drug Name | PMIDs |
| Page: 1 |

Copyright 2023-Present -The University of Texas Health Science Center at Houston |