
|
|||||
|
 | |
| |
| |
| |
| |
| |
|
Gene: NMU |
Gene summary for NMU |
| Gene information | Species | Human | Gene symbol | NMU | Gene ID | 10874 |
| Gene name | neuromedin U | |
| Gene Alias | NMU | |
| Cytomap | 4q12 | |
| Gene Type | protein-coding | GO ID | GO:0001659 | UniProtAcc | A0A0B4J202 |
Top |
Malignant transformation analysis |
| Identification of the aberrant gene expression in precancerous and cancerous lesions by comparing the gene expression of stem-like cells in diseased tissues with normal stem cells |
| Entrez ID | Symbol | Replicates | Species | Organ | Tissue | Adj P-value | Log2FC | Malignancy |
| 10874 | NMU | LZE20T | Human | Esophagus | ESCC | 2.00e-05 | 3.25e-01 | 0.0662 |
| 10874 | NMU | LZE6T | Human | Esophagus | ESCC | 3.50e-02 | 2.09e-01 | 0.0845 |
| 10874 | NMU | P1T-E | Human | Esophagus | ESCC | 1.15e-02 | 3.21e-01 | 0.0875 |
| 10874 | NMU | P2T-E | Human | Esophagus | ESCC | 1.48e-15 | 8.40e-01 | 0.1177 |
| 10874 | NMU | P4T-E | Human | Esophagus | ESCC | 7.22e-21 | 9.04e-01 | 0.1323 |
| 10874 | NMU | P5T-E | Human | Esophagus | ESCC | 2.04e-54 | 1.17e+00 | 0.1327 |
| 10874 | NMU | P8T-E | Human | Esophagus | ESCC | 2.18e-03 | 3.29e-01 | 0.0889 |
| 10874 | NMU | P10T-E | Human | Esophagus | ESCC | 4.66e-06 | 3.71e-01 | 0.116 |
| 10874 | NMU | P16T-E | Human | Esophagus | ESCC | 8.08e-03 | 2.45e-01 | 0.1153 |
| 10874 | NMU | P20T-E | Human | Esophagus | ESCC | 7.55e-11 | 4.06e-01 | 0.1124 |
| 10874 | NMU | P21T-E | Human | Esophagus | ESCC | 2.19e-13 | 6.77e-01 | 0.1617 |
| 10874 | NMU | P22T-E | Human | Esophagus | ESCC | 7.01e-05 | 3.63e-01 | 0.1236 |
| 10874 | NMU | P23T-E | Human | Esophagus | ESCC | 3.30e-08 | 3.36e-01 | 0.108 |
| 10874 | NMU | P24T-E | Human | Esophagus | ESCC | 6.59e-04 | 2.85e-01 | 0.1287 |
| 10874 | NMU | P27T-E | Human | Esophagus | ESCC | 1.31e-08 | 4.00e-01 | 0.1055 |
| 10874 | NMU | P28T-E | Human | Esophagus | ESCC | 7.82e-13 | 4.41e-01 | 0.1149 |
| 10874 | NMU | P32T-E | Human | Esophagus | ESCC | 9.56e-07 | 3.45e-01 | 0.1666 |
| 10874 | NMU | P37T-E | Human | Esophagus | ESCC | 1.12e-28 | 1.14e+00 | 0.1371 |
| 10874 | NMU | P38T-E | Human | Esophagus | ESCC | 2.87e-06 | 5.41e-01 | 0.127 |
| 10874 | NMU | P39T-E | Human | Esophagus | ESCC | 1.87e-11 | 6.05e-01 | 0.0894 |
| Page: 1 2 3 |
| Tissue | Expression Dynamics | Abbreviation |
| Esophagus | 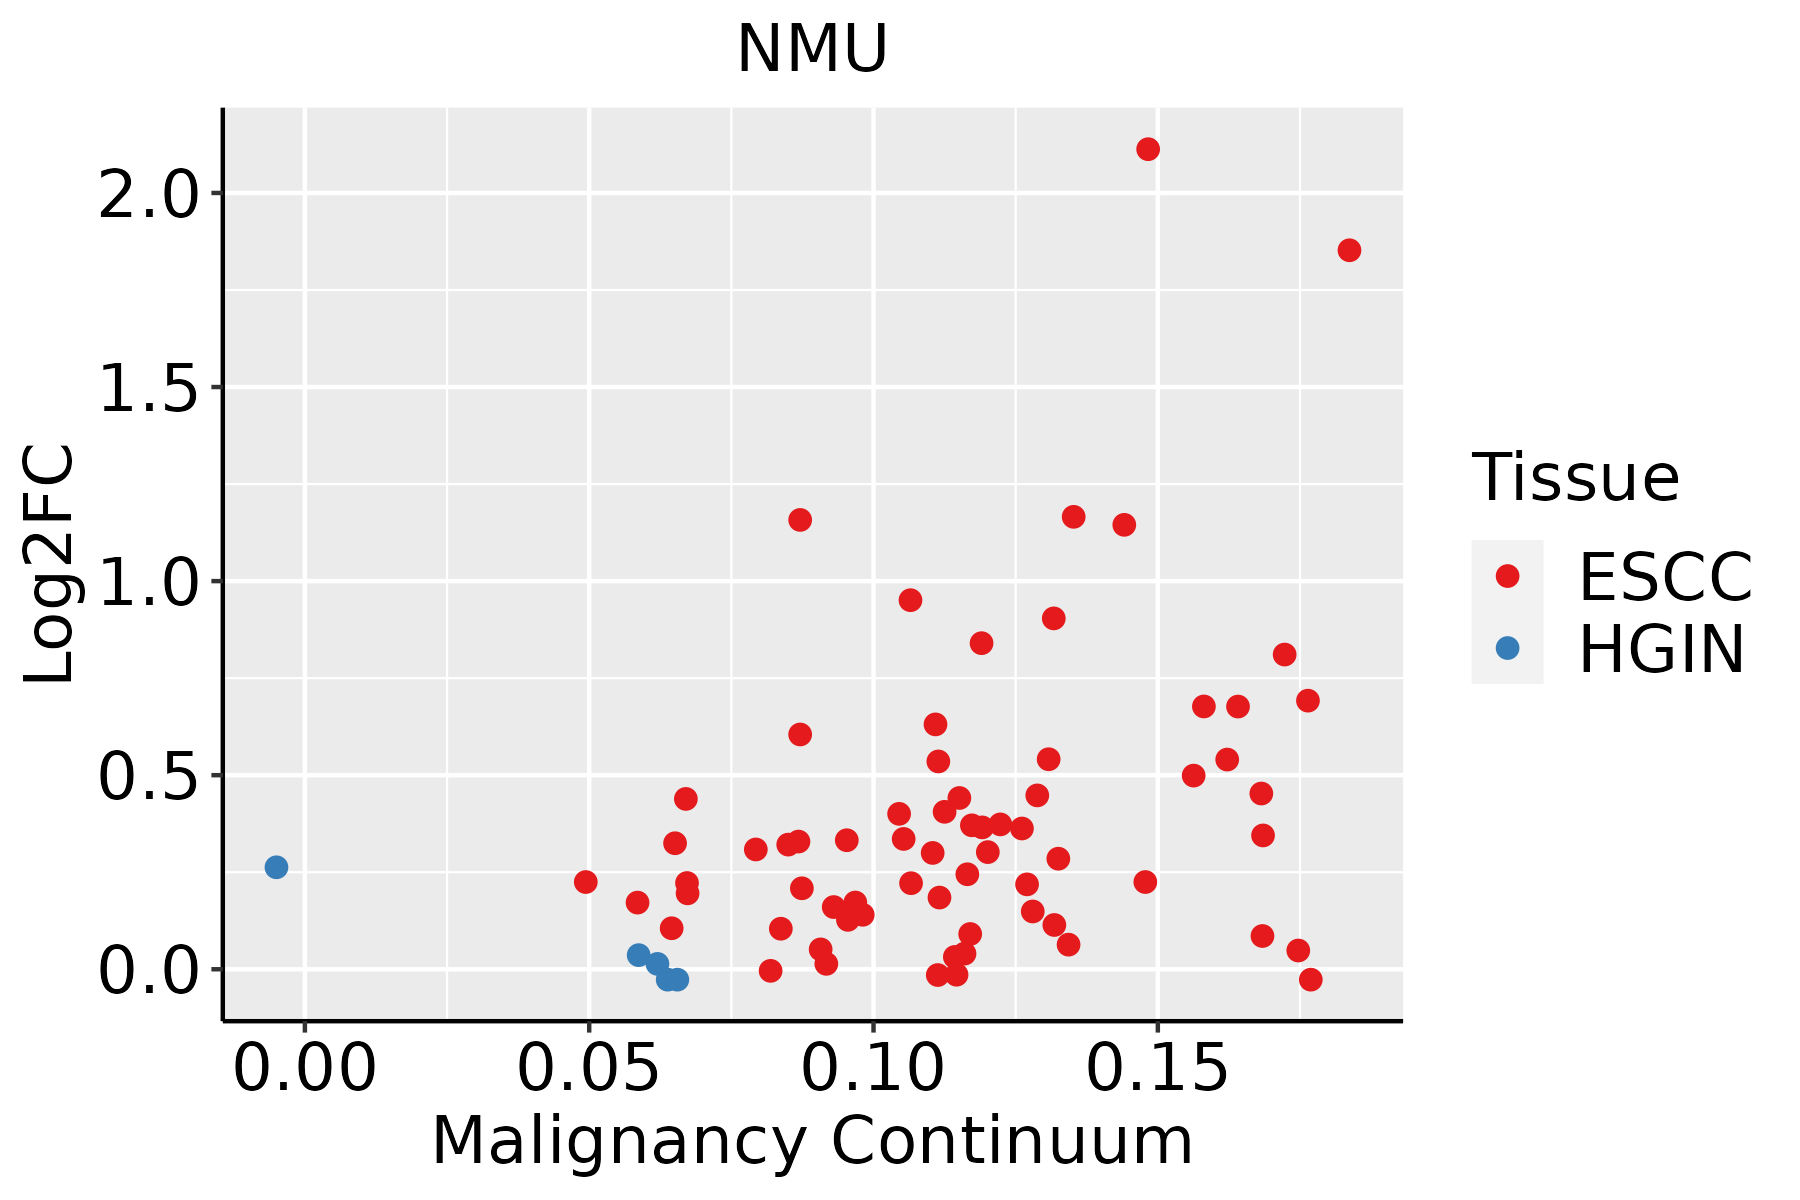 | ESCC: Esophageal squamous cell carcinoma |
| HGIN: High-grade intraepithelial neoplasias | ||
| LGIN: Low-grade intraepithelial neoplasias | ||
| Oral Cavity | 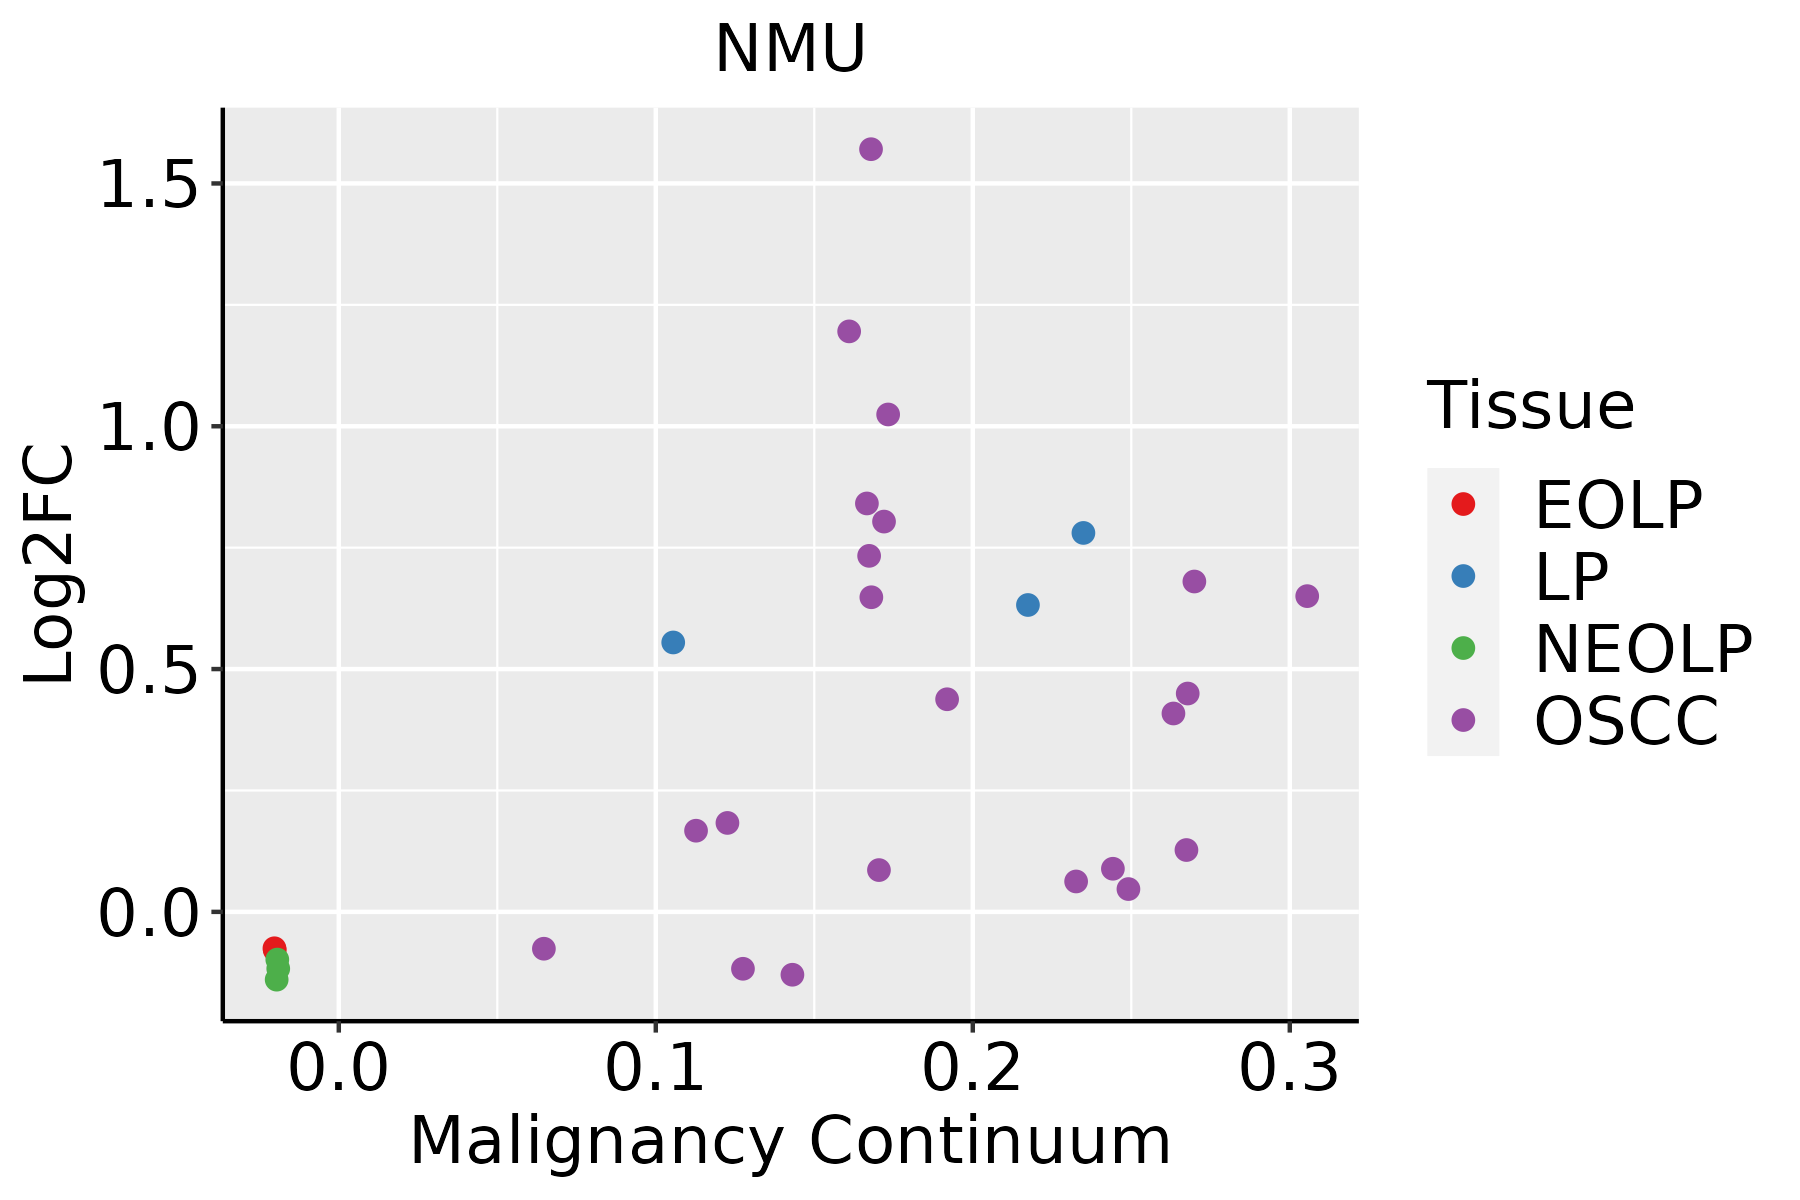 | EOLP: Erosive Oral lichen planus |
| LP: leukoplakia | ||
| NEOLP: Non-erosive oral lichen planus | ||
| OSCC: Oral squamous cell carcinoma | ||
| Skin | 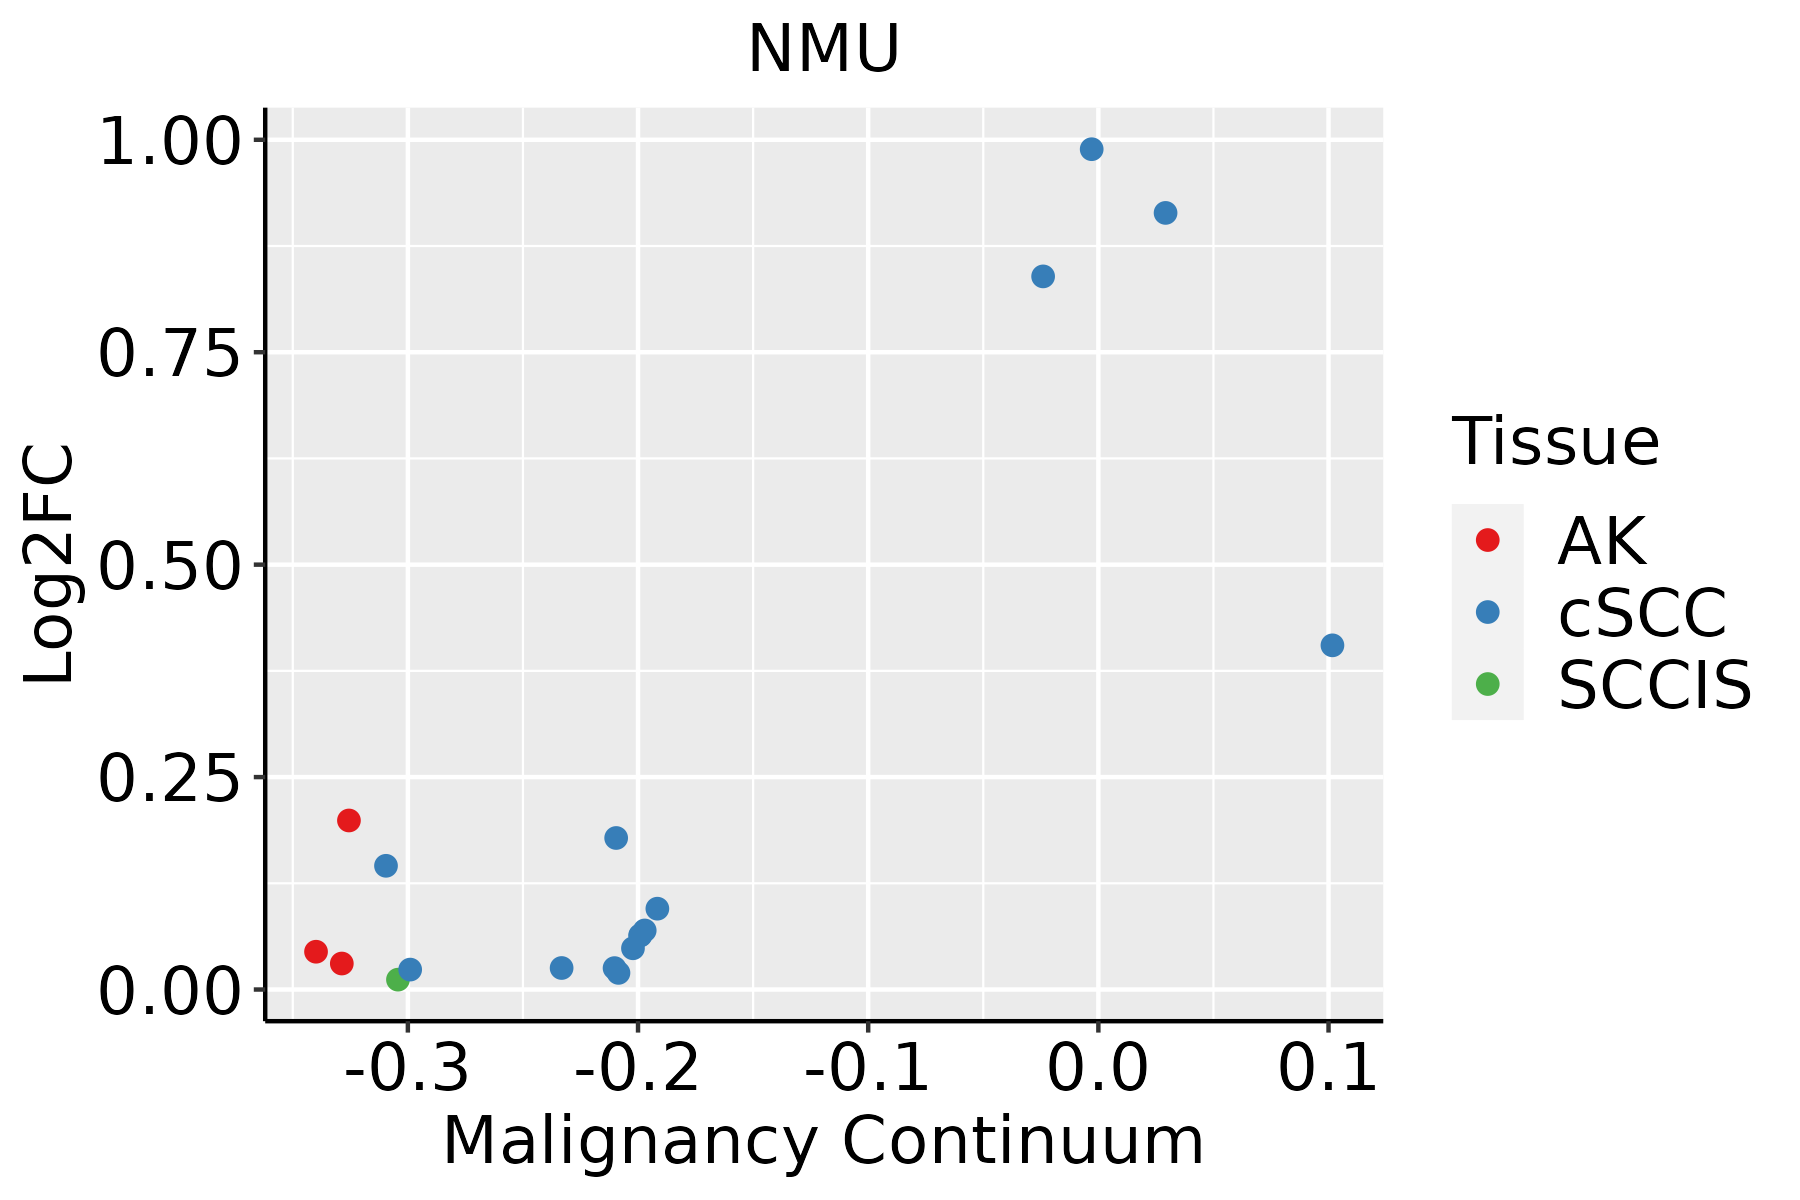 | AK: Actinic keratosis |
| cSCC: Cutaneous squamous cell carcinoma | ||
| SCCIS:squamous cell carcinoma in situ |
| ∗log2FC in expression of this searched gene in stem-like cells from each diseased tissue sample relative to stem-like cells in normal samples in each tissue plotted against the malignancy continuum. Samples are colored based on if they are from different disease stage. |
Top |
Malignant transformation related pathway analysis |
| Find out the enriched GO biological processes and KEGG pathways involved in transition from healthy to precancer to cancer |
| Tissue | Disease Stage | Enriched GO biological Processes |
| Colorectum | AD |  |
| Colorectum | SER |  |
| Colorectum | MSS |  |
| Colorectum | MSI-H |  |
| Colorectum | FAP |  |
| ∗Top 15 enriched GO BP terms are showed in the bar plot of each disease state in each tissue. Each row represents a significant GO biological process which is colored according to the -log10(p.adjust). |
| Page: 1 2 3 4 5 6 7 8 9 |
| GO ID | Tissue | Disease Stage | Description | Gene Ratio | Bg Ratio | pvalue | p.adjust | Count |
| GO:1904951111 | Esophagus | ESCC | positive regulation of establishment of protein localization | 216/8552 | 319/18723 | 1.01e-15 | 6.86e-14 | 216 |
| GO:0051222111 | Esophagus | ESCC | positive regulation of protein transport | 204/8552 | 303/18723 | 1.56e-14 | 8.38e-13 | 204 |
| GO:000931419 | Esophagus | ESCC | response to radiation | 277/8552 | 456/18723 | 4.42e-11 | 1.43e-09 | 277 |
| GO:000941611 | Esophagus | ESCC | response to light stimulus | 183/8552 | 320/18723 | 2.03e-05 | 1.76e-04 | 183 |
| GO:004851118 | Esophagus | ESCC | rhythmic process | 164/8552 | 298/18723 | 6.80e-04 | 3.57e-03 | 164 |
| GO:000762319 | Esophagus | ESCC | circadian rhythm | 119/8552 | 210/18723 | 8.47e-04 | 4.36e-03 | 119 |
| GO:000930617 | Esophagus | ESCC | protein secretion | 190/8552 | 359/18723 | 3.22e-03 | 1.34e-02 | 190 |
| GO:003559217 | Esophagus | ESCC | establishment of protein localization to extracellular region | 190/8552 | 360/18723 | 3.77e-03 | 1.53e-02 | 190 |
| GO:007169210 | Esophagus | ESCC | protein localization to extracellular region | 193/8552 | 368/18723 | 5.01e-03 | 1.92e-02 | 193 |
| GO:005070810 | Esophagus | ESCC | regulation of protein secretion | 142/8552 | 268/18723 | 9.31e-03 | 3.24e-02 | 142 |
| GO:00427529 | Esophagus | ESCC | regulation of circadian rhythm | 68/8552 | 121/18723 | 1.27e-02 | 4.21e-02 | 68 |
| GO:005071416 | Esophagus | ESCC | positive regulation of protein secretion | 76/8552 | 137/18723 | 1.32e-02 | 4.31e-02 | 76 |
| GO:190495119 | Oral cavity | OSCC | positive regulation of establishment of protein localization | 196/7305 | 319/18723 | 2.89e-16 | 2.20e-14 | 196 |
| GO:005122219 | Oral cavity | OSCC | positive regulation of protein transport | 187/7305 | 303/18723 | 7.37e-16 | 5.49e-14 | 187 |
| GO:000931416 | Oral cavity | OSCC | response to radiation | 241/7305 | 456/18723 | 9.76e-10 | 2.40e-08 | 241 |
| GO:004851116 | Oral cavity | OSCC | rhythmic process | 157/7305 | 298/18723 | 1.00e-06 | 1.36e-05 | 157 |
| GO:000762316 | Oral cavity | OSCC | circadian rhythm | 110/7305 | 210/18723 | 5.40e-05 | 4.48e-04 | 110 |
| GO:00094164 | Oral cavity | OSCC | response to light stimulus | 159/7305 | 320/18723 | 5.98e-05 | 4.92e-04 | 159 |
| GO:000930610 | Oral cavity | OSCC | protein secretion | 169/7305 | 359/18723 | 1.04e-03 | 5.34e-03 | 169 |
| GO:003559210 | Oral cavity | OSCC | establishment of protein localization to extracellular region | 169/7305 | 360/18723 | 1.21e-03 | 6.08e-03 | 169 |
| Page: 1 2 |
| Pathway ID | Tissue | Disease Stage | Description | Gene Ratio | Bg Ratio | pvalue | p.adjust | qvalue | Count |
| Page: 1 |
Top |
Cell-cell communication analysis |
| Identification of potential cell-cell interactions between two cell types and their ligand-receptor pairs for different disease states |
| Ligand | Receptor | LRpair | Pathway | Tissue | Disease Stage |
| Page: 1 |
Top |
Single-cell gene regulatory network inference analysis |
| Find out the significant the regulons (TFs) and the target genes of each regulon across cell types for different disease states |
| TF | Cell Type | Tissue | Disease Stage | Target Gene | RSS | Regulon Activity |
| ∗The dot plots of a searched regulon are shown for all cell subpopulations in each disease state of each tissue based on the regulon specific score inferred using pySCENIC and by calculating the average expression. |
| Page: 1 |
Top |
Somatic mutation of malignant transformation related genes |
| Annotation of somatic variants for genes involved in malignant transformation |
| Hugo Symbol | Variant Class | Variant Classification | dbSNP RS | HGVSc | HGVSp | HGVSp Short | SWISSPROT | BIOTYPE | SIFT | PolyPhen | Tumor Sample Barcode | Tissue | Histology | Sex | Age | Stage | Therapy Types | Drugs | Outcome |
| NMU | SNV | Missense_Mutation | rs746842879 | c.229G>A | p.Ala77Thr | p.A77T | P48645 | protein_coding | tolerated(0.39) | benign(0.047) | TCGA-D8-A27G-01 | Breast | breast invasive carcinoma | Female | >=65 | I/II | Unknown | Unknown | SD |
| NMU | SNV | Missense_Mutation | c.280N>A | p.Glu94Lys | p.E94K | P48645 | protein_coding | tolerated(0.34) | benign(0.007) | TCGA-EW-A3E8-01 | Breast | breast invasive carcinoma | Female | <65 | I/II | Hormone Therapy | anastrozole | SD | |
| NMU | SNV | Missense_Mutation | novel | c.145N>A | p.Glu49Lys | p.E49K | P48645 | protein_coding | deleterious(0.01) | benign(0.057) | TCGA-ZJ-AAXU-01 | Cervix | cervical & endocervical cancer | Female | <65 | I/II | Unknown | Unknown | SD |
| NMU | SNV | Missense_Mutation | c.290A>T | p.Glu97Val | p.E97V | P48645 | protein_coding | tolerated(0.1) | possibly_damaging(0.524) | TCGA-CA-6718-01 | Colorectum | colon adenocarcinoma | Male | <65 | I/II | Unknown | Unknown | PD | |
| NMU | SNV | Missense_Mutation | rs746842879 | c.229G>A | p.Ala77Thr | p.A77T | P48645 | protein_coding | tolerated(0.39) | benign(0.047) | TCGA-F4-6808-01 | Colorectum | colon adenocarcinoma | Female | <65 | I/II | Unknown | Unknown | SD |
| NMU | SNV | Missense_Mutation | c.387N>T | p.Gln129His | p.Q129H | P48645 | protein_coding | tolerated(0.12) | probably_damaging(0.956) | TCGA-AP-A059-01 | Endometrium | uterine corpus endometrioid carcinoma | Female | >=65 | I/II | Unknown | Unknown | SD | |
| NMU | SNV | Missense_Mutation | novel | c.286N>A | p.Asp96Asn | p.D96N | P48645 | protein_coding | tolerated(0.16) | benign(0.018) | TCGA-B5-A1MX-01 | Endometrium | uterine corpus endometrioid carcinoma | Female | <65 | I/II | Hormone Therapy | megace | SD |
| NMU | SNV | Missense_Mutation | c.422G>T | p.Arg141Ile | p.R141I | P48645 | protein_coding | deleterious(0) | probably_damaging(0.998) | TCGA-BS-A0UF-01 | Endometrium | uterine corpus endometrioid carcinoma | Female | >=65 | I/II | Unknown | Unknown | SD | |
| NMU | SNV | Missense_Mutation | c.248T>G | p.Phe83Cys | p.F83C | P48645 | protein_coding | deleterious(0.01) | possibly_damaging(0.527) | TCGA-DD-A118-01 | Liver | liver hepatocellular carcinoma | Female | >=65 | I/II | Unknown | Unknown | PD | |
| NMU | SNV | Missense_Mutation | c.134N>T | p.Gly45Val | p.G45V | P48645 | protein_coding | tolerated(0.33) | benign(0.421) | TCGA-55-7994-01 | Lung | lung adenocarcinoma | Male | >=65 | I/II | Chemotherapy | carboplatin | CR |
| Page: 1 2 |
Top |
Related drugs of malignant transformation related genes |
| Identification of chemicals and drugs interact with genes involved in malignant transfromation |
| (DGIdb 4.0) |
| Entrez ID | Symbol | Category | Interaction Types | Drug Claim Name | Drug Name | PMIDs |
| Page: 1 |

Copyright 2023-Present -The University of Texas Health Science Center at Houston |