
|
|||||
|
 | |
| |
| |
| |
| |
| |
|
Gene: NMRAL1 |
Gene summary for NMRAL1 |
| Gene information | Species | Human | Gene symbol | NMRAL1 | Gene ID | 57407 |
| Gene name | NmrA like redox sensor 1 | |
| Gene Alias | HSCARG | |
| Cytomap | 16p13.3 | |
| Gene Type | protein-coding | GO ID | GO:0005575 | UniProtAcc | Q9HBL8 |
Top |
Malignant transformation analysis |
| Identification of the aberrant gene expression in precancerous and cancerous lesions by comparing the gene expression of stem-like cells in diseased tissues with normal stem cells |
| Entrez ID | Symbol | Replicates | Species | Organ | Tissue | Adj P-value | Log2FC | Malignancy |
| 57407 | NMRAL1 | LZE4T | Human | Esophagus | ESCC | 6.43e-10 | 3.16e-01 | 0.0811 |
| 57407 | NMRAL1 | LZE7T | Human | Esophagus | ESCC | 1.85e-15 | 9.65e-01 | 0.0667 |
| 57407 | NMRAL1 | LZE8T | Human | Esophagus | ESCC | 4.15e-12 | 4.52e-01 | 0.067 |
| 57407 | NMRAL1 | LZE20T | Human | Esophagus | ESCC | 1.59e-03 | 2.16e-01 | 0.0662 |
| 57407 | NMRAL1 | LZE22T | Human | Esophagus | ESCC | 3.33e-02 | 2.99e-01 | 0.068 |
| 57407 | NMRAL1 | LZE24T | Human | Esophagus | ESCC | 2.81e-31 | 9.23e-01 | 0.0596 |
| 57407 | NMRAL1 | LZE6T | Human | Esophagus | ESCC | 2.11e-02 | 1.80e-01 | 0.0845 |
| 57407 | NMRAL1 | P1T-E | Human | Esophagus | ESCC | 7.54e-15 | 7.58e-01 | 0.0875 |
| 57407 | NMRAL1 | P2T-E | Human | Esophagus | ESCC | 2.06e-64 | 1.09e+00 | 0.1177 |
| 57407 | NMRAL1 | P4T-E | Human | Esophagus | ESCC | 2.52e-34 | 7.42e-01 | 0.1323 |
| 57407 | NMRAL1 | P5T-E | Human | Esophagus | ESCC | 8.95e-24 | 5.15e-01 | 0.1327 |
| 57407 | NMRAL1 | P8T-E | Human | Esophagus | ESCC | 2.06e-25 | 6.01e-01 | 0.0889 |
| 57407 | NMRAL1 | P9T-E | Human | Esophagus | ESCC | 6.39e-20 | 4.15e-01 | 0.1131 |
| 57407 | NMRAL1 | P11T-E | Human | Esophagus | ESCC | 7.36e-17 | 7.95e-01 | 0.1426 |
| 57407 | NMRAL1 | P12T-E | Human | Esophagus | ESCC | 1.10e-55 | 9.90e-01 | 0.1122 |
| 57407 | NMRAL1 | P15T-E | Human | Esophagus | ESCC | 1.60e-44 | 9.22e-01 | 0.1149 |
| 57407 | NMRAL1 | P16T-E | Human | Esophagus | ESCC | 2.79e-32 | 5.49e-01 | 0.1153 |
| 57407 | NMRAL1 | P17T-E | Human | Esophagus | ESCC | 8.89e-13 | 7.17e-01 | 0.1278 |
| 57407 | NMRAL1 | P19T-E | Human | Esophagus | ESCC | 5.88e-09 | 1.08e+00 | 0.1662 |
| 57407 | NMRAL1 | P20T-E | Human | Esophagus | ESCC | 9.36e-32 | 7.25e-01 | 0.1124 |
| Page: 1 2 3 4 5 6 |
| Tissue | Expression Dynamics | Abbreviation |
| Esophagus | 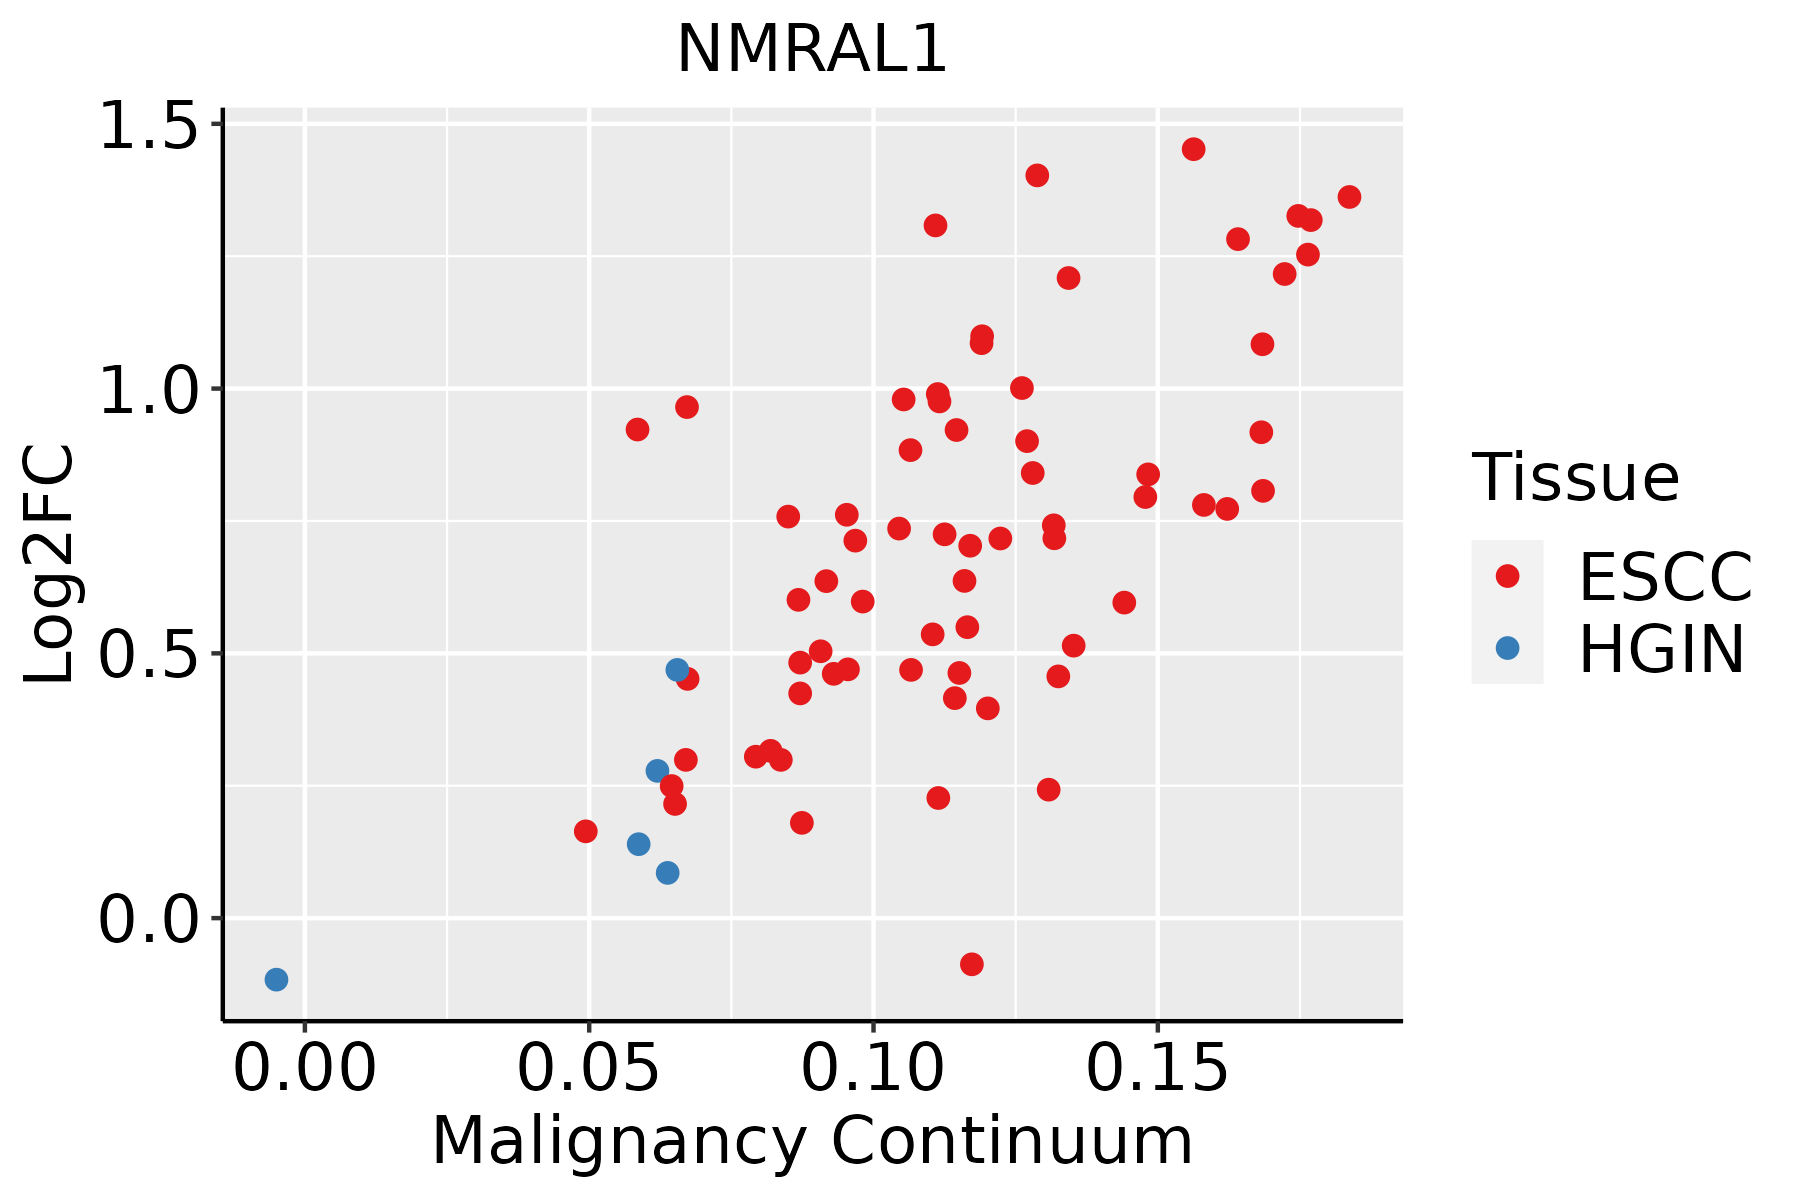 | ESCC: Esophageal squamous cell carcinoma |
| HGIN: High-grade intraepithelial neoplasias | ||
| LGIN: Low-grade intraepithelial neoplasias | ||
| Liver | 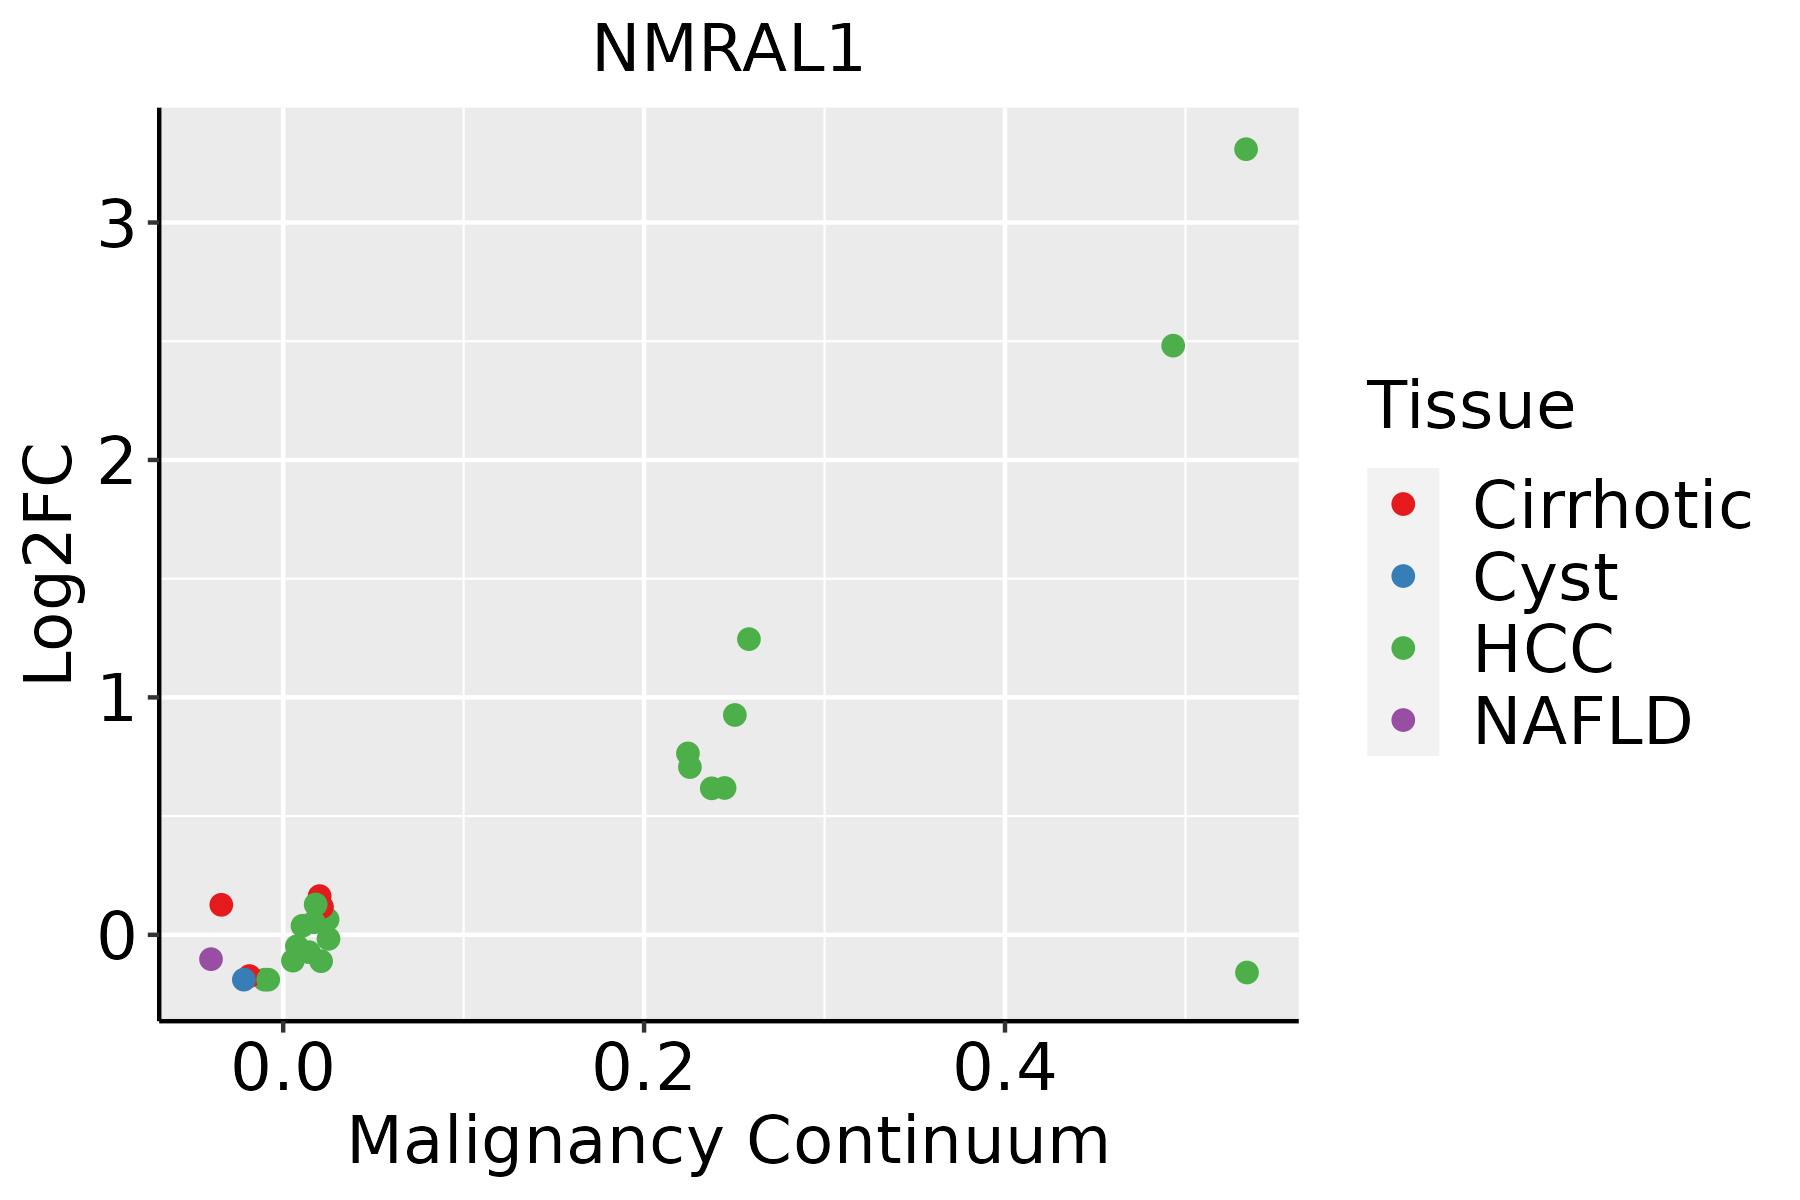 | HCC: Hepatocellular carcinoma |
| NAFLD: Non-alcoholic fatty liver disease | ||
| Oral Cavity | 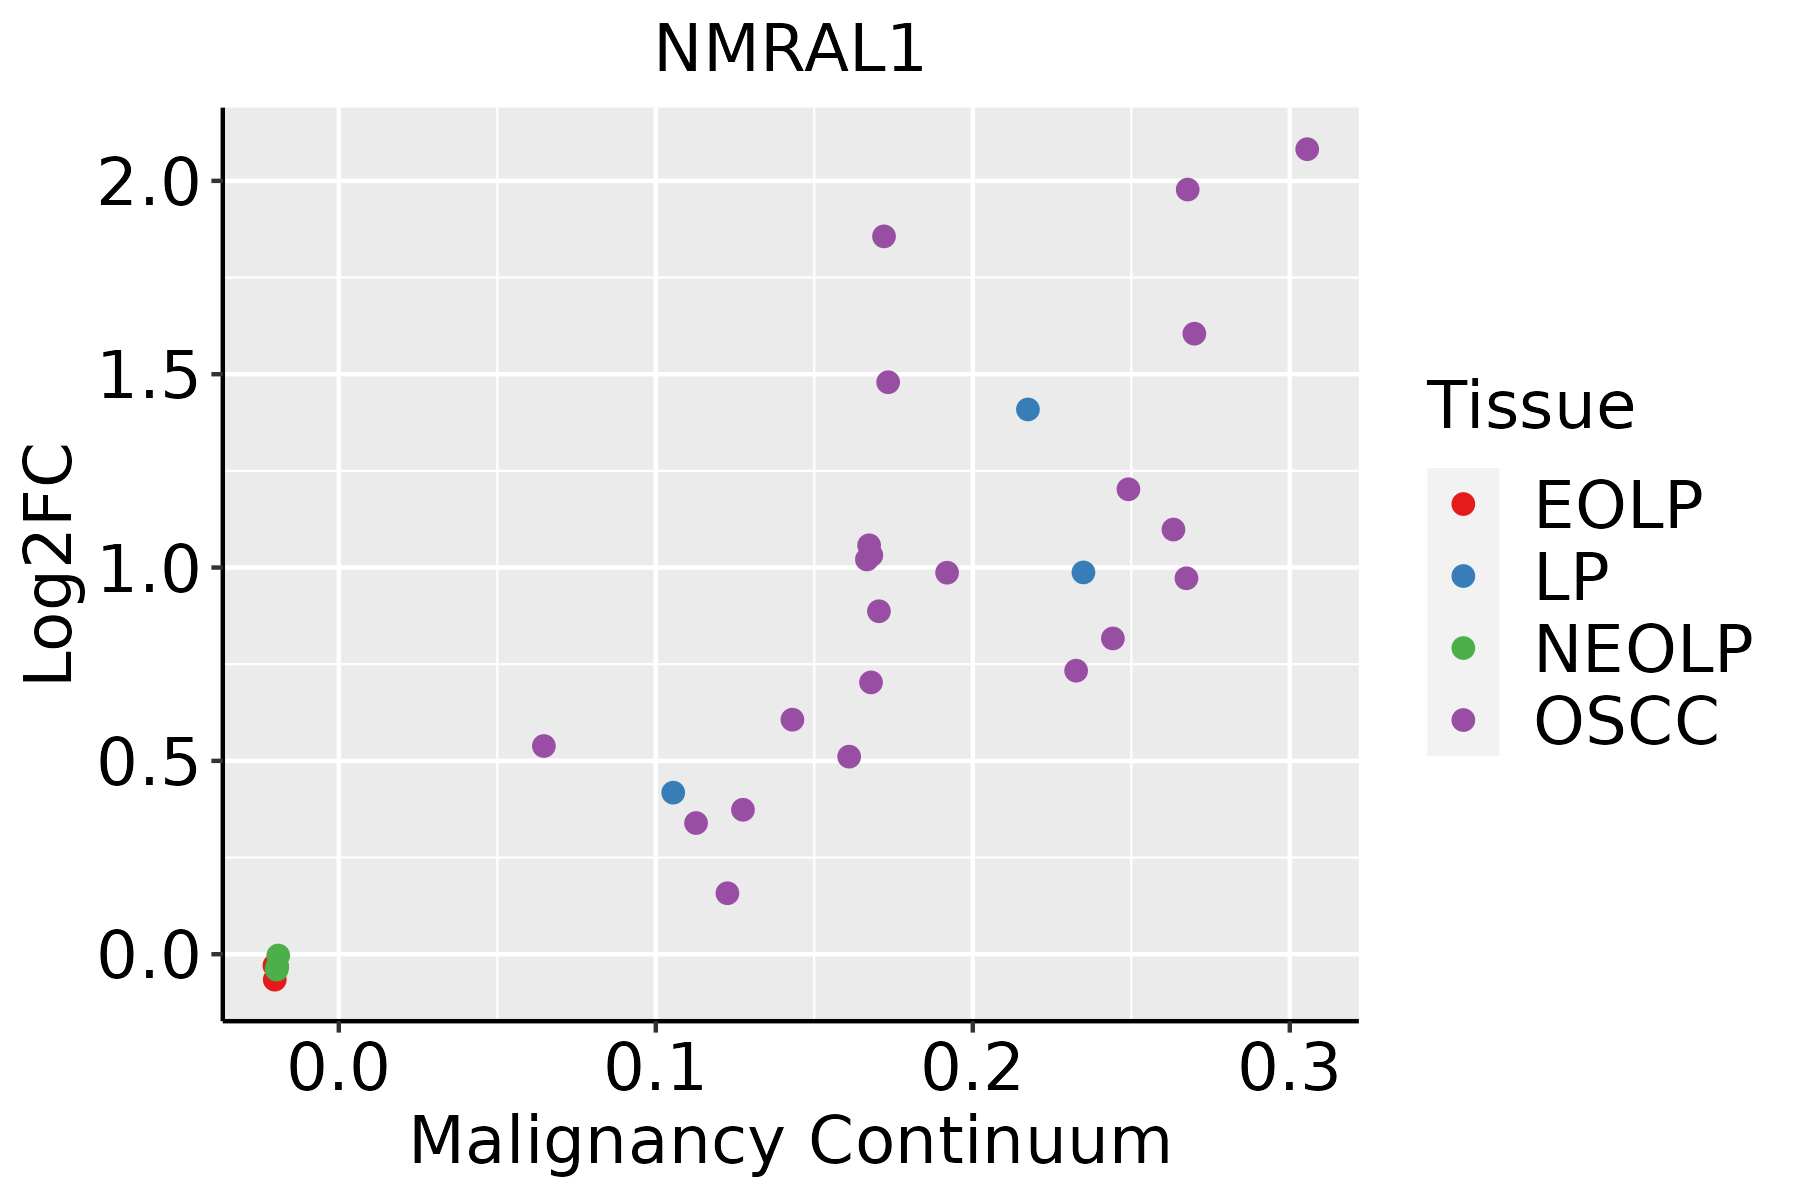 | EOLP: Erosive Oral lichen planus |
| LP: leukoplakia | ||
| NEOLP: Non-erosive oral lichen planus | ||
| OSCC: Oral squamous cell carcinoma | ||
| Prostate | 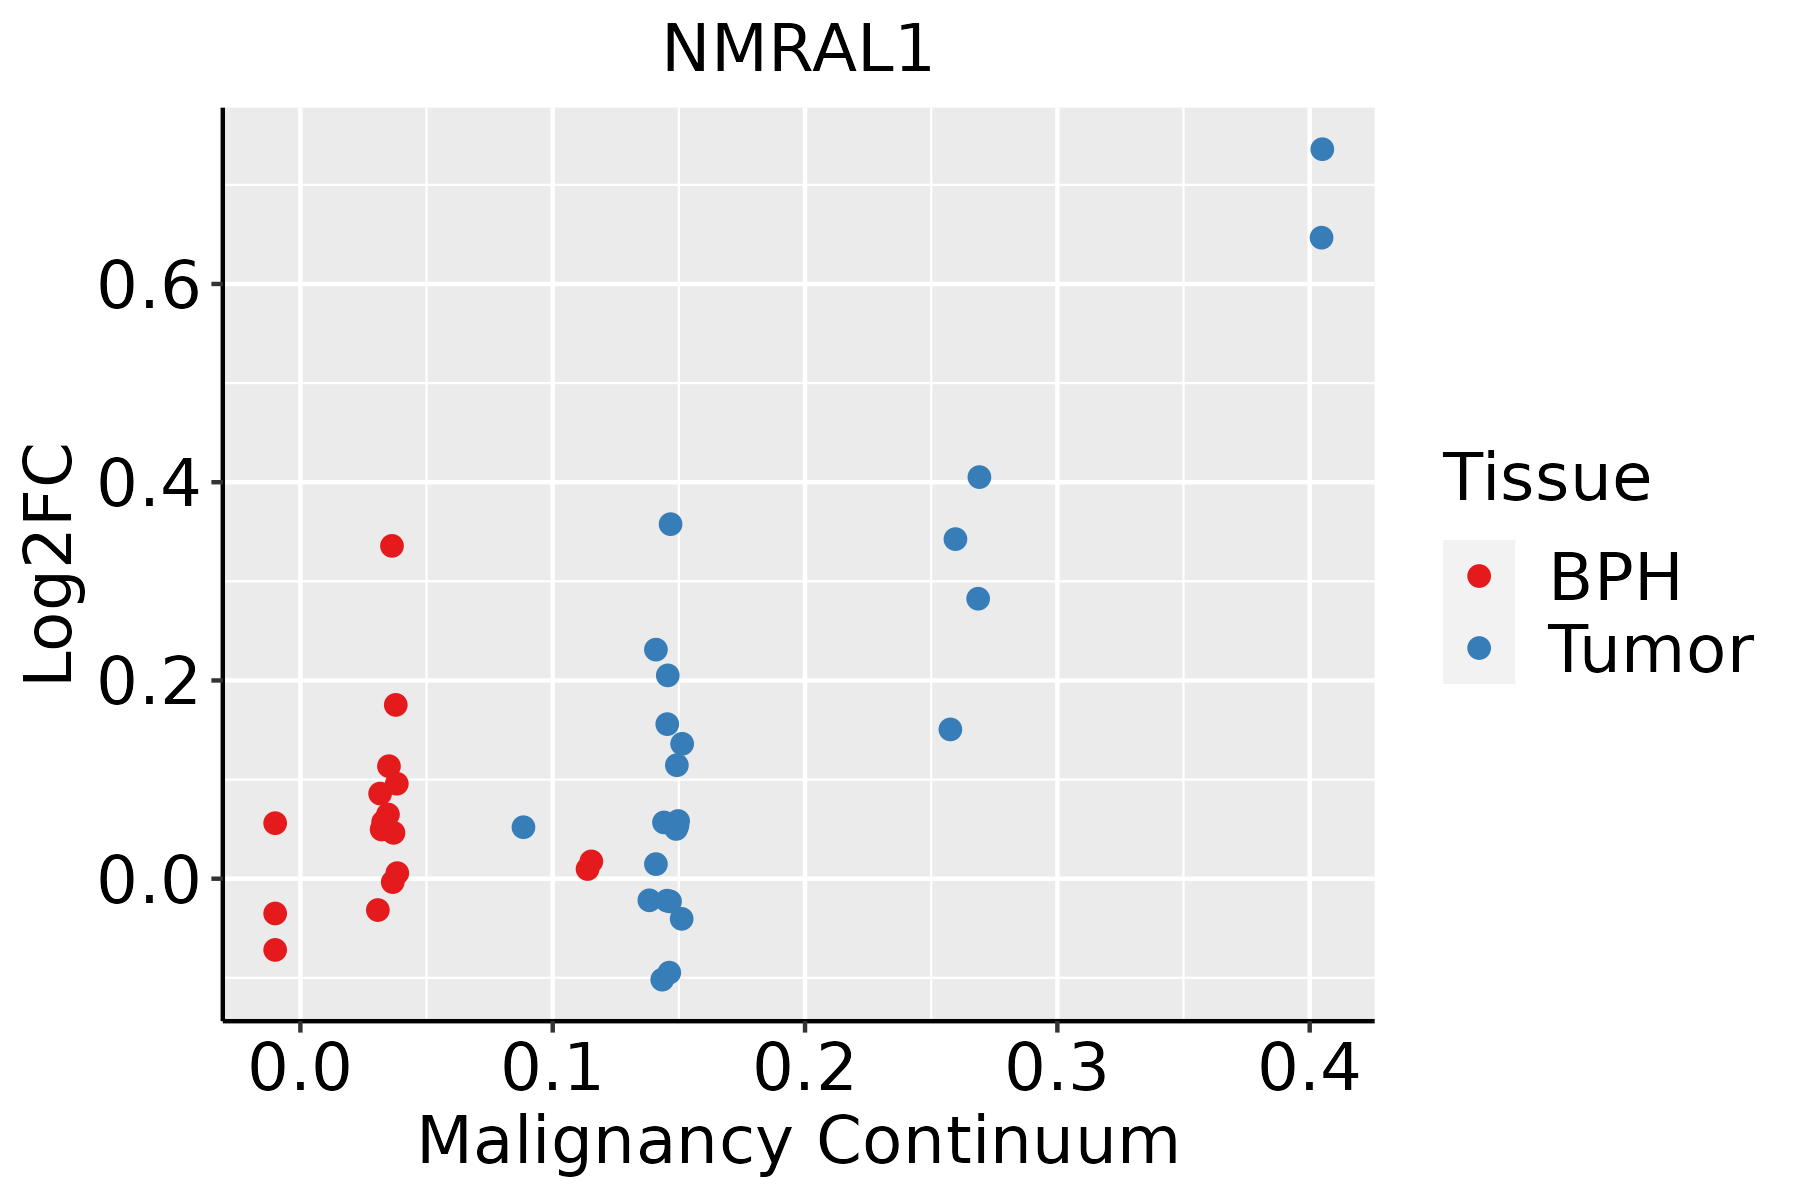 | BPH: Benign Prostatic Hyperplasia |
| Skin | 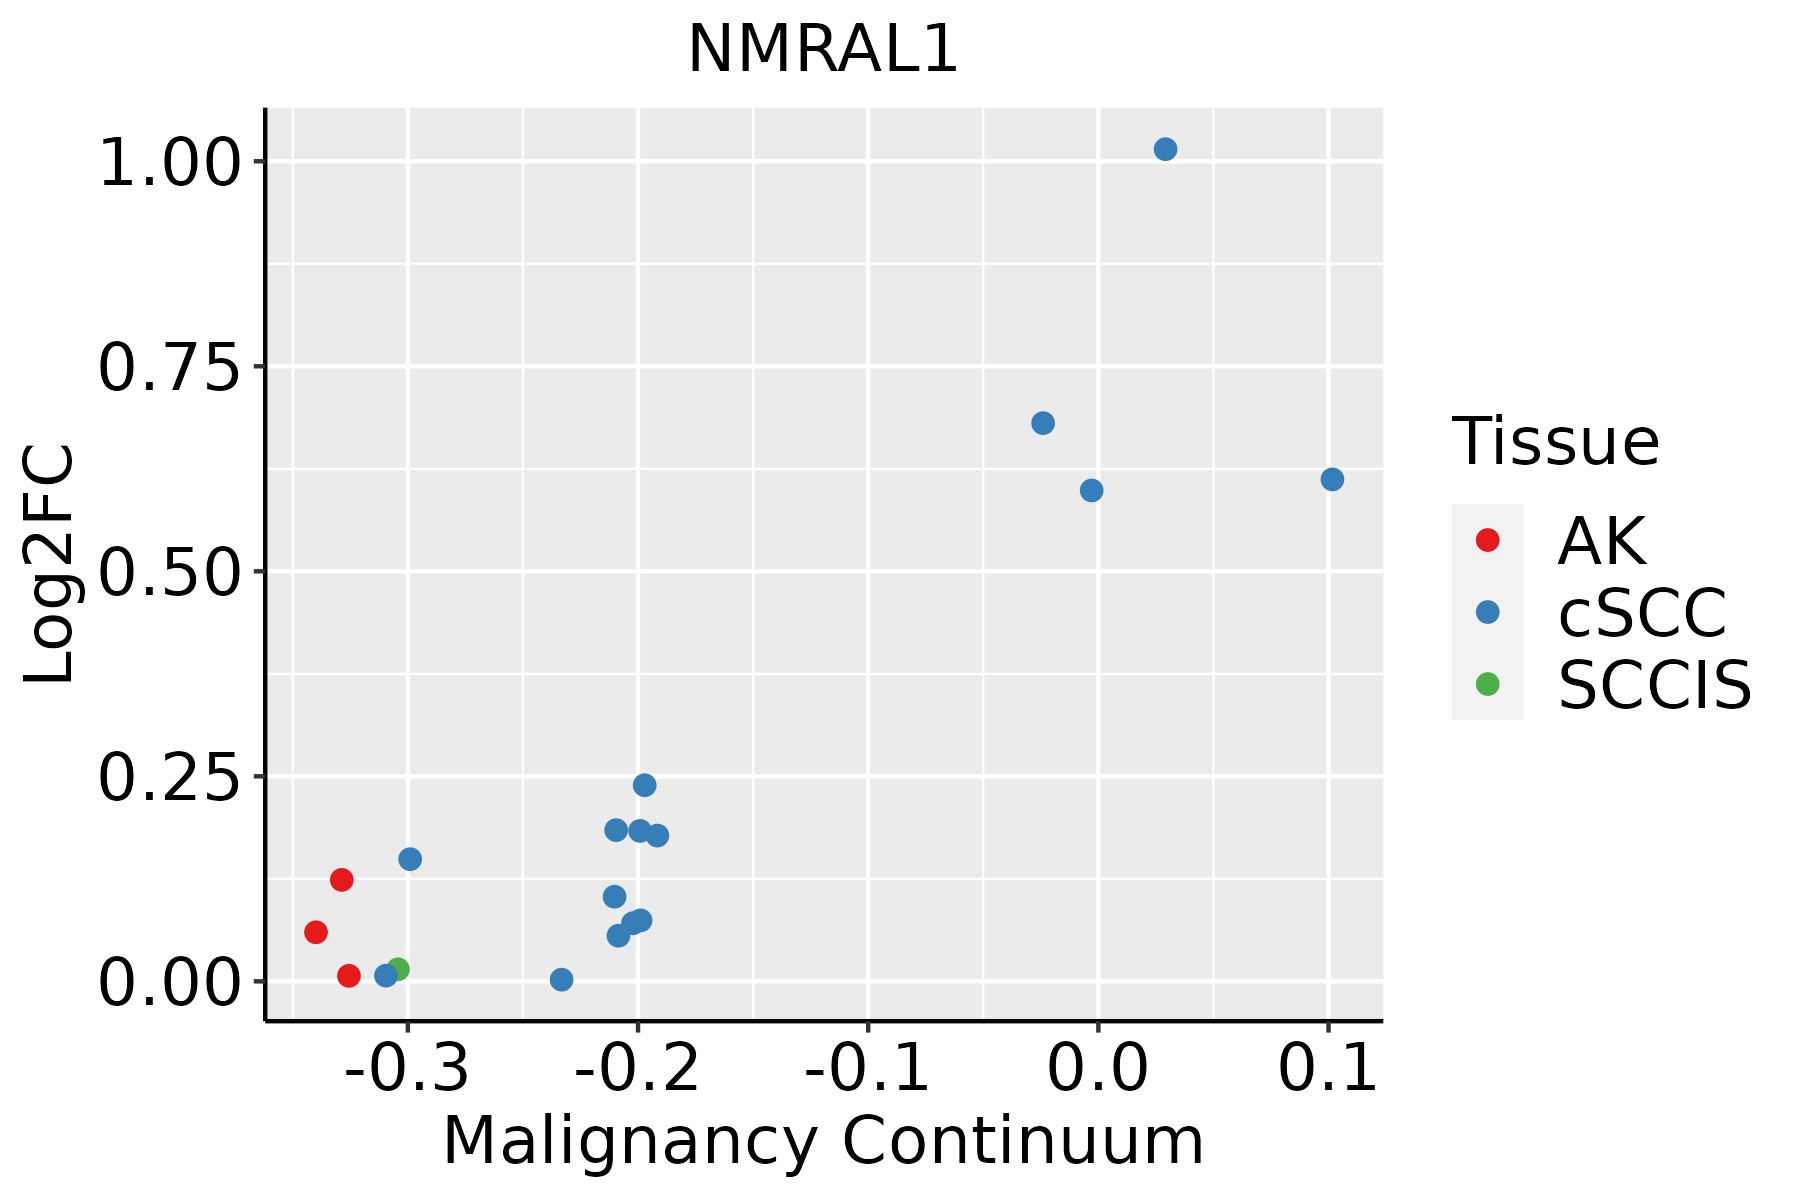 | AK: Actinic keratosis |
| cSCC: Cutaneous squamous cell carcinoma | ||
| SCCIS:squamous cell carcinoma in situ |
| ∗log2FC in expression of this searched gene in stem-like cells from each diseased tissue sample relative to stem-like cells in normal samples in each tissue plotted against the malignancy continuum. Samples are colored based on if they are from different disease stage. |
Top |
Malignant transformation related pathway analysis |
| Find out the enriched GO biological processes and KEGG pathways involved in transition from healthy to precancer to cancer |
| Tissue | Disease Stage | Enriched GO biological Processes |
| Colorectum | AD |  |
| Colorectum | SER |  |
| Colorectum | MSS |  |
| Colorectum | MSI-H |  |
| Colorectum | FAP |  |
| ∗Top 15 enriched GO BP terms are showed in the bar plot of each disease state in each tissue. Each row represents a significant GO biological process which is colored according to the -log10(p.adjust). |
| Page: 1 2 3 4 5 6 7 8 9 |
| GO ID | Tissue | Disease Stage | Description | Gene Ratio | Bg Ratio | pvalue | p.adjust | Count |
| Page: 1 |
| Pathway ID | Tissue | Disease Stage | Description | Gene Ratio | Bg Ratio | pvalue | p.adjust | qvalue | Count |
| Page: 1 |
Top |
Cell-cell communication analysis |
| Identification of potential cell-cell interactions between two cell types and their ligand-receptor pairs for different disease states |
| Ligand | Receptor | LRpair | Pathway | Tissue | Disease Stage |
| Page: 1 |
Top |
Single-cell gene regulatory network inference analysis |
| Find out the significant the regulons (TFs) and the target genes of each regulon across cell types for different disease states |
| TF | Cell Type | Tissue | Disease Stage | Target Gene | RSS | Regulon Activity |
| NMRAL1 | MLUM | Breast | Precancer | TPT1,RHCG,TSTD1, etc. | 2.53e-01 |  |
| NMRAL1 | ACINAR | Pancreas | ADJ | NME4,EIF4EBP1,RPS4Y1, etc. | 3.47e-01 |  |
| ∗The dot plots of a searched regulon are shown for all cell subpopulations in each disease state of each tissue based on the regulon specific score inferred using pySCENIC and by calculating the average expression. |
| Page: 1 |
Top |
Somatic mutation of malignant transformation related genes |
| Annotation of somatic variants for genes involved in malignant transformation |
| Hugo Symbol | Variant Class | Variant Classification | dbSNP RS | HGVSc | HGVSp | HGVSp Short | SWISSPROT | BIOTYPE | SIFT | PolyPhen | Tumor Sample Barcode | Tissue | Histology | Sex | Age | Stage | Therapy Types | Drugs | Outcome |
| NMRAL1 | SNV | Missense_Mutation | c.783N>G | p.Phe261Leu | p.F261L | Q9HBL8 | protein_coding | tolerated(0.08) | probably_damaging(0.98) | TCGA-BH-A0B6-01 | Breast | breast invasive carcinoma | Female | <65 | I/II | Unknown | Unknown | SD | |
| NMRAL1 | SNV | Missense_Mutation | rs776130933 | c.387C>A | p.His129Gln | p.H129Q | Q9HBL8 | protein_coding | deleterious(0) | probably_damaging(0.999) | TCGA-D8-A1XQ-01 | Breast | breast invasive carcinoma | Female | >=65 | I/II | Unknown | Unknown | SD |
| NMRAL1 | insertion | In_Frame_Ins | novel | c.537_538insTCCACCTCCCAAAGTGCTGGGATG | p.Pro179_Thr180insSerThrSerGlnSerAlaGlyMet | p.P179_T180insSTSQSAGM | Q9HBL8 | protein_coding | TCGA-AN-A0FX-01 | Breast | breast invasive carcinoma | Female | <65 | I/II | Unknown | Unknown | SD | ||
| NMRAL1 | deletion | Frame_Shift_Del | c.384delG | p.His129ThrfsTer19 | p.H129Tfs*19 | Q9HBL8 | protein_coding | TCGA-D8-A27V-01 | Breast | breast invasive carcinoma | Female | <65 | I/II | Hormone Therapy | tamoxiphen | SD | |||
| NMRAL1 | SNV | Missense_Mutation | rs77934295 | c.58G>A | p.Val20Met | p.V20M | Q9HBL8 | protein_coding | deleterious(0) | probably_damaging(0.999) | TCGA-AA-3710-01 | Colorectum | colon adenocarcinoma | Female | >=65 | I/II | Unknown | Unknown | SD |
| NMRAL1 | SNV | Missense_Mutation | novel | c.457N>T | p.Pro153Ser | p.P153S | Q9HBL8 | protein_coding | tolerated(0.53) | benign(0.161) | TCGA-AA-A010-01 | Colorectum | colon adenocarcinoma | Female | <65 | I/II | Chemotherapy | folinic | CR |
| NMRAL1 | SNV | Missense_Mutation | c.568G>A | p.Val190Met | p.V190M | Q9HBL8 | protein_coding | deleterious(0) | possibly_damaging(0.848) | TCGA-AZ-6601-01 | Colorectum | colon adenocarcinoma | Male | >=65 | I/II | Unknown | Unknown | PD | |
| NMRAL1 | SNV | Missense_Mutation | rs149409840 | c.739N>A | p.Glu247Lys | p.E247K | Q9HBL8 | protein_coding | tolerated(0.15) | benign(0.382) | TCGA-A5-A0GP-01 | Endometrium | uterine corpus endometrioid carcinoma | Female | <65 | I/II | Unknown | Unknown | SD |
| NMRAL1 | SNV | Missense_Mutation | rs149409840 | c.739G>A | p.Glu247Lys | p.E247K | Q9HBL8 | protein_coding | tolerated(0.15) | benign(0.382) | TCGA-AJ-A3EL-01 | Endometrium | uterine corpus endometrioid carcinoma | Female | <65 | I/II | Unknown | Unknown | SD |
| NMRAL1 | SNV | Missense_Mutation | rs140164470 | c.232G>A | p.Val78Met | p.V78M | Q9HBL8 | protein_coding | tolerated(0.09) | probably_damaging(0.999) | TCGA-AJ-A3EL-01 | Endometrium | uterine corpus endometrioid carcinoma | Female | <65 | I/II | Unknown | Unknown | SD |
| Page: 1 2 3 |
Top |
Related drugs of malignant transformation related genes |
| Identification of chemicals and drugs interact with genes involved in malignant transfromation |
| (DGIdb 4.0) |
| Entrez ID | Symbol | Category | Interaction Types | Drug Claim Name | Drug Name | PMIDs |
| Page: 1 |

Copyright 2023-Present -The University of Texas Health Science Center at Houston |