
|
|||||
|
 | |
| |
| |
| |
| |
| |
|
Gene: NMNAT3 |
Gene summary for NMNAT3 |
| Gene information | Species | Human | Gene symbol | NMNAT3 | Gene ID | 349565 |
| Gene name | nicotinamide nucleotide adenylyltransferase 3 | |
| Gene Alias | FKSG76 | |
| Cytomap | 3q23 | |
| Gene Type | protein-coding | GO ID | GO:0006139 | UniProtAcc | Q49AL4 |
Top |
Malignant transformation analysis |
| Identification of the aberrant gene expression in precancerous and cancerous lesions by comparing the gene expression of stem-like cells in diseased tissues with normal stem cells |
| Entrez ID | Symbol | Replicates | Species | Organ | Tissue | Adj P-value | Log2FC | Malignancy |
| 349565 | NMNAT3 | CCI_1 | Human | Cervix | CC | 3.23e-02 | 3.29e-01 | 0.528 |
| 349565 | NMNAT3 | CCI_2 | Human | Cervix | CC | 2.30e-10 | 7.12e-01 | 0.5249 |
| 349565 | NMNAT3 | CCI_3 | Human | Cervix | CC | 1.72e-11 | 5.57e-01 | 0.516 |
| 349565 | NMNAT3 | LZE2T | Human | Esophagus | ESCC | 6.92e-06 | 4.99e-01 | 0.082 |
| 349565 | NMNAT3 | LZE4T | Human | Esophagus | ESCC | 1.49e-08 | 2.55e-01 | 0.0811 |
| 349565 | NMNAT3 | LZE7T | Human | Esophagus | ESCC | 5.83e-11 | 7.70e-01 | 0.0667 |
| 349565 | NMNAT3 | LZE8T | Human | Esophagus | ESCC | 2.25e-06 | 2.39e-01 | 0.067 |
| 349565 | NMNAT3 | LZE22T | Human | Esophagus | ESCC | 2.96e-05 | 3.47e-01 | 0.068 |
| 349565 | NMNAT3 | LZE24T | Human | Esophagus | ESCC | 4.33e-10 | 2.63e-01 | 0.0596 |
| 349565 | NMNAT3 | P1T-E | Human | Esophagus | ESCC | 1.10e-02 | 2.61e-01 | 0.0875 |
| 349565 | NMNAT3 | P2T-E | Human | Esophagus | ESCC | 7.32e-38 | 6.32e-01 | 0.1177 |
| 349565 | NMNAT3 | P4T-E | Human | Esophagus | ESCC | 1.85e-30 | 6.75e-01 | 0.1323 |
| 349565 | NMNAT3 | P5T-E | Human | Esophagus | ESCC | 2.26e-20 | 4.17e-01 | 0.1327 |
| 349565 | NMNAT3 | P8T-E | Human | Esophagus | ESCC | 4.31e-06 | 1.91e-01 | 0.0889 |
| 349565 | NMNAT3 | P9T-E | Human | Esophagus | ESCC | 5.71e-18 | 3.63e-01 | 0.1131 |
| 349565 | NMNAT3 | P10T-E | Human | Esophagus | ESCC | 6.10e-08 | 1.38e-01 | 0.116 |
| 349565 | NMNAT3 | P11T-E | Human | Esophagus | ESCC | 1.34e-09 | 3.73e-01 | 0.1426 |
| 349565 | NMNAT3 | P12T-E | Human | Esophagus | ESCC | 5.95e-29 | 5.09e-01 | 0.1122 |
| 349565 | NMNAT3 | P15T-E | Human | Esophagus | ESCC | 5.90e-27 | 5.50e-01 | 0.1149 |
| 349565 | NMNAT3 | P16T-E | Human | Esophagus | ESCC | 9.05e-23 | 4.19e-01 | 0.1153 |
| Page: 1 2 3 4 |
| Tissue | Expression Dynamics | Abbreviation |
| Cervix |  | CC: Cervix cancer |
| HSIL_HPV: HPV-infected high-grade squamous intraepithelial lesions | ||
| N_HPV: HPV-infected normal cervix | ||
| Esophagus |  | ESCC: Esophageal squamous cell carcinoma |
| HGIN: High-grade intraepithelial neoplasias | ||
| LGIN: Low-grade intraepithelial neoplasias | ||
| Liver | 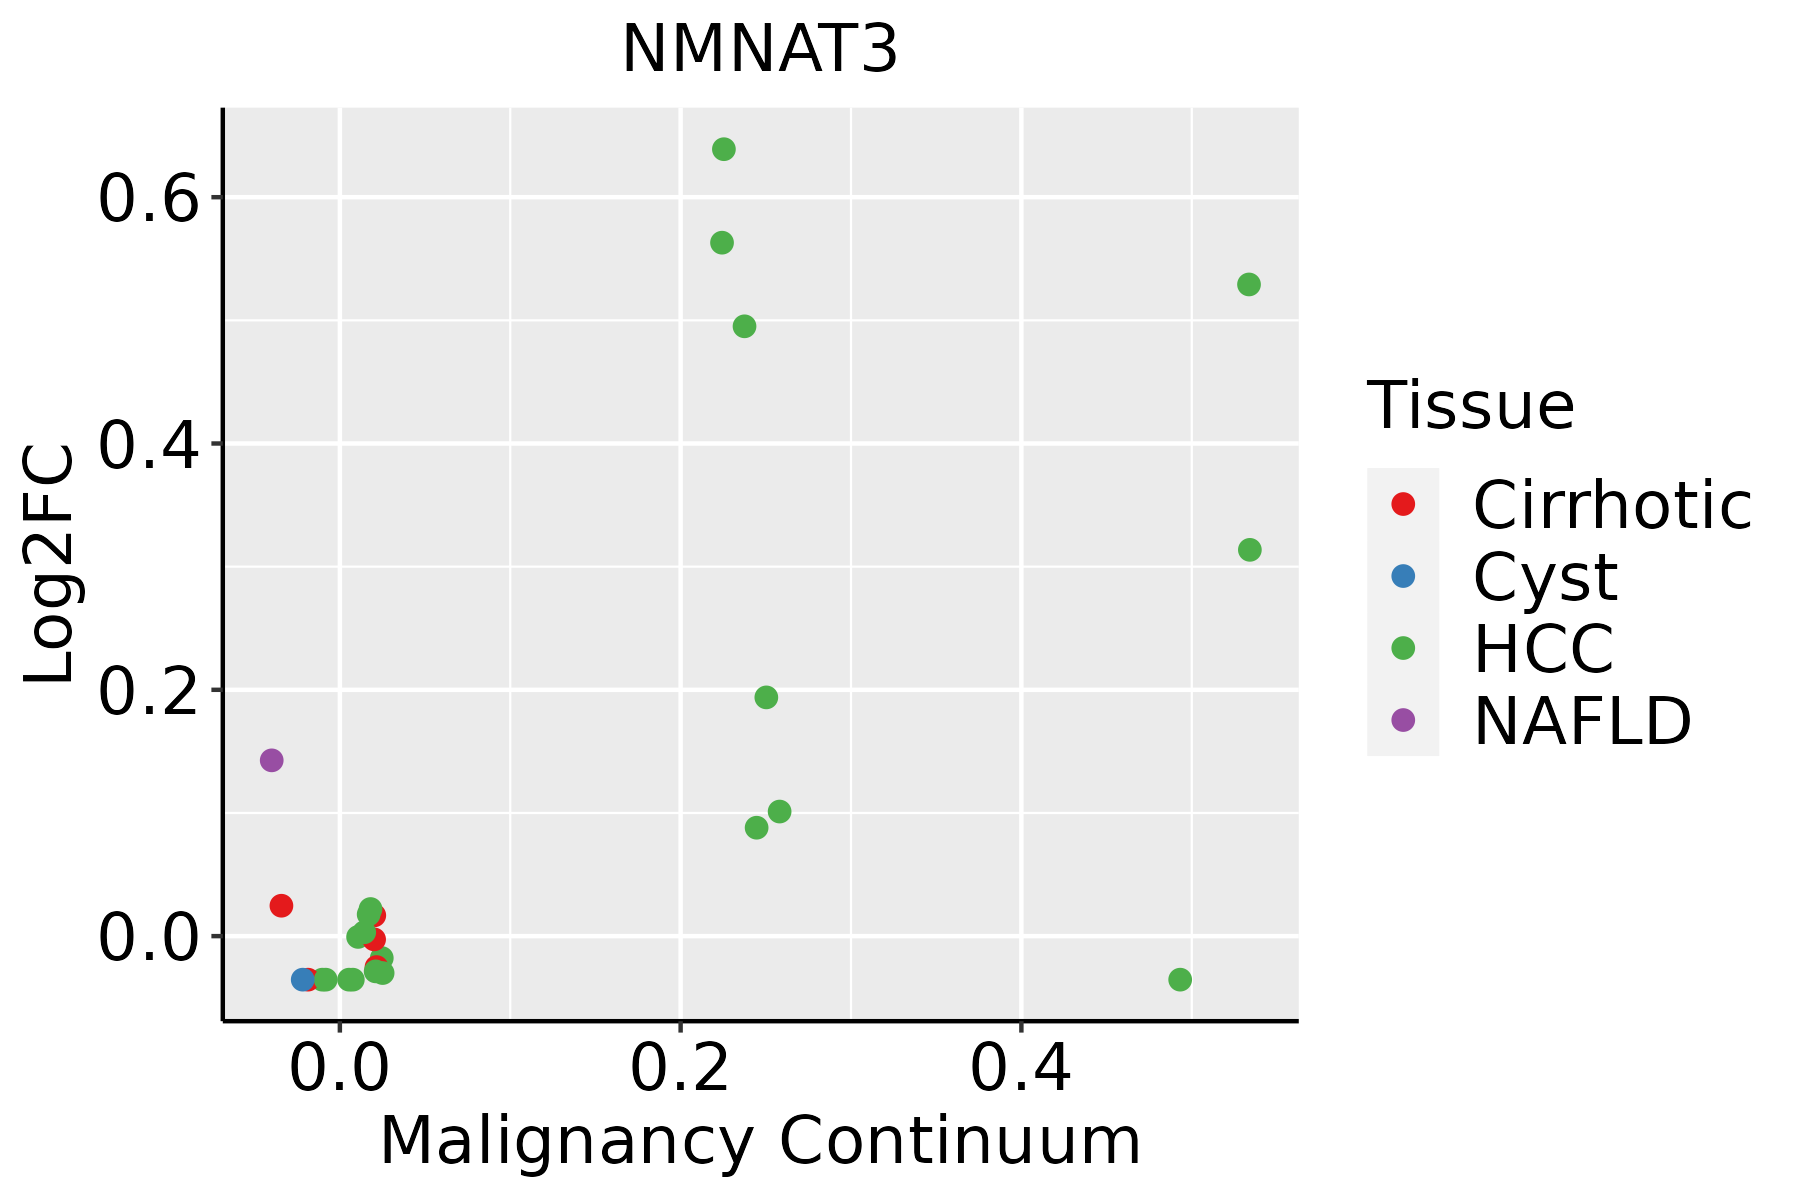 | HCC: Hepatocellular carcinoma |
| NAFLD: Non-alcoholic fatty liver disease | ||
| Oral Cavity | 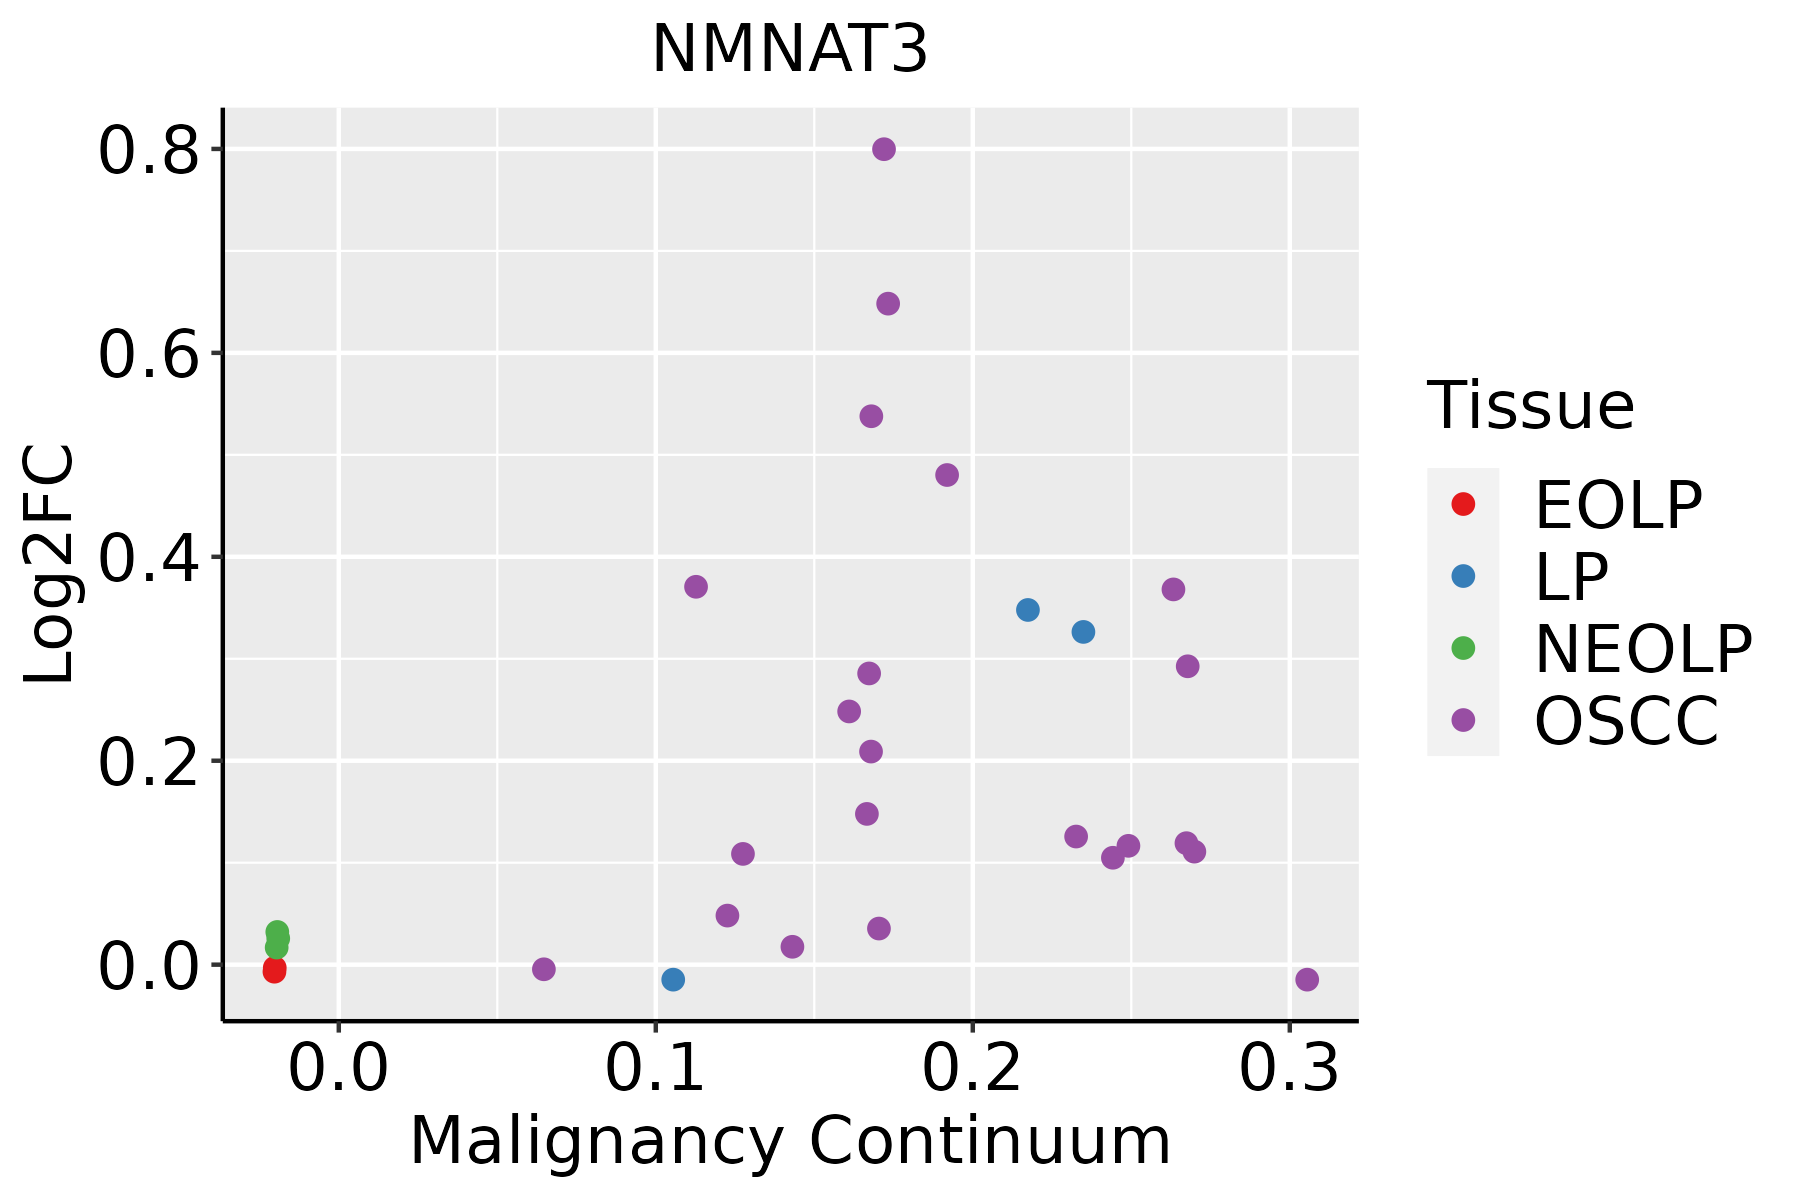 | EOLP: Erosive Oral lichen planus |
| LP: leukoplakia | ||
| NEOLP: Non-erosive oral lichen planus | ||
| OSCC: Oral squamous cell carcinoma |
| ∗log2FC in expression of this searched gene in stem-like cells from each diseased tissue sample relative to stem-like cells in normal samples in each tissue plotted against the malignancy continuum. Samples are colored based on if they are from different disease stage. |
Top |
Malignant transformation related pathway analysis |
| Find out the enriched GO biological processes and KEGG pathways involved in transition from healthy to precancer to cancer |
| Tissue | Disease Stage | Enriched GO biological Processes |
| Colorectum | AD |  |
| Colorectum | SER |  |
| Colorectum | MSS |  |
| Colorectum | MSI-H |  |
| Colorectum | FAP |  |
| ∗Top 15 enriched GO BP terms are showed in the bar plot of each disease state in each tissue. Each row represents a significant GO biological process which is colored according to the -log10(p.adjust). |
| Page: 1 2 3 4 5 6 7 8 9 |
| GO ID | Tissue | Disease Stage | Description | Gene Ratio | Bg Ratio | pvalue | p.adjust | Count |
| GO:000911710 | Cervix | CC | nucleotide metabolic process | 79/2311 | 489/18723 | 7.16e-03 | 3.85e-02 | 79 |
| GO:0006753110 | Esophagus | ESCC | nucleoside phosphate metabolic process | 288/8552 | 497/18723 | 1.80e-08 | 3.50e-07 | 288 |
| GO:0009117111 | Esophagus | ESCC | nucleotide metabolic process | 282/8552 | 489/18723 | 4.70e-08 | 8.50e-07 | 282 |
| GO:000916516 | Esophagus | ESCC | nucleotide biosynthetic process | 150/8552 | 254/18723 | 1.12e-05 | 1.06e-04 | 150 |
| GO:190129316 | Esophagus | ESCC | nucleoside phosphate biosynthetic process | 151/8552 | 256/18723 | 1.15e-05 | 1.08e-04 | 151 |
| GO:000911722 | Liver | HCC | nucleotide metabolic process | 300/7958 | 489/18723 | 1.61e-17 | 1.71e-15 | 300 |
| GO:000675322 | Liver | HCC | nucleoside phosphate metabolic process | 304/7958 | 497/18723 | 1.78e-17 | 1.85e-15 | 304 |
| GO:000916512 | Liver | HCC | nucleotide biosynthetic process | 150/7958 | 254/18723 | 6.79e-08 | 1.40e-06 | 150 |
| GO:190129312 | Liver | HCC | nucleoside phosphate biosynthetic process | 151/7958 | 256/18723 | 6.84e-08 | 1.41e-06 | 151 |
| GO:0072525 | Liver | HCC | pyridine-containing compound biosynthetic process | 22/7958 | 32/18723 | 2.43e-03 | 1.18e-02 | 22 |
| GO:0072524 | Liver | HCC | pyridine-containing compound metabolic process | 25/7958 | 38/18723 | 3.18e-03 | 1.47e-02 | 25 |
| GO:0019359 | Liver | HCC | nicotinamide nucleotide biosynthetic process | 19/7958 | 29/18723 | 1.05e-02 | 3.89e-02 | 19 |
| GO:0019363 | Liver | HCC | pyridine nucleotide biosynthetic process | 19/7958 | 29/18723 | 1.05e-02 | 3.89e-02 | 19 |
| GO:000675318 | Oral cavity | OSCC | nucleoside phosphate metabolic process | 247/7305 | 497/18723 | 6.28e-07 | 8.96e-06 | 247 |
| GO:000911719 | Oral cavity | OSCC | nucleotide metabolic process | 243/7305 | 489/18723 | 7.80e-07 | 1.09e-05 | 243 |
| GO:19012938 | Oral cavity | OSCC | nucleoside phosphate biosynthetic process | 125/7305 | 256/18723 | 8.32e-04 | 4.41e-03 | 125 |
| GO:00091658 | Oral cavity | OSCC | nucleotide biosynthetic process | 124/7305 | 254/18723 | 8.79e-04 | 4.63e-03 | 124 |
| Page: 1 |
| Pathway ID | Tissue | Disease Stage | Description | Gene Ratio | Bg Ratio | pvalue | p.adjust | qvalue | Count |
| hsa012405 | Esophagus | ESCC | Biosynthesis of cofactors | 97/4205 | 153/8465 | 3.88e-04 | 1.35e-03 | 6.94e-04 | 97 |
| hsa0124012 | Esophagus | ESCC | Biosynthesis of cofactors | 97/4205 | 153/8465 | 3.88e-04 | 1.35e-03 | 6.94e-04 | 97 |
| hsa012402 | Liver | HCC | Biosynthesis of cofactors | 103/4020 | 153/8465 | 4.67e-07 | 5.05e-06 | 2.81e-06 | 103 |
| hsa012403 | Liver | HCC | Biosynthesis of cofactors | 103/4020 | 153/8465 | 4.67e-07 | 5.05e-06 | 2.81e-06 | 103 |
| hsa012404 | Oral cavity | OSCC | Biosynthesis of cofactors | 88/3704 | 153/8465 | 3.84e-04 | 1.20e-03 | 6.12e-04 | 88 |
| hsa0124011 | Oral cavity | OSCC | Biosynthesis of cofactors | 88/3704 | 153/8465 | 3.84e-04 | 1.20e-03 | 6.12e-04 | 88 |
| Page: 1 |
Top |
Cell-cell communication analysis |
| Identification of potential cell-cell interactions between two cell types and their ligand-receptor pairs for different disease states |
| Ligand | Receptor | LRpair | Pathway | Tissue | Disease Stage |
| Page: 1 |
Top |
Single-cell gene regulatory network inference analysis |
| Find out the significant the regulons (TFs) and the target genes of each regulon across cell types for different disease states |
| TF | Cell Type | Tissue | Disease Stage | Target Gene | RSS | Regulon Activity |
| ∗The dot plots of a searched regulon are shown for all cell subpopulations in each disease state of each tissue based on the regulon specific score inferred using pySCENIC and by calculating the average expression. |
| Page: 1 |
Top |
Somatic mutation of malignant transformation related genes |
| Annotation of somatic variants for genes involved in malignant transformation |
| Hugo Symbol | Variant Class | Variant Classification | dbSNP RS | HGVSc | HGVSp | HGVSp Short | SWISSPROT | BIOTYPE | SIFT | PolyPhen | Tumor Sample Barcode | Tissue | Histology | Sex | Age | Stage | Therapy Types | Drugs | Outcome |
| NMNAT3 | SNV | Missense_Mutation | c.505G>C | p.Gly169Arg | p.G169R | Q96T66 | protein_coding | deleterious(0) | probably_damaging(1) | TCGA-AO-A0JB-01 | Breast | breast invasive carcinoma | Female | <65 | III/IV | Chemotherapy | cyclophosphamide | SD | |
| NMNAT3 | insertion | Frame_Shift_Ins | novel | c.184_185insCTTATATTGAAAATTATATAAGGAATAAATTGACACCTAG | p.His62ProfsTer38 | p.H62Pfs*38 | Q96T66 | protein_coding | TCGA-AN-A0FX-01 | Breast | breast invasive carcinoma | Female | <65 | I/II | Unknown | Unknown | SD | ||
| NMNAT3 | insertion | Nonsense_Mutation | novel | c.502_503insCCTTTCATAAAATTTAAACAAAACTCTTTC | p.Val168delinsAlaPheHisLysIleTerThrLysLeuPheLeu | p.V168delinsAFHKI*TKLFL | Q96T66 | protein_coding | TCGA-AO-A0JB-01 | Breast | breast invasive carcinoma | Female | <65 | III/IV | Chemotherapy | cyclophosphamide | SD | ||
| NMNAT3 | SNV | Missense_Mutation | c.595G>C | p.Glu199Gln | p.E199Q | Q96T66 | protein_coding | deleterious(0) | possibly_damaging(0.879) | TCGA-Q1-A73O-01 | Cervix | cervical & endocervical cancer | Female | <65 | I/II | Chemotherapy | cisplatin | CR | |
| NMNAT3 | SNV | Missense_Mutation | rs115220874 | c.175G>A | p.Ala59Thr | p.A59T | Q96T66 | protein_coding | deleterious(0.04) | benign(0.01) | TCGA-AA-3815-01 | Colorectum | colon adenocarcinoma | Female | >=65 | I/II | Unknown | Unknown | SD |
| NMNAT3 | SNV | Missense_Mutation | c.263N>T | p.Ala88Val | p.A88V | Q96T66 | protein_coding | tolerated(0.22) | benign(0.001) | TCGA-AA-3977-01 | Colorectum | colon adenocarcinoma | Male | >=65 | I/II | Unknown | Unknown | SD | |
| NMNAT3 | SNV | Missense_Mutation | rs775689705 | c.70N>T | p.Arg24Cys | p.R24C | Q96T66 | protein_coding | deleterious(0) | probably_damaging(0.991) | TCGA-A5-A2K5-01 | Endometrium | uterine corpus endometrioid carcinoma | Female | >=65 | I/II | Unknown | Unknown | SD |
| NMNAT3 | SNV | Missense_Mutation | rs140129205 | c.205C>T | p.Arg69Trp | p.R69W | Q96T66 | protein_coding | tolerated(0.07) | benign(0.021) | TCGA-AP-A1DK-01 | Endometrium | uterine corpus endometrioid carcinoma | Female | <65 | I/II | Unknown | Unknown | SD |
| NMNAT3 | SNV | Missense_Mutation | novel | c.347A>G | p.His116Arg | p.H116R | Q96T66 | protein_coding | tolerated(0.68) | benign(0.001) | TCGA-AX-A06F-01 | Endometrium | uterine corpus endometrioid carcinoma | Female | <65 | III/IV | Chemotherapy | carboplatin | SD |
| NMNAT3 | SNV | Missense_Mutation | novel | c.737N>T | p.Ser246Ile | p.S246I | Q96T66 | protein_coding | tolerated_low_confidence(0.18) | benign(0.018) | TCGA-AX-A1CE-01 | Endometrium | uterine corpus endometrioid carcinoma | Female | <65 | I/II | Unspecific | Paclitaxel | SD |
| Page: 1 2 3 |
Top |
Related drugs of malignant transformation related genes |
| Identification of chemicals and drugs interact with genes involved in malignant transfromation |
| (DGIdb 4.0) |
| Entrez ID | Symbol | Category | Interaction Types | Drug Claim Name | Drug Name | PMIDs |
| Page: 1 |

Copyright 2023-Present -The University of Texas Health Science Center at Houston |