
|
|||||
|
 | |
| |
| |
| |
| |
| |
|
Gene: NMNAT1 |
Gene summary for NMNAT1 |
| Gene information | Species | Human | Gene symbol | NMNAT1 | Gene ID | 64802 |
| Gene name | nicotinamide nucleotide adenylyltransferase 1 | |
| Gene Alias | LCA9 | |
| Cytomap | 1p36.22 | |
| Gene Type | protein-coding | GO ID | GO:0000165 | UniProtAcc | A0A024R4E1 |
Top |
Malignant transformation analysis |
| Identification of the aberrant gene expression in precancerous and cancerous lesions by comparing the gene expression of stem-like cells in diseased tissues with normal stem cells |
| Entrez ID | Symbol | Replicates | Species | Organ | Tissue | Adj P-value | Log2FC | Malignancy |
| 64802 | NMNAT1 | HCC1_Meng | Human | Liver | HCC | 1.72e-02 | -4.32e-02 | 0.0246 |
| 64802 | NMNAT1 | HCC1 | Human | Liver | HCC | 2.39e-20 | 2.62e+00 | 0.5336 |
| 64802 | NMNAT1 | HCC2 | Human | Liver | HCC | 2.19e-32 | 3.40e+00 | 0.5341 |
| 64802 | NMNAT1 | HCC5 | Human | Liver | HCC | 5.06e-34 | 2.43e+00 | 0.4932 |
| Page: 1 |
| Tissue | Expression Dynamics | Abbreviation |
| Liver | 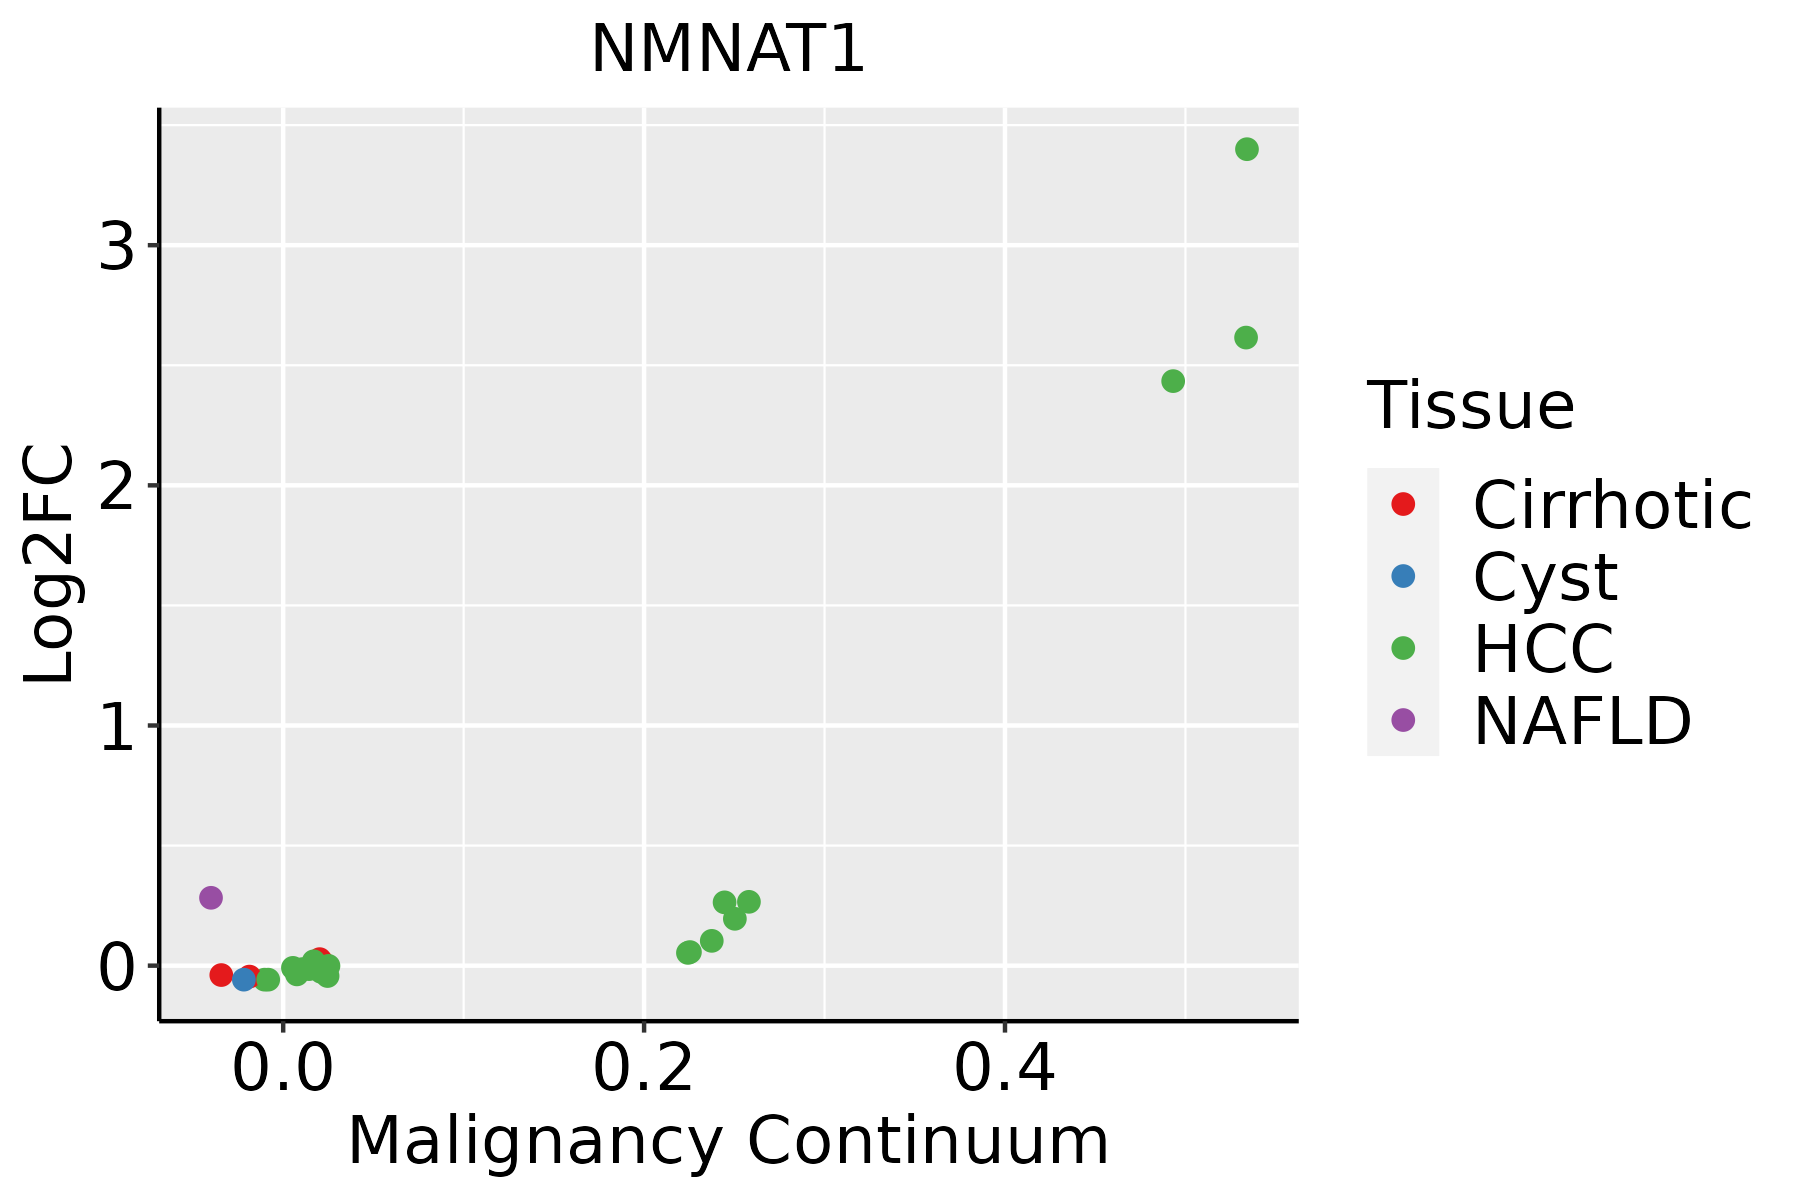 | HCC: Hepatocellular carcinoma |
| NAFLD: Non-alcoholic fatty liver disease |
| ∗log2FC in expression of this searched gene in stem-like cells from each diseased tissue sample relative to stem-like cells in normal samples in each tissue plotted against the malignancy continuum. Samples are colored based on if they are from different disease stage. |
Top |
Malignant transformation related pathway analysis |
| Find out the enriched GO biological processes and KEGG pathways involved in transition from healthy to precancer to cancer |
| Tissue | Disease Stage | Enriched GO biological Processes |
| Colorectum | AD |  |
| Colorectum | SER |  |
| Colorectum | MSS |  |
| Colorectum | MSI-H |  |
| Colorectum | FAP |  |
| ∗Top 15 enriched GO BP terms are showed in the bar plot of each disease state in each tissue. Each row represents a significant GO biological process which is colored according to the -log10(p.adjust). |
| Page: 1 2 3 4 5 6 7 8 9 |
| GO ID | Tissue | Disease Stage | Description | Gene Ratio | Bg Ratio | pvalue | p.adjust | Count |
| GO:004427021 | Liver | HCC | cellular nitrogen compound catabolic process | 303/7958 | 451/18723 | 9.76e-27 | 3.64e-24 | 303 |
| GO:004670021 | Liver | HCC | heterocycle catabolic process | 299/7958 | 445/18723 | 2.07e-26 | 7.29e-24 | 299 |
| GO:190136121 | Liver | HCC | organic cyclic compound catabolic process | 325/7958 | 495/18723 | 6.52e-26 | 2.18e-23 | 325 |
| GO:001943921 | Liver | HCC | aromatic compound catabolic process | 309/7958 | 467/18723 | 1.56e-25 | 4.94e-23 | 309 |
| GO:003465521 | Liver | HCC | nucleobase-containing compound catabolic process | 273/7958 | 407/18723 | 4.84e-24 | 1.23e-21 | 273 |
| GO:004603422 | Liver | HCC | ATP metabolic process | 198/7958 | 277/18723 | 8.30e-23 | 1.55e-20 | 198 |
| GO:002241112 | Liver | HCC | cellular component disassembly | 282/7958 | 443/18723 | 1.02e-19 | 1.38e-17 | 282 |
| GO:000911722 | Liver | HCC | nucleotide metabolic process | 300/7958 | 489/18723 | 1.61e-17 | 1.71e-15 | 300 |
| GO:000675322 | Liver | HCC | nucleoside phosphate metabolic process | 304/7958 | 497/18723 | 1.78e-17 | 1.85e-15 | 304 |
| GO:000989522 | Liver | HCC | negative regulation of catabolic process | 196/7958 | 320/18723 | 7.98e-12 | 3.35e-10 | 196 |
| GO:003133022 | Liver | HCC | negative regulation of cellular catabolic process | 164/7958 | 262/18723 | 3.52e-11 | 1.35e-09 | 164 |
| GO:000916512 | Liver | HCC | nucleotide biosynthetic process | 150/7958 | 254/18723 | 6.79e-08 | 1.40e-06 | 150 |
| GO:190129312 | Liver | HCC | nucleoside phosphate biosynthetic process | 151/7958 | 256/18723 | 6.84e-08 | 1.41e-06 | 151 |
| GO:007099722 | Liver | HCC | neuron death | 202/7958 | 361/18723 | 1.44e-07 | 2.70e-06 | 202 |
| GO:0090305 | Liver | HCC | nucleic acid phosphodiester bond hydrolysis | 152/7958 | 261/18723 | 1.90e-07 | 3.46e-06 | 152 |
| GO:190121412 | Liver | HCC | regulation of neuron death | 179/7958 | 319/18723 | 5.65e-07 | 9.01e-06 | 179 |
| GO:005105221 | Liver | HCC | regulation of DNA metabolic process | 198/7958 | 359/18723 | 7.62e-07 | 1.17e-05 | 198 |
| GO:005140212 | Liver | HCC | neuron apoptotic process | 135/7958 | 246/18723 | 5.64e-05 | 5.26e-04 | 135 |
| GO:004352312 | Liver | HCC | regulation of neuron apoptotic process | 117/7958 | 212/18723 | 1.25e-04 | 1.03e-03 | 117 |
| GO:190121512 | Liver | HCC | negative regulation of neuron death | 113/7958 | 208/18723 | 3.68e-04 | 2.54e-03 | 113 |
| Page: 1 2 |
| Pathway ID | Tissue | Disease Stage | Description | Gene Ratio | Bg Ratio | pvalue | p.adjust | qvalue | Count |
| hsa012402 | Liver | HCC | Biosynthesis of cofactors | 103/4020 | 153/8465 | 4.67e-07 | 5.05e-06 | 2.81e-06 | 103 |
| hsa012403 | Liver | HCC | Biosynthesis of cofactors | 103/4020 | 153/8465 | 4.67e-07 | 5.05e-06 | 2.81e-06 | 103 |
| Page: 1 |
Top |
Cell-cell communication analysis |
| Identification of potential cell-cell interactions between two cell types and their ligand-receptor pairs for different disease states |
| Ligand | Receptor | LRpair | Pathway | Tissue | Disease Stage |
| Page: 1 |
Top |
Single-cell gene regulatory network inference analysis |
| Find out the significant the regulons (TFs) and the target genes of each regulon across cell types for different disease states |
| TF | Cell Type | Tissue | Disease Stage | Target Gene | RSS | Regulon Activity |
| ∗The dot plots of a searched regulon are shown for all cell subpopulations in each disease state of each tissue based on the regulon specific score inferred using pySCENIC and by calculating the average expression. |
| Page: 1 |
Top |
Somatic mutation of malignant transformation related genes |
| Annotation of somatic variants for genes involved in malignant transformation |
| Hugo Symbol | Variant Class | Variant Classification | dbSNP RS | HGVSc | HGVSp | HGVSp Short | SWISSPROT | BIOTYPE | SIFT | PolyPhen | Tumor Sample Barcode | Tissue | Histology | Sex | Age | Stage | Therapy Types | Drugs | Outcome |
| NMNAT1 | SNV | Missense_Mutation | c.750N>T | p.Lys250Asn | p.K250N | Q9HAN9 | protein_coding | tolerated(0.16) | benign(0.025) | TCGA-A8-A06X-01 | Breast | breast invasive carcinoma | Female | >=65 | I/II | Unknown | Unknown | SD | |
| NMNAT1 | SNV | Missense_Mutation | c.409N>G | p.Gln137Glu | p.Q137E | Q9HAN9 | protein_coding | tolerated(0.88) | benign(0) | TCGA-D8-A27G-01 | Breast | breast invasive carcinoma | Female | >=65 | I/II | Unknown | Unknown | SD | |
| NMNAT1 | SNV | Missense_Mutation | novel | c.110G>T | p.Gly37Val | p.G37V | Q9HAN9 | protein_coding | tolerated(0.22) | benign(0.345) | TCGA-LL-A73Y-01 | Breast | breast invasive carcinoma | Female | >=65 | I/II | Chemotherapy | taxotere | SD |
| NMNAT1 | insertion | Frame_Shift_Ins | novel | c.713_714insTGCCCAGGCTGGAGTGCAATGGCACAATCTCGGCTTACTGCAAC | p.Leu239AlafsTer62 | p.L239Afs*62 | Q9HAN9 | protein_coding | TCGA-A8-A09K-01 | Breast | breast invasive carcinoma | Female | >=65 | I/II | Unknown | Unknown | SD | ||
| NMNAT1 | insertion | Frame_Shift_Ins | novel | c.329_330insG | p.Asp110GlufsTer3 | p.D110Efs*3 | Q9HAN9 | protein_coding | TCGA-B6-A0I8-01 | Breast | breast invasive carcinoma | Female | <65 | I/II | Unknown | Unknown | PD | ||
| NMNAT1 | insertion | Frame_Shift_Ins | novel | c.330_331insGCAATCA | p.Cys111AlafsTer4 | p.C111Afs*4 | Q9HAN9 | protein_coding | TCGA-B6-A0I8-01 | Breast | breast invasive carcinoma | Female | <65 | I/II | Unknown | Unknown | PD | ||
| NMNAT1 | SNV | Missense_Mutation | novel | c.377N>C | p.Lys126Thr | p.K126T | Q9HAN9 | protein_coding | tolerated(0.13) | possibly_damaging(0.662) | TCGA-A6-3808-01 | Colorectum | colon adenocarcinoma | Male | >=65 | I/II | Unknown | Unknown | SD |
| NMNAT1 | SNV | Missense_Mutation | rs375110174 | c.709N>T | p.Arg237Cys | p.R237C | Q9HAN9 | protein_coding | deleterious(0) | probably_damaging(0.912) | TCGA-AA-3984-01 | Colorectum | colon adenocarcinoma | Female | <65 | I/II | Unknown | Unknown | SD |
| NMNAT1 | SNV | Missense_Mutation | c.225G>T | p.Lys75Asn | p.K75N | Q9HAN9 | protein_coding | deleterious(0.04) | benign(0.015) | TCGA-AA-A00N-01 | Colorectum | colon adenocarcinoma | Male | >=65 | I/II | Unknown | Unknown | PD | |
| NMNAT1 | SNV | Missense_Mutation | novel | c.170A>G | p.Lys57Arg | p.K57R | Q9HAN9 | protein_coding | deleterious(0) | probably_damaging(0.997) | TCGA-AA-A02J-01 | Colorectum | colon adenocarcinoma | Female | >=65 | III/IV | Unknown | Unknown | PD |
| Page: 1 2 3 4 |
Top |
Related drugs of malignant transformation related genes |
| Identification of chemicals and drugs interact with genes involved in malignant transfromation |
| (DGIdb 4.0) |
| Entrez ID | Symbol | Category | Interaction Types | Drug Claim Name | Drug Name | PMIDs |
| Page: 1 |

Copyright 2023-Present -The University of Texas Health Science Center at Houston |