
|
|||||
|
 | |
| |
| |
| |
| |
| |
|
Gene: NMI |
Gene summary for NMI |
| Gene information | Species | Human | Gene symbol | NMI | Gene ID | 9111 |
| Gene name | N-myc and STAT interactor | |
| Gene Alias | NMI | |
| Cytomap | 2q23.3 | |
| Gene Type | protein-coding | GO ID | GO:0000209 | UniProtAcc | Q13287 |
Top |
Malignant transformation analysis |
| Identification of the aberrant gene expression in precancerous and cancerous lesions by comparing the gene expression of stem-like cells in diseased tissues with normal stem cells |
| Entrez ID | Symbol | Replicates | Species | Organ | Tissue | Adj P-value | Log2FC | Malignancy |
| 9111 | NMI | LZE4T | Human | Esophagus | ESCC | 4.33e-12 | 3.69e-01 | 0.0811 |
| 9111 | NMI | LZE7T | Human | Esophagus | ESCC | 3.54e-03 | 2.29e-01 | 0.0667 |
| 9111 | NMI | LZE8T | Human | Esophagus | ESCC | 1.49e-16 | 5.13e-01 | 0.067 |
| 9111 | NMI | LZE20T | Human | Esophagus | ESCC | 9.92e-09 | 2.57e-01 | 0.0662 |
| 9111 | NMI | LZE22T | Human | Esophagus | ESCC | 5.47e-04 | 2.81e-01 | 0.068 |
| 9111 | NMI | LZE24T | Human | Esophagus | ESCC | 5.55e-37 | 1.03e+00 | 0.0596 |
| 9111 | NMI | LZE21T | Human | Esophagus | ESCC | 3.47e-06 | 2.89e-01 | 0.0655 |
| 9111 | NMI | LZE6T | Human | Esophagus | ESCC | 1.08e-06 | 3.56e-01 | 0.0845 |
| 9111 | NMI | P1T-E | Human | Esophagus | ESCC | 3.95e-09 | 4.86e-01 | 0.0875 |
| 9111 | NMI | P2T-E | Human | Esophagus | ESCC | 1.33e-42 | 7.39e-01 | 0.1177 |
| 9111 | NMI | P4T-E | Human | Esophagus | ESCC | 3.16e-29 | 5.55e-01 | 0.1323 |
| 9111 | NMI | P5T-E | Human | Esophagus | ESCC | 5.81e-30 | 5.41e-01 | 0.1327 |
| 9111 | NMI | P8T-E | Human | Esophagus | ESCC | 1.51e-42 | 7.51e-01 | 0.0889 |
| 9111 | NMI | P9T-E | Human | Esophagus | ESCC | 3.54e-26 | 5.08e-01 | 0.1131 |
| 9111 | NMI | P10T-E | Human | Esophagus | ESCC | 1.75e-05 | 1.42e-01 | 0.116 |
| 9111 | NMI | P11T-E | Human | Esophagus | ESCC | 1.15e-33 | 1.11e+00 | 0.1426 |
| 9111 | NMI | P12T-E | Human | Esophagus | ESCC | 1.23e-29 | 5.18e-01 | 0.1122 |
| 9111 | NMI | P15T-E | Human | Esophagus | ESCC | 3.73e-25 | 5.28e-01 | 0.1149 |
| 9111 | NMI | P16T-E | Human | Esophagus | ESCC | 9.21e-17 | 2.88e-01 | 0.1153 |
| 9111 | NMI | P17T-E | Human | Esophagus | ESCC | 9.99e-17 | 5.79e-01 | 0.1278 |
| Page: 1 2 3 4 5 6 |
| Tissue | Expression Dynamics | Abbreviation |
| Esophagus |  | ESCC: Esophageal squamous cell carcinoma |
| HGIN: High-grade intraepithelial neoplasias | ||
| LGIN: Low-grade intraepithelial neoplasias | ||
| Liver | 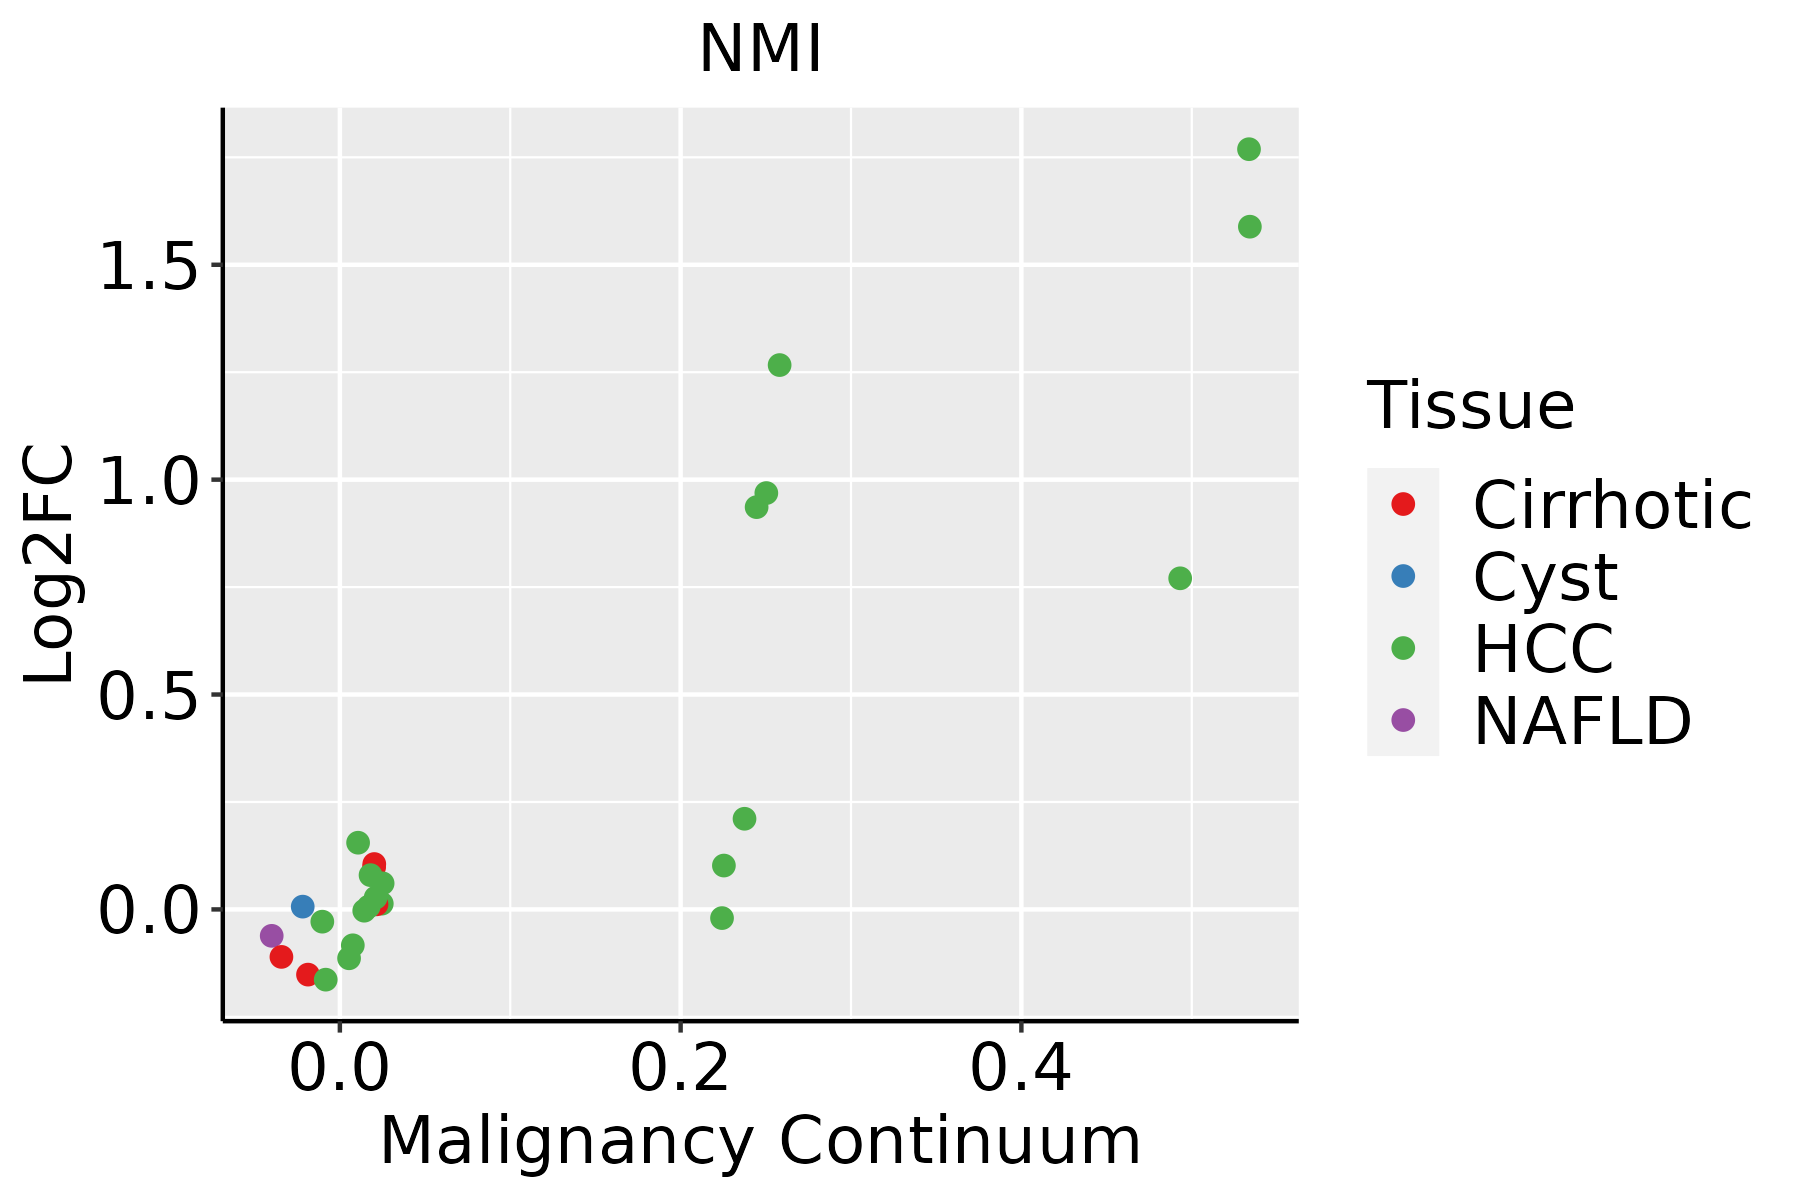 | HCC: Hepatocellular carcinoma |
| NAFLD: Non-alcoholic fatty liver disease | ||
| Oral Cavity |  | EOLP: Erosive Oral lichen planus |
| LP: leukoplakia | ||
| NEOLP: Non-erosive oral lichen planus | ||
| OSCC: Oral squamous cell carcinoma | ||
| Skin | 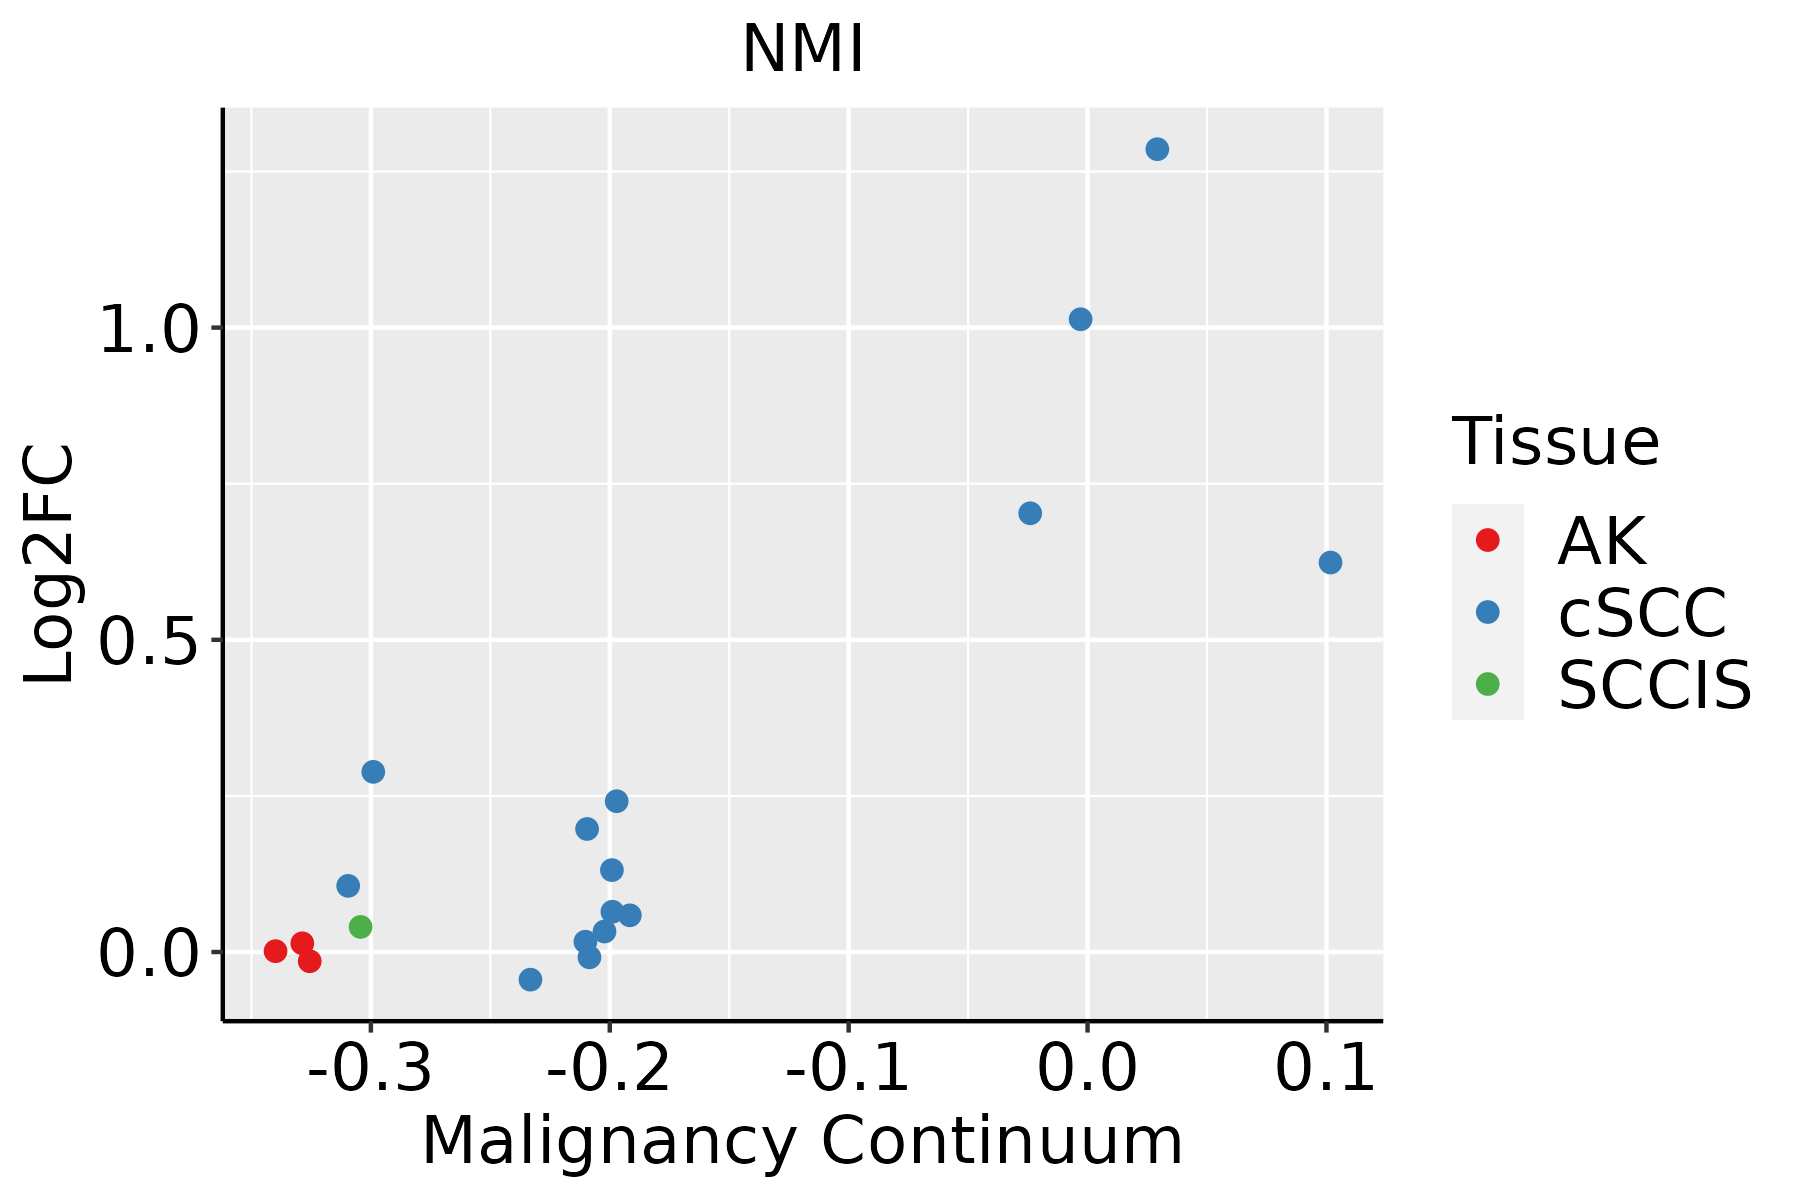 | AK: Actinic keratosis |
| cSCC: Cutaneous squamous cell carcinoma | ||
| SCCIS:squamous cell carcinoma in situ | ||
| Thyroid |  | ATC: Anaplastic thyroid cancer |
| HT: Hashimoto's thyroiditis | ||
| PTC: Papillary thyroid cancer |
| ∗log2FC in expression of this searched gene in stem-like cells from each diseased tissue sample relative to stem-like cells in normal samples in each tissue plotted against the malignancy continuum. Samples are colored based on if they are from different disease stage. |
Top |
Malignant transformation related pathway analysis |
| Find out the enriched GO biological processes and KEGG pathways involved in transition from healthy to precancer to cancer |
| Tissue | Disease Stage | Enriched GO biological Processes |
| Colorectum | AD |  |
| Colorectum | SER |  |
| Colorectum | MSS |  |
| Colorectum | MSI-H |  |
| Colorectum | FAP |  |
| ∗Top 15 enriched GO BP terms are showed in the bar plot of each disease state in each tissue. Each row represents a significant GO biological process which is colored according to the -log10(p.adjust). |
| Page: 1 2 3 4 5 6 7 8 9 |
| GO ID | Tissue | Disease Stage | Description | Gene Ratio | Bg Ratio | pvalue | p.adjust | Count |
| GO:1903320111 | Esophagus | ESCC | regulation of protein modification by small protein conjugation or removal | 181/8552 | 242/18723 | 1.80e-20 | 2.60e-18 | 181 |
| GO:000020917 | Esophagus | ESCC | protein polyubiquitination | 170/8552 | 236/18723 | 1.40e-16 | 1.09e-14 | 170 |
| GO:0031396111 | Esophagus | ESCC | regulation of protein ubiquitination | 154/8552 | 210/18723 | 2.70e-16 | 2.04e-14 | 154 |
| GO:000961518 | Esophagus | ESCC | response to virus | 238/8552 | 367/18723 | 6.65e-14 | 3.32e-12 | 238 |
| GO:007093617 | Esophagus | ESCC | protein K48-linked ubiquitination | 55/8552 | 65/18723 | 8.42e-11 | 2.58e-09 | 55 |
| GO:190332216 | Esophagus | ESCC | positive regulation of protein modification by small protein conjugation or removal | 99/8552 | 138/18723 | 4.39e-10 | 1.16e-08 | 99 |
| GO:003139816 | Esophagus | ESCC | positive regulation of protein ubiquitination | 82/8552 | 119/18723 | 2.41e-07 | 3.64e-06 | 82 |
| GO:00028318 | Esophagus | ESCC | regulation of response to biotic stimulus | 191/8552 | 327/18723 | 2.12e-06 | 2.45e-05 | 191 |
| GO:000283212 | Esophagus | ESCC | negative regulation of response to biotic stimulus | 72/8552 | 108/18723 | 8.36e-06 | 8.11e-05 | 72 |
| GO:00326084 | Esophagus | ESCC | interferon-beta production | 40/8552 | 56/18723 | 8.36e-05 | 6.08e-04 | 40 |
| GO:00326484 | Esophagus | ESCC | regulation of interferon-beta production | 40/8552 | 56/18723 | 8.36e-05 | 6.08e-04 | 40 |
| GO:00603336 | Esophagus | ESCC | interferon-gamma-mediated signaling pathway | 22/8552 | 27/18723 | 1.49e-04 | 9.92e-04 | 22 |
| GO:00343418 | Esophagus | ESCC | response to interferon-gamma | 86/8552 | 141/18723 | 1.74e-04 | 1.14e-03 | 86 |
| GO:003247912 | Esophagus | ESCC | regulation of type I interferon production | 61/8552 | 95/18723 | 2.05e-04 | 1.29e-03 | 61 |
| GO:003260612 | Esophagus | ESCC | type I interferon production | 61/8552 | 95/18723 | 2.05e-04 | 1.29e-03 | 61 |
| GO:00450885 | Esophagus | ESCC | regulation of innate immune response | 125/8552 | 218/18723 | 3.34e-04 | 1.96e-03 | 125 |
| GO:00507775 | Esophagus | ESCC | negative regulation of immune response | 112/8552 | 194/18723 | 4.67e-04 | 2.62e-03 | 112 |
| GO:000268316 | Esophagus | ESCC | negative regulation of immune system process | 231/8552 | 434/18723 | 8.48e-04 | 4.36e-03 | 231 |
| GO:190122414 | Esophagus | ESCC | positive regulation of NIK/NF-kappaB signaling | 44/8552 | 69/18723 | 1.86e-03 | 8.42e-03 | 44 |
| GO:00458245 | Esophagus | ESCC | negative regulation of innate immune response | 45/8552 | 71/18723 | 1.98e-03 | 8.90e-03 | 45 |
| Page: 1 2 3 4 5 6 7 8 9 |
| Pathway ID | Tissue | Disease Stage | Description | Gene Ratio | Bg Ratio | pvalue | p.adjust | qvalue | Count |
| Page: 1 |
Top |
Cell-cell communication analysis |
| Identification of potential cell-cell interactions between two cell types and their ligand-receptor pairs for different disease states |
| Ligand | Receptor | LRpair | Pathway | Tissue | Disease Stage |
| Page: 1 |
Top |
Single-cell gene regulatory network inference analysis |
| Find out the significant the regulons (TFs) and the target genes of each regulon across cell types for different disease states |
| TF | Cell Type | Tissue | Disease Stage | Target Gene | RSS | Regulon Activity |
| ∗The dot plots of a searched regulon are shown for all cell subpopulations in each disease state of each tissue based on the regulon specific score inferred using pySCENIC and by calculating the average expression. |
| Page: 1 |
Top |
Somatic mutation of malignant transformation related genes |
| Annotation of somatic variants for genes involved in malignant transformation |
| Hugo Symbol | Variant Class | Variant Classification | dbSNP RS | HGVSc | HGVSp | HGVSp Short | SWISSPROT | BIOTYPE | SIFT | PolyPhen | Tumor Sample Barcode | Tissue | Histology | Sex | Age | Stage | Therapy Types | Drugs | Outcome |
| NMI | SNV | Missense_Mutation | c.19N>A | p.Asp7Asn | p.D7N | Q13287 | protein_coding | tolerated(1) | benign(0) | TCGA-AC-A23H-01 | Breast | breast invasive carcinoma | Female | >=65 | I/II | Unknown | Unknown | PD | |
| NMI | SNV | Missense_Mutation | novel | c.645N>T | p.Lys215Asn | p.K215N | Q13287 | protein_coding | tolerated(0.61) | benign(0.018) | TCGA-AN-A046-01 | Breast | breast invasive carcinoma | Female | >=65 | I/II | Unknown | Unknown | SD |
| NMI | SNV | Missense_Mutation | novel | c.571N>A | p.Val191Met | p.V191M | Q13287 | protein_coding | deleterious(0) | probably_damaging(0.999) | TCGA-BH-A0HF-01 | Breast | breast invasive carcinoma | Female | >=65 | I/II | Hormone Therapy | arimidex | SD |
| NMI | SNV | Missense_Mutation | c.10N>C | p.Asp4His | p.D4H | Q13287 | protein_coding | deleterious_low_confidence(0.01) | benign(0.358) | TCGA-E9-A1R5-01 | Breast | breast invasive carcinoma | Female | <65 | I/II | Hormone Therapy | tamoxiphen | SD | |
| NMI | SNV | Missense_Mutation | c.457G>C | p.Glu153Gln | p.E153Q | Q13287 | protein_coding | tolerated(0.39) | benign(0.019) | TCGA-EK-A2H0-01 | Cervix | cervical & endocervical cancer | Female | <65 | I/II | Chemotherapy | cisplatin | CR | |
| NMI | SNV | Missense_Mutation | c.457N>C | p.Glu153Gln | p.E153Q | Q13287 | protein_coding | tolerated(0.39) | benign(0.019) | TCGA-ZJ-A8QQ-01 | Cervix | cervical & endocervical cancer | Female | <65 | I/II | Chemotherapy | cisplatin | SD | |
| NMI | SNV | Missense_Mutation | c.215N>C | p.Leu72Ser | p.L72S | Q13287 | protein_coding | tolerated(0.14) | benign(0) | TCGA-A6-2679-01 | Colorectum | colon adenocarcinoma | Female | >=65 | I/II | Unknown | Unknown | SD | |
| NMI | SNV | Missense_Mutation | rs530144789 | c.505N>T | p.Arg169Cys | p.R169C | Q13287 | protein_coding | deleterious(0) | benign(0.055) | TCGA-AA-3821-01 | Colorectum | colon adenocarcinoma | Female | >=65 | I/II | Unknown | Unknown | SD |
| NMI | SNV | Missense_Mutation | c.109N>C | p.Asn37His | p.N37H | Q13287 | protein_coding | deleterious(0) | probably_damaging(0.996) | TCGA-CA-6718-01 | Colorectum | colon adenocarcinoma | Male | <65 | I/II | Unknown | Unknown | PD | |
| NMI | SNV | Missense_Mutation | novel | c.852N>T | p.Lys284Asn | p.K284N | Q13287 | protein_coding | tolerated(0.16) | benign(0.01) | TCGA-AG-A002-01 | Colorectum | rectum adenocarcinoma | Male | <65 | I/II | Unknown | Unknown | SD |
| Page: 1 2 3 |
Top |
Related drugs of malignant transformation related genes |
| Identification of chemicals and drugs interact with genes involved in malignant transfromation |
| (DGIdb 4.0) |
| Entrez ID | Symbol | Category | Interaction Types | Drug Claim Name | Drug Name | PMIDs |
| Page: 1 |

Copyright 2023-Present -The University of Texas Health Science Center at Houston |