
|
|||||
|
 | |
| |
| |
| |
| |
| |
|
Gene: NME7 |
Gene summary for NME7 |
| Gene information | Species | Human | Gene symbol | NME7 | Gene ID | 29922 |
| Gene name | NME/NM23 family member 7 | |
| Gene Alias | CFAP67 | |
| Cytomap | 1q24.2 | |
| Gene Type | protein-coding | GO ID | GO:0006139 | UniProtAcc | Q9Y5B8 |
Top |
Malignant transformation analysis |
| Identification of the aberrant gene expression in precancerous and cancerous lesions by comparing the gene expression of stem-like cells in diseased tissues with normal stem cells |
| Entrez ID | Symbol | Replicates | Species | Organ | Tissue | Adj P-value | Log2FC | Malignancy |
| 29922 | NME7 | LZE4T | Human | Esophagus | ESCC | 5.29e-04 | 1.48e-01 | 0.0811 |
| 29922 | NME7 | LZE7T | Human | Esophagus | ESCC | 2.10e-03 | 1.66e-01 | 0.0667 |
| 29922 | NME7 | LZE8T | Human | Esophagus | ESCC | 4.60e-02 | 5.63e-02 | 0.067 |
| 29922 | NME7 | LZE22T | Human | Esophagus | ESCC | 5.28e-03 | 1.87e-01 | 0.068 |
| 29922 | NME7 | LZE24T | Human | Esophagus | ESCC | 5.84e-10 | 3.44e-01 | 0.0596 |
| 29922 | NME7 | LZE6T | Human | Esophagus | ESCC | 4.02e-11 | 2.89e-01 | 0.0845 |
| 29922 | NME7 | P1T-E | Human | Esophagus | ESCC | 2.01e-02 | 1.38e-01 | 0.0875 |
| 29922 | NME7 | P2T-E | Human | Esophagus | ESCC | 1.25e-26 | 3.68e-01 | 0.1177 |
| 29922 | NME7 | P4T-E | Human | Esophagus | ESCC | 3.05e-30 | 5.30e-01 | 0.1323 |
| 29922 | NME7 | P5T-E | Human | Esophagus | ESCC | 3.93e-13 | 1.51e-01 | 0.1327 |
| 29922 | NME7 | P8T-E | Human | Esophagus | ESCC | 1.19e-21 | 3.36e-01 | 0.0889 |
| 29922 | NME7 | P9T-E | Human | Esophagus | ESCC | 2.38e-12 | 7.72e-02 | 0.1131 |
| 29922 | NME7 | P10T-E | Human | Esophagus | ESCC | 1.33e-24 | 4.34e-01 | 0.116 |
| 29922 | NME7 | P11T-E | Human | Esophagus | ESCC | 1.99e-13 | 3.76e-01 | 0.1426 |
| 29922 | NME7 | P12T-E | Human | Esophagus | ESCC | 2.33e-11 | 1.98e-01 | 0.1122 |
| 29922 | NME7 | P15T-E | Human | Esophagus | ESCC | 3.36e-16 | 2.76e-01 | 0.1149 |
| 29922 | NME7 | P16T-E | Human | Esophagus | ESCC | 1.88e-22 | 3.54e-01 | 0.1153 |
| 29922 | NME7 | P17T-E | Human | Esophagus | ESCC | 9.24e-08 | 2.35e-01 | 0.1278 |
| 29922 | NME7 | P19T-E | Human | Esophagus | ESCC | 1.80e-09 | 5.58e-01 | 0.1662 |
| 29922 | NME7 | P20T-E | Human | Esophagus | ESCC | 2.34e-19 | 2.43e-01 | 0.1124 |
| Page: 1 2 3 4 5 |
| Tissue | Expression Dynamics | Abbreviation |
| Esophagus |  | ESCC: Esophageal squamous cell carcinoma |
| HGIN: High-grade intraepithelial neoplasias | ||
| LGIN: Low-grade intraepithelial neoplasias | ||
| Lung |  | AAH: Atypical adenomatous hyperplasia |
| AIS: Adenocarcinoma in situ | ||
| IAC: Invasive lung adenocarcinoma | ||
| MIA: Minimally invasive adenocarcinoma | ||
| Oral Cavity | 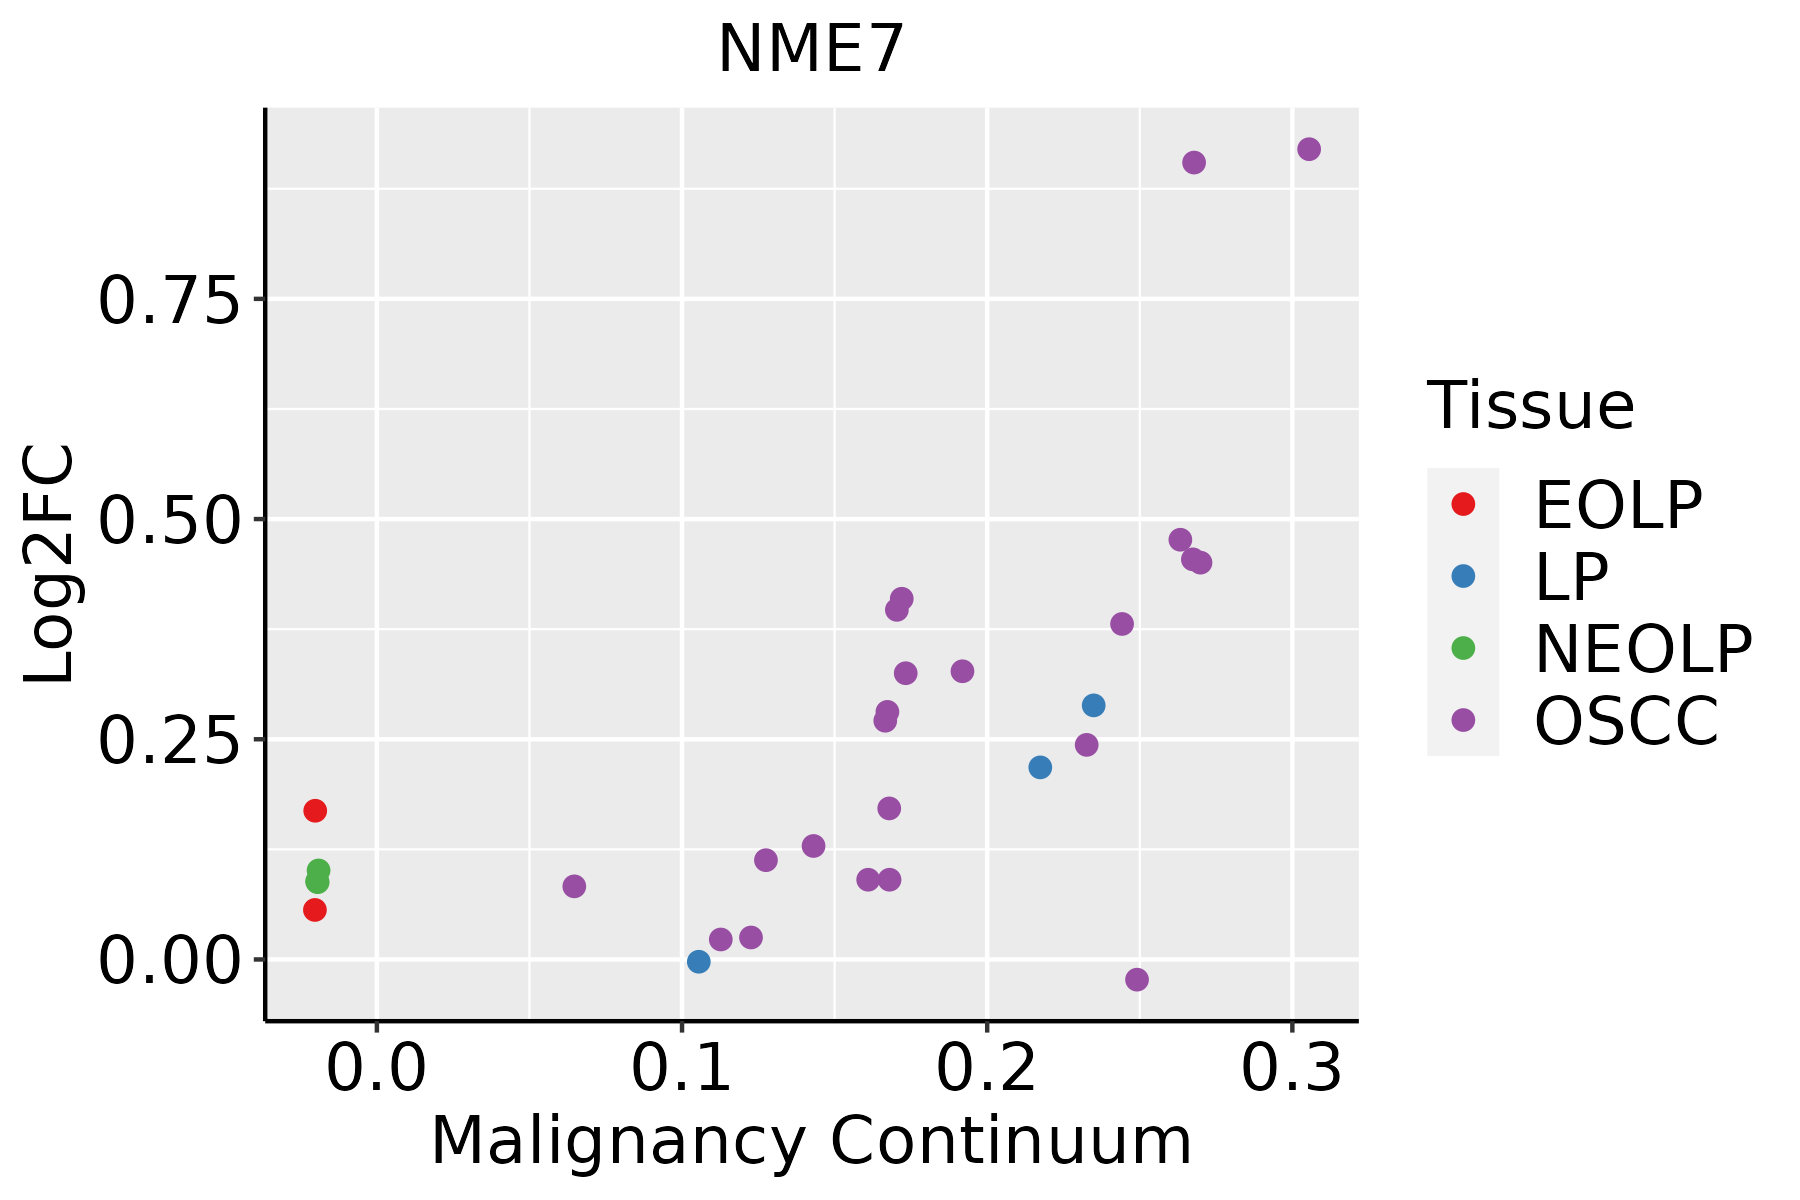 | EOLP: Erosive Oral lichen planus |
| LP: leukoplakia | ||
| NEOLP: Non-erosive oral lichen planus | ||
| OSCC: Oral squamous cell carcinoma | ||
| Skin | 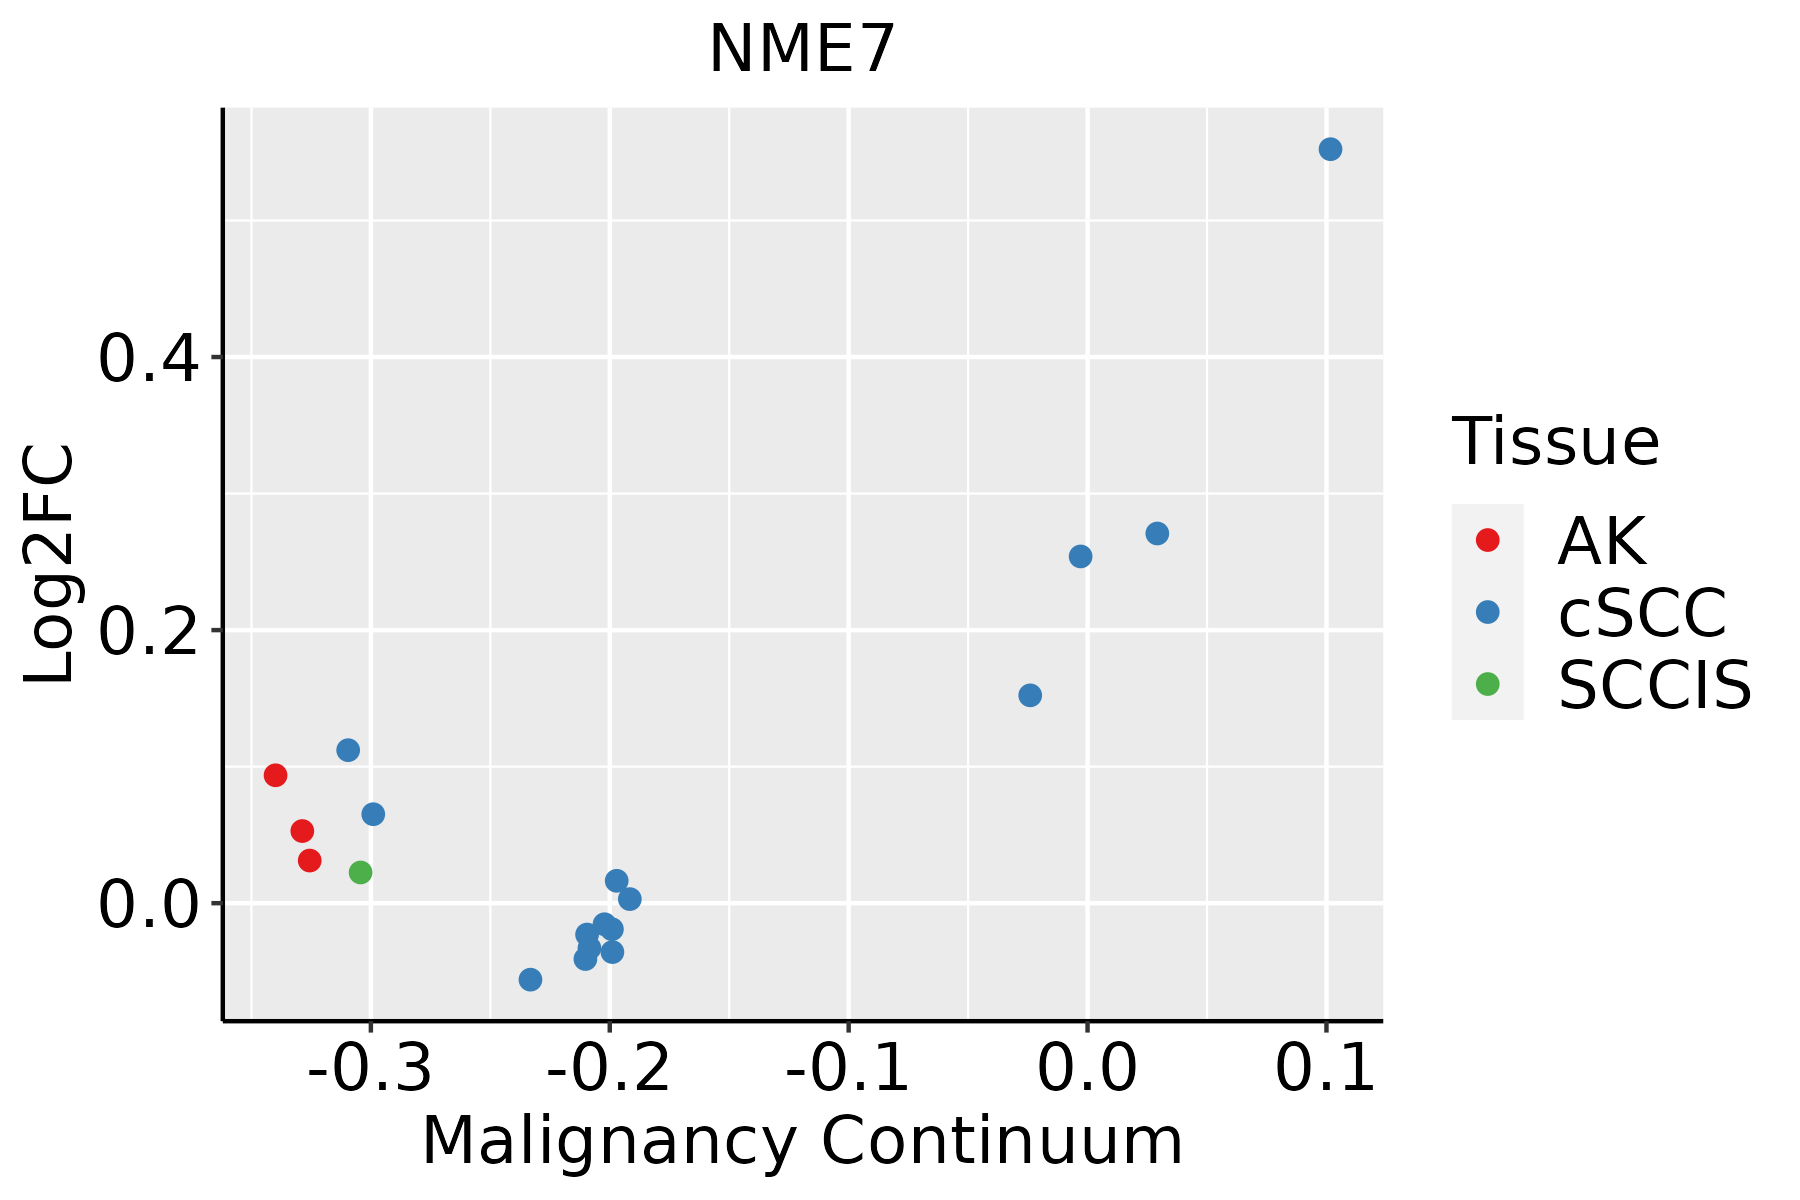 | AK: Actinic keratosis |
| cSCC: Cutaneous squamous cell carcinoma | ||
| SCCIS:squamous cell carcinoma in situ |
| ∗log2FC in expression of this searched gene in stem-like cells from each diseased tissue sample relative to stem-like cells in normal samples in each tissue plotted against the malignancy continuum. Samples are colored based on if they are from different disease stage. |
Top |
Malignant transformation related pathway analysis |
| Find out the enriched GO biological processes and KEGG pathways involved in transition from healthy to precancer to cancer |
| Tissue | Disease Stage | Enriched GO biological Processes |
| Colorectum | AD |  |
| Colorectum | SER |  |
| Colorectum | MSS |  |
| Colorectum | MSI-H |  |
| Colorectum | FAP |  |
| ∗Top 15 enriched GO BP terms are showed in the bar plot of each disease state in each tissue. Each row represents a significant GO biological process which is colored according to the -log10(p.adjust). |
| Page: 1 2 3 4 5 6 7 8 9 |
| GO ID | Tissue | Disease Stage | Description | Gene Ratio | Bg Ratio | pvalue | p.adjust | Count |
| GO:0006753110 | Esophagus | ESCC | nucleoside phosphate metabolic process | 288/8552 | 497/18723 | 1.80e-08 | 3.50e-07 | 288 |
| GO:0019693111 | Esophagus | ESCC | ribose phosphate metabolic process | 234/8552 | 396/18723 | 4.24e-08 | 7.76e-07 | 234 |
| GO:0009117111 | Esophagus | ESCC | nucleotide metabolic process | 282/8552 | 489/18723 | 4.70e-08 | 8.50e-07 | 282 |
| GO:0009141111 | Esophagus | ESCC | nucleoside triphosphate metabolic process | 78/8552 | 112/18723 | 2.36e-07 | 3.59e-06 | 78 |
| GO:0009259111 | Esophagus | ESCC | ribonucleotide metabolic process | 224/8552 | 385/18723 | 4.41e-07 | 6.00e-06 | 224 |
| GO:0072521111 | Esophagus | ESCC | purine-containing compound metabolic process | 238/8552 | 416/18723 | 1.20e-06 | 1.49e-05 | 238 |
| GO:0009150111 | Esophagus | ESCC | purine ribonucleotide metabolic process | 213/8552 | 368/18723 | 1.40e-06 | 1.69e-05 | 213 |
| GO:0046390110 | Esophagus | ESCC | ribose phosphate biosynthetic process | 119/8552 | 190/18723 | 1.73e-06 | 2.06e-05 | 119 |
| GO:0006163111 | Esophagus | ESCC | purine nucleotide metabolic process | 226/8552 | 396/18723 | 2.81e-06 | 3.21e-05 | 226 |
| GO:0009144110 | Esophagus | ESCC | purine nucleoside triphosphate metabolic process | 61/8552 | 88/18723 | 6.06e-06 | 6.23e-05 | 61 |
| GO:000919918 | Esophagus | ESCC | ribonucleoside triphosphate metabolic process | 61/8552 | 89/18723 | 1.07e-05 | 1.01e-04 | 61 |
| GO:000916516 | Esophagus | ESCC | nucleotide biosynthetic process | 150/8552 | 254/18723 | 1.12e-05 | 1.06e-04 | 150 |
| GO:0009260110 | Esophagus | ESCC | ribonucleotide biosynthetic process | 112/8552 | 182/18723 | 1.12e-05 | 1.06e-04 | 112 |
| GO:190129316 | Esophagus | ESCC | nucleoside phosphate biosynthetic process | 151/8552 | 256/18723 | 1.15e-05 | 1.08e-04 | 151 |
| GO:000914219 | Esophagus | ESCC | nucleoside triphosphate biosynthetic process | 58/8552 | 85/18723 | 2.16e-05 | 1.87e-04 | 58 |
| GO:007252217 | Esophagus | ESCC | purine-containing compound biosynthetic process | 120/8552 | 200/18723 | 3.02e-05 | 2.51e-04 | 120 |
| GO:0009152110 | Esophagus | ESCC | purine ribonucleotide biosynthetic process | 103/8552 | 169/18723 | 4.40e-05 | 3.51e-04 | 103 |
| GO:000920519 | Esophagus | ESCC | purine ribonucleoside triphosphate metabolic process | 55/8552 | 82/18723 | 7.34e-05 | 5.51e-04 | 55 |
| GO:000616417 | Esophagus | ESCC | purine nucleotide biosynthetic process | 113/8552 | 191/18723 | 1.16e-04 | 8.04e-04 | 113 |
| GO:000920118 | Esophagus | ESCC | ribonucleoside triphosphate biosynthetic process | 50/8552 | 74/18723 | 1.16e-04 | 8.04e-04 | 50 |
| Page: 1 2 3 4 5 6 7 |
| Pathway ID | Tissue | Disease Stage | Description | Gene Ratio | Bg Ratio | pvalue | p.adjust | qvalue | Count |
| hsa012325 | Esophagus | ESCC | Nucleotide metabolism | 59/4205 | 85/8465 | 1.67e-04 | 6.58e-04 | 3.37e-04 | 59 |
| hsa012405 | Esophagus | ESCC | Biosynthesis of cofactors | 97/4205 | 153/8465 | 3.88e-04 | 1.35e-03 | 6.94e-04 | 97 |
| hsa002405 | Esophagus | ESCC | Pyrimidine metabolism | 41/4205 | 58/8465 | 9.14e-04 | 2.92e-03 | 1.49e-03 | 41 |
| hsa0123212 | Esophagus | ESCC | Nucleotide metabolism | 59/4205 | 85/8465 | 1.67e-04 | 6.58e-04 | 3.37e-04 | 59 |
| hsa0124012 | Esophagus | ESCC | Biosynthesis of cofactors | 97/4205 | 153/8465 | 3.88e-04 | 1.35e-03 | 6.94e-04 | 97 |
| hsa0024012 | Esophagus | ESCC | Pyrimidine metabolism | 41/4205 | 58/8465 | 9.14e-04 | 2.92e-03 | 1.49e-03 | 41 |
| hsa012324 | Oral cavity | OSCC | Nucleotide metabolism | 54/3704 | 85/8465 | 1.78e-04 | 5.95e-04 | 3.03e-04 | 54 |
| hsa012404 | Oral cavity | OSCC | Biosynthesis of cofactors | 88/3704 | 153/8465 | 3.84e-04 | 1.20e-03 | 6.12e-04 | 88 |
| hsa002404 | Oral cavity | OSCC | Pyrimidine metabolism | 37/3704 | 58/8465 | 1.62e-03 | 4.45e-03 | 2.26e-03 | 37 |
| hsa0123211 | Oral cavity | OSCC | Nucleotide metabolism | 54/3704 | 85/8465 | 1.78e-04 | 5.95e-04 | 3.03e-04 | 54 |
| hsa0124011 | Oral cavity | OSCC | Biosynthesis of cofactors | 88/3704 | 153/8465 | 3.84e-04 | 1.20e-03 | 6.12e-04 | 88 |
| hsa0024011 | Oral cavity | OSCC | Pyrimidine metabolism | 37/3704 | 58/8465 | 1.62e-03 | 4.45e-03 | 2.26e-03 | 37 |
| Page: 1 |
Top |
Cell-cell communication analysis |
| Identification of potential cell-cell interactions between two cell types and their ligand-receptor pairs for different disease states |
| Ligand | Receptor | LRpair | Pathway | Tissue | Disease Stage |
| Page: 1 |
Top |
Single-cell gene regulatory network inference analysis |
| Find out the significant the regulons (TFs) and the target genes of each regulon across cell types for different disease states |
| TF | Cell Type | Tissue | Disease Stage | Target Gene | RSS | Regulon Activity |
| ∗The dot plots of a searched regulon are shown for all cell subpopulations in each disease state of each tissue based on the regulon specific score inferred using pySCENIC and by calculating the average expression. |
| Page: 1 |
Top |
Somatic mutation of malignant transformation related genes |
| Annotation of somatic variants for genes involved in malignant transformation |
| Hugo Symbol | Variant Class | Variant Classification | dbSNP RS | HGVSc | HGVSp | HGVSp Short | SWISSPROT | BIOTYPE | SIFT | PolyPhen | Tumor Sample Barcode | Tissue | Histology | Sex | Age | Stage | Therapy Types | Drugs | Outcome |
| NME7 | SNV | Missense_Mutation | novel | c.568N>A | p.Glu190Lys | p.E190K | Q9Y5B8 | protein_coding | tolerated(0.67) | benign(0.014) | TCGA-5L-AAT1-01 | Breast | breast invasive carcinoma | Female | <65 | III/IV | Hormone Therapy | letrozol | SD |
| NME7 | SNV | Missense_Mutation | c.433N>G | p.Phe145Val | p.F145V | Q9Y5B8 | protein_coding | deleterious(0.01) | possibly_damaging(0.553) | TCGA-A8-A08J-01 | Breast | breast invasive carcinoma | Female | <65 | III/IV | Unknown | Unknown | PD | |
| NME7 | SNV | Missense_Mutation | c.1116N>C | p.Lys372Asn | p.K372N | Q9Y5B8 | protein_coding | tolerated(0.2) | benign(0.027) | TCGA-BH-A18P-01 | Breast | breast invasive carcinoma | Female | <65 | I/II | Unknown | Unknown | PD | |
| NME7 | SNV | Missense_Mutation | c.174N>C | p.Glu58Asp | p.E58D | Q9Y5B8 | protein_coding | tolerated(0.29) | benign(0.007) | TCGA-E2-A14R-01 | Breast | breast invasive carcinoma | Female | <65 | I/II | Chemotherapy | doxorubicin | PD | |
| NME7 | SNV | Missense_Mutation | c.301G>A | p.Asp101Asn | p.D101N | Q9Y5B8 | protein_coding | deleterious(0.04) | probably_damaging(0.998) | TCGA-E9-A228-01 | Breast | breast invasive carcinoma | Female | <65 | I/II | Chemotherapy | doxorubicin | SD | |
| NME7 | SNV | Missense_Mutation | c.134C>G | p.Thr45Ser | p.T45S | Q9Y5B8 | protein_coding | tolerated(0.4) | benign(0.098) | TCGA-EK-A2RK-01 | Cervix | cervical & endocervical cancer | Female | >=65 | I/II | Unknown | Unknown | SD | |
| NME7 | SNV | Missense_Mutation | rs139755731 | c.554G>A | p.Arg185His | p.R185H | Q9Y5B8 | protein_coding | deleterious(0.01) | benign(0.149) | TCGA-AA-A00N-01 | Colorectum | colon adenocarcinoma | Male | >=65 | I/II | Unknown | Unknown | PD |
| NME7 | SNV | Missense_Mutation | c.638N>A | p.Ser213Tyr | p.S213Y | Q9Y5B8 | protein_coding | deleterious(0) | possibly_damaging(0.841) | TCGA-AA-A010-01 | Colorectum | colon adenocarcinoma | Female | <65 | I/II | Chemotherapy | folinic | CR | |
| NME7 | SNV | Missense_Mutation | rs755169173 | c.67C>T | p.Arg23Cys | p.R23C | Q9Y5B8 | protein_coding | deleterious(0.02) | benign(0.055) | TCGA-AA-A022-01 | Colorectum | colon adenocarcinoma | Female | >=65 | I/II | Unknown | Unknown | SD |
| NME7 | SNV | Missense_Mutation | novel | c.274G>A | p.Glu92Lys | p.E92K | Q9Y5B8 | protein_coding | deleterious(0.03) | probably_damaging(0.98) | TCGA-AG-A002-01 | Colorectum | rectum adenocarcinoma | Male | <65 | I/II | Unknown | Unknown | SD |
| Page: 1 2 3 4 5 |
Top |
Related drugs of malignant transformation related genes |
| Identification of chemicals and drugs interact with genes involved in malignant transfromation |
| (DGIdb 4.0) |
| Entrez ID | Symbol | Category | Interaction Types | Drug Claim Name | Drug Name | PMIDs |
| Page: 1 |

Copyright 2023-Present -The University of Texas Health Science Center at Houston |