
|
|||||
|
 | |
| |
| |
| |
| |
| |
|
Gene: NME6 |
Gene summary for NME6 |
| Gene information | Species | Human | Gene symbol | NME6 | Gene ID | 10201 |
| Gene name | NME/NM23 nucleoside diphosphate kinase 6 | |
| Gene Alias | IPIA-ALPHA | |
| Cytomap | 3p21.31 | |
| Gene Type | protein-coding | GO ID | GO:0000278 | UniProtAcc | O75414 |
Top |
Malignant transformation analysis |
| Identification of the aberrant gene expression in precancerous and cancerous lesions by comparing the gene expression of stem-like cells in diseased tissues with normal stem cells |
| Entrez ID | Symbol | Replicates | Species | Organ | Tissue | Adj P-value | Log2FC | Malignancy |
| 10201 | NME6 | LZE4T | Human | Esophagus | ESCC | 2.49e-03 | 1.77e-01 | 0.0811 |
| 10201 | NME6 | LZE5T | Human | Esophagus | ESCC | 4.71e-05 | 3.10e-01 | 0.0514 |
| 10201 | NME6 | LZE7T | Human | Esophagus | ESCC | 2.62e-02 | 2.23e-01 | 0.0667 |
| 10201 | NME6 | LZE8T | Human | Esophagus | ESCC | 8.38e-03 | 1.30e-01 | 0.067 |
| 10201 | NME6 | LZE24T | Human | Esophagus | ESCC | 6.68e-10 | 2.91e-01 | 0.0596 |
| 10201 | NME6 | P1T-E | Human | Esophagus | ESCC | 2.42e-03 | 1.58e-01 | 0.0875 |
| 10201 | NME6 | P2T-E | Human | Esophagus | ESCC | 1.30e-15 | 2.58e-01 | 0.1177 |
| 10201 | NME6 | P4T-E | Human | Esophagus | ESCC | 6.44e-16 | 3.95e-01 | 0.1323 |
| 10201 | NME6 | P5T-E | Human | Esophagus | ESCC | 7.83e-09 | 1.65e-01 | 0.1327 |
| 10201 | NME6 | P8T-E | Human | Esophagus | ESCC | 8.56e-12 | 1.98e-01 | 0.0889 |
| 10201 | NME6 | P9T-E | Human | Esophagus | ESCC | 2.73e-04 | 1.56e-01 | 0.1131 |
| 10201 | NME6 | P10T-E | Human | Esophagus | ESCC | 7.98e-13 | 1.96e-01 | 0.116 |
| 10201 | NME6 | P11T-E | Human | Esophagus | ESCC | 1.39e-07 | 3.37e-01 | 0.1426 |
| 10201 | NME6 | P12T-E | Human | Esophagus | ESCC | 6.78e-13 | 3.26e-01 | 0.1122 |
| 10201 | NME6 | P15T-E | Human | Esophagus | ESCC | 5.12e-07 | 1.37e-01 | 0.1149 |
| 10201 | NME6 | P16T-E | Human | Esophagus | ESCC | 7.98e-13 | 2.38e-01 | 0.1153 |
| 10201 | NME6 | P17T-E | Human | Esophagus | ESCC | 3.93e-09 | 2.43e-01 | 0.1278 |
| 10201 | NME6 | P19T-E | Human | Esophagus | ESCC | 4.30e-03 | 2.24e-01 | 0.1662 |
| 10201 | NME6 | P20T-E | Human | Esophagus | ESCC | 2.90e-11 | 2.24e-01 | 0.1124 |
| 10201 | NME6 | P21T-E | Human | Esophagus | ESCC | 9.71e-23 | 4.40e-01 | 0.1617 |
| Page: 1 2 3 4 5 |
| Tissue | Expression Dynamics | Abbreviation |
| Esophagus | 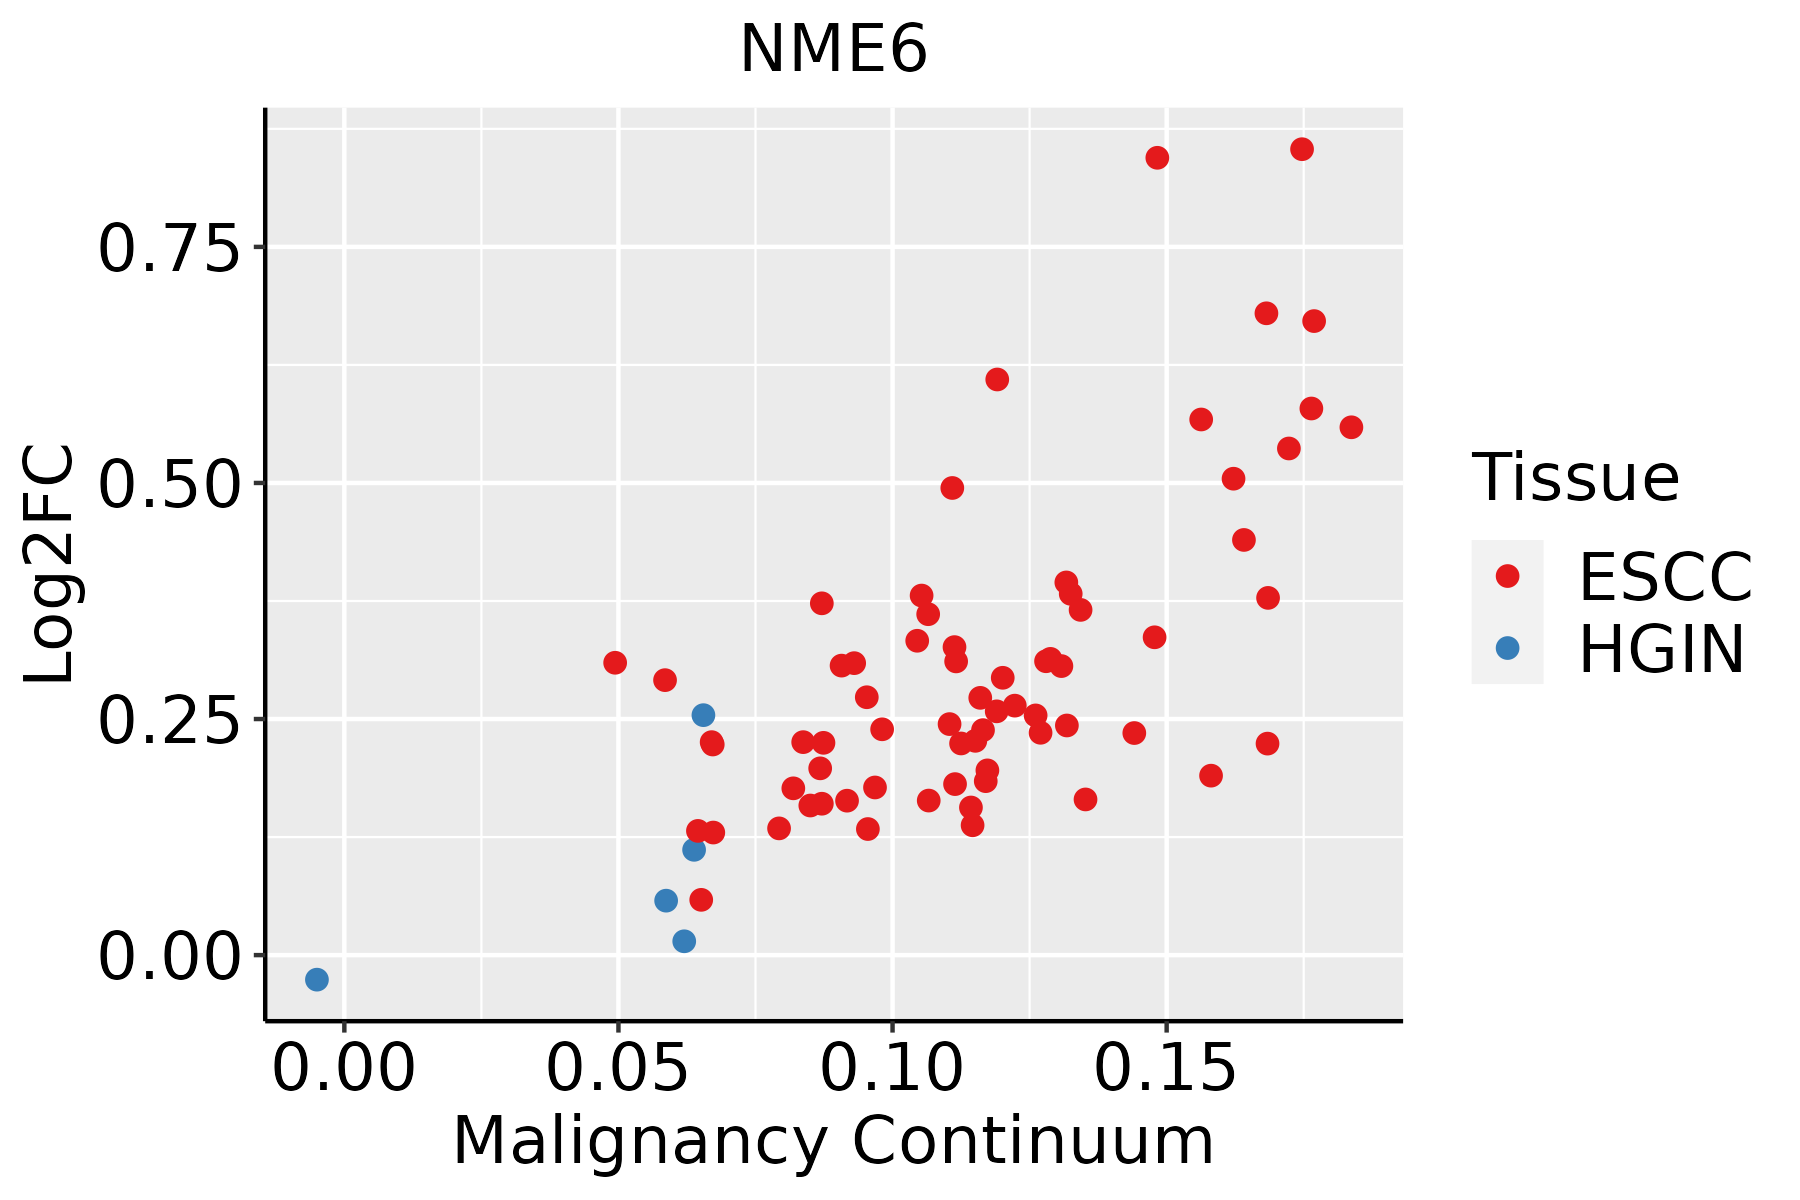 | ESCC: Esophageal squamous cell carcinoma |
| HGIN: High-grade intraepithelial neoplasias | ||
| LGIN: Low-grade intraepithelial neoplasias | ||
| Liver |  | HCC: Hepatocellular carcinoma |
| NAFLD: Non-alcoholic fatty liver disease | ||
| Oral Cavity |  | EOLP: Erosive Oral lichen planus |
| LP: leukoplakia | ||
| NEOLP: Non-erosive oral lichen planus | ||
| OSCC: Oral squamous cell carcinoma |
| ∗log2FC in expression of this searched gene in stem-like cells from each diseased tissue sample relative to stem-like cells in normal samples in each tissue plotted against the malignancy continuum. Samples are colored based on if they are from different disease stage. |
Top |
Malignant transformation related pathway analysis |
| Find out the enriched GO biological processes and KEGG pathways involved in transition from healthy to precancer to cancer |
| Tissue | Disease Stage | Enriched GO biological Processes |
| Colorectum | AD |  |
| Colorectum | SER |  |
| Colorectum | MSS |  |
| Colorectum | MSI-H |  |
| Colorectum | FAP |  |
| ∗Top 15 enriched GO BP terms are showed in the bar plot of each disease state in each tissue. Each row represents a significant GO biological process which is colored according to the -log10(p.adjust). |
| Page: 1 2 3 4 5 6 7 8 9 |
| GO ID | Tissue | Disease Stage | Description | Gene Ratio | Bg Ratio | pvalue | p.adjust | Count |
| GO:014001414 | Esophagus | ESCC | mitotic nuclear division | 218/8552 | 287/18723 | 6.17e-26 | 1.78e-23 | 218 |
| GO:000734615 | Esophagus | ESCC | regulation of mitotic cell cycle | 293/8552 | 457/18723 | 8.00e-16 | 5.64e-14 | 293 |
| GO:00482853 | Esophagus | ESCC | organelle fission | 301/8552 | 488/18723 | 4.64e-13 | 2.12e-11 | 301 |
| GO:00002802 | Esophagus | ESCC | nuclear division | 270/8552 | 439/18723 | 1.17e-11 | 4.24e-10 | 270 |
| GO:0016049110 | Esophagus | ESCC | cell growth | 289/8552 | 482/18723 | 1.29e-10 | 3.77e-09 | 289 |
| GO:00457865 | Esophagus | ESCC | negative regulation of cell cycle | 236/8552 | 385/18723 | 3.62e-10 | 9.93e-09 | 236 |
| GO:0010639110 | Esophagus | ESCC | negative regulation of organelle organization | 215/8552 | 348/18723 | 8.20e-10 | 2.01e-08 | 215 |
| GO:000155819 | Esophagus | ESCC | regulation of cell growth | 248/8552 | 414/18723 | 2.97e-09 | 6.45e-08 | 248 |
| GO:0006753110 | Esophagus | ESCC | nucleoside phosphate metabolic process | 288/8552 | 497/18723 | 1.80e-08 | 3.50e-07 | 288 |
| GO:0019693111 | Esophagus | ESCC | ribose phosphate metabolic process | 234/8552 | 396/18723 | 4.24e-08 | 7.76e-07 | 234 |
| GO:0009117111 | Esophagus | ESCC | nucleotide metabolic process | 282/8552 | 489/18723 | 4.70e-08 | 8.50e-07 | 282 |
| GO:00070883 | Esophagus | ESCC | regulation of mitotic nuclear division | 78/8552 | 110/18723 | 6.96e-08 | 1.21e-06 | 78 |
| GO:0009141111 | Esophagus | ESCC | nucleoside triphosphate metabolic process | 78/8552 | 112/18723 | 2.36e-07 | 3.59e-06 | 78 |
| GO:00109484 | Esophagus | ESCC | negative regulation of cell cycle process | 177/8552 | 294/18723 | 3.26e-07 | 4.59e-06 | 177 |
| GO:0009259111 | Esophagus | ESCC | ribonucleotide metabolic process | 224/8552 | 385/18723 | 4.41e-07 | 6.00e-06 | 224 |
| GO:0072521111 | Esophagus | ESCC | purine-containing compound metabolic process | 238/8552 | 416/18723 | 1.20e-06 | 1.49e-05 | 238 |
| GO:0009150111 | Esophagus | ESCC | purine ribonucleotide metabolic process | 213/8552 | 368/18723 | 1.40e-06 | 1.69e-05 | 213 |
| GO:0046390110 | Esophagus | ESCC | ribose phosphate biosynthetic process | 119/8552 | 190/18723 | 1.73e-06 | 2.06e-05 | 119 |
| GO:004593013 | Esophagus | ESCC | negative regulation of mitotic cell cycle | 143/8552 | 235/18723 | 1.84e-06 | 2.15e-05 | 143 |
| GO:0006163111 | Esophagus | ESCC | purine nucleotide metabolic process | 226/8552 | 396/18723 | 2.81e-06 | 3.21e-05 | 226 |
| Page: 1 2 3 4 5 6 7 8 9 |
| Pathway ID | Tissue | Disease Stage | Description | Gene Ratio | Bg Ratio | pvalue | p.adjust | qvalue | Count |
| hsa012325 | Esophagus | ESCC | Nucleotide metabolism | 59/4205 | 85/8465 | 1.67e-04 | 6.58e-04 | 3.37e-04 | 59 |
| hsa012405 | Esophagus | ESCC | Biosynthesis of cofactors | 97/4205 | 153/8465 | 3.88e-04 | 1.35e-03 | 6.94e-04 | 97 |
| hsa002405 | Esophagus | ESCC | Pyrimidine metabolism | 41/4205 | 58/8465 | 9.14e-04 | 2.92e-03 | 1.49e-03 | 41 |
| hsa0123212 | Esophagus | ESCC | Nucleotide metabolism | 59/4205 | 85/8465 | 1.67e-04 | 6.58e-04 | 3.37e-04 | 59 |
| hsa0124012 | Esophagus | ESCC | Biosynthesis of cofactors | 97/4205 | 153/8465 | 3.88e-04 | 1.35e-03 | 6.94e-04 | 97 |
| hsa0024012 | Esophagus | ESCC | Pyrimidine metabolism | 41/4205 | 58/8465 | 9.14e-04 | 2.92e-03 | 1.49e-03 | 41 |
| hsa012402 | Liver | HCC | Biosynthesis of cofactors | 103/4020 | 153/8465 | 4.67e-07 | 5.05e-06 | 2.81e-06 | 103 |
| hsa002402 | Liver | HCC | Pyrimidine metabolism | 44/4020 | 58/8465 | 9.34e-06 | 7.11e-05 | 3.95e-05 | 44 |
| hsa012322 | Liver | HCC | Nucleotide metabolism | 59/4020 | 85/8465 | 3.30e-05 | 1.88e-04 | 1.04e-04 | 59 |
| hsa009832 | Liver | HCC | Drug metabolism - other enzymes | 54/4020 | 80/8465 | 2.25e-04 | 1.09e-03 | 6.08e-04 | 54 |
| hsa012403 | Liver | HCC | Biosynthesis of cofactors | 103/4020 | 153/8465 | 4.67e-07 | 5.05e-06 | 2.81e-06 | 103 |
| hsa002403 | Liver | HCC | Pyrimidine metabolism | 44/4020 | 58/8465 | 9.34e-06 | 7.11e-05 | 3.95e-05 | 44 |
| hsa012323 | Liver | HCC | Nucleotide metabolism | 59/4020 | 85/8465 | 3.30e-05 | 1.88e-04 | 1.04e-04 | 59 |
| hsa009833 | Liver | HCC | Drug metabolism - other enzymes | 54/4020 | 80/8465 | 2.25e-04 | 1.09e-03 | 6.08e-04 | 54 |
| hsa012324 | Oral cavity | OSCC | Nucleotide metabolism | 54/3704 | 85/8465 | 1.78e-04 | 5.95e-04 | 3.03e-04 | 54 |
| hsa012404 | Oral cavity | OSCC | Biosynthesis of cofactors | 88/3704 | 153/8465 | 3.84e-04 | 1.20e-03 | 6.12e-04 | 88 |
| hsa002404 | Oral cavity | OSCC | Pyrimidine metabolism | 37/3704 | 58/8465 | 1.62e-03 | 4.45e-03 | 2.26e-03 | 37 |
| hsa0123211 | Oral cavity | OSCC | Nucleotide metabolism | 54/3704 | 85/8465 | 1.78e-04 | 5.95e-04 | 3.03e-04 | 54 |
| hsa0124011 | Oral cavity | OSCC | Biosynthesis of cofactors | 88/3704 | 153/8465 | 3.84e-04 | 1.20e-03 | 6.12e-04 | 88 |
| hsa0024011 | Oral cavity | OSCC | Pyrimidine metabolism | 37/3704 | 58/8465 | 1.62e-03 | 4.45e-03 | 2.26e-03 | 37 |
| Page: 1 2 |
Top |
Cell-cell communication analysis |
| Identification of potential cell-cell interactions between two cell types and their ligand-receptor pairs for different disease states |
| Ligand | Receptor | LRpair | Pathway | Tissue | Disease Stage |
| Page: 1 |
Top |
Single-cell gene regulatory network inference analysis |
| Find out the significant the regulons (TFs) and the target genes of each regulon across cell types for different disease states |
| TF | Cell Type | Tissue | Disease Stage | Target Gene | RSS | Regulon Activity |
| ∗The dot plots of a searched regulon are shown for all cell subpopulations in each disease state of each tissue based on the regulon specific score inferred using pySCENIC and by calculating the average expression. |
| Page: 1 |
Top |
Somatic mutation of malignant transformation related genes |
| Annotation of somatic variants for genes involved in malignant transformation |
| Hugo Symbol | Variant Class | Variant Classification | dbSNP RS | HGVSc | HGVSp | HGVSp Short | SWISSPROT | BIOTYPE | SIFT | PolyPhen | Tumor Sample Barcode | Tissue | Histology | Sex | Age | Stage | Therapy Types | Drugs | Outcome |
| NME6 | SNV | Missense_Mutation | c.537N>T | p.Glu179Asp | p.E179D | protein_coding | tolerated(0.29) | benign(0.049) | TCGA-A2-A0EO-01 | Breast | breast invasive carcinoma | Female | <65 | I/II | Hormone Therapy | tamoxiphen | SD | ||
| NME6 | SNV | Missense_Mutation | c.577N>G | p.Pro193Ala | p.P193A | protein_coding | deleterious_low_confidence(0) | benign(0.007) | TCGA-A8-A08L-01 | Breast | breast invasive carcinoma | Female | >=65 | III/IV | Unknown | Unknown | SD | ||
| NME6 | SNV | Missense_Mutation | rs144390600 | c.221G>A | p.Arg74His | p.R74H | protein_coding | deleterious(0.03) | benign(0.239) | TCGA-IR-A3L7-01 | Cervix | cervical & endocervical cancer | Female | <65 | I/II | Chemotherapy | cisplatin | CR | |
| NME6 | SNV | Missense_Mutation | rs745495639 | c.509N>A | p.Arg170His | p.R170H | protein_coding | deleterious(0.01) | probably_damaging(0.997) | TCGA-AA-3864-01 | Colorectum | colon adenocarcinoma | Male | >=65 | I/II | Unknown | Unknown | SD | |
| NME6 | SNV | Missense_Mutation | rs374032471 | c.259N>A | p.Gly87Arg | p.G87R | protein_coding | deleterious(0) | probably_damaging(0.999) | TCGA-AA-3941-01 | Colorectum | colon adenocarcinoma | Female | >=65 | I/II | Unknown | Unknown | SD | |
| NME6 | SNV | Missense_Mutation | c.311N>C | p.Arg104Thr | p.R104T | protein_coding | deleterious(0) | probably_damaging(1) | TCGA-AA-3955-01 | Colorectum | colon adenocarcinoma | Male | <65 | III/IV | Chemotherapy | capecitabine | CR | ||
| NME6 | SNV | Missense_Mutation | novel | c.133N>A | p.Leu45Ile | p.L45I | protein_coding | tolerated(0.19) | possibly_damaging(0.858) | TCGA-AG-A002-01 | Colorectum | rectum adenocarcinoma | Male | <65 | I/II | Unknown | Unknown | SD | |
| NME6 | SNV | Missense_Mutation | novel | c.253N>A | p.Ala85Thr | p.A85T | protein_coding | tolerated(0.5) | benign(0.02) | TCGA-A5-A0G2-01 | Endometrium | uterine corpus endometrioid carcinoma | Female | <65 | III/IV | Unknown | Unknown | SD | |
| NME6 | SNV | Missense_Mutation | novel | c.220N>T | p.Arg74Cys | p.R74C | protein_coding | deleterious(0) | probably_damaging(0.969) | TCGA-A5-A1OF-01 | Endometrium | uterine corpus endometrioid carcinoma | Female | <65 | I/II | Unknown | Unknown | SD | |
| NME6 | SNV | Missense_Mutation | novel | c.143N>C | p.Lys48Thr | p.K48T | protein_coding | tolerated(0.26) | benign(0.197) | TCGA-B5-A1MR-01 | Endometrium | uterine corpus endometrioid carcinoma | Female | >=65 | III/IV | Unknown | Unknown | SD |
| Page: 1 2 |
Top |
Related drugs of malignant transformation related genes |
| Identification of chemicals and drugs interact with genes involved in malignant transfromation |
| (DGIdb 4.0) |
| Entrez ID | Symbol | Category | Interaction Types | Drug Claim Name | Drug Name | PMIDs |
| Page: 1 |

Copyright 2023-Present -The University of Texas Health Science Center at Houston |