
|
|||||
|
 | |
| |
| |
| |
| |
| |
|
Gene: NME3 |
Gene summary for NME3 |
| Gene information | Species | Human | Gene symbol | NME3 | Gene ID | 4832 |
| Gene name | NME/NM23 nucleoside diphosphate kinase 3 | |
| Gene Alias | DR-nm23 | |
| Cytomap | 16p13.3 | |
| Gene Type | protein-coding | GO ID | GO:0006139 | UniProtAcc | Q13232 |
Top |
Malignant transformation analysis |
| Identification of the aberrant gene expression in precancerous and cancerous lesions by comparing the gene expression of stem-like cells in diseased tissues with normal stem cells |
| Entrez ID | Symbol | Replicates | Species | Organ | Tissue | Adj P-value | Log2FC | Malignancy |
| 4832 | NME3 | GSM4909286 | Human | Breast | IDC | 3.38e-02 | -1.48e-01 | 0.1081 |
| 4832 | NME3 | GSM4909293 | Human | Breast | IDC | 6.12e-37 | 7.76e-01 | 0.1581 |
| 4832 | NME3 | GSM4909294 | Human | Breast | IDC | 1.76e-11 | 3.46e-01 | 0.2022 |
| 4832 | NME3 | GSM4909296 | Human | Breast | IDC | 1.31e-05 | 9.50e-03 | 0.1524 |
| 4832 | NME3 | GSM4909297 | Human | Breast | IDC | 7.84e-11 | 1.02e-01 | 0.1517 |
| 4832 | NME3 | GSM4909298 | Human | Breast | IDC | 9.20e-05 | 2.67e-01 | 0.1551 |
| 4832 | NME3 | GSM4909301 | Human | Breast | IDC | 6.93e-10 | 3.81e-01 | 0.1577 |
| 4832 | NME3 | GSM4909302 | Human | Breast | IDC | 2.32e-10 | 4.51e-01 | 0.1545 |
| 4832 | NME3 | GSM4909304 | Human | Breast | IDC | 1.67e-19 | 5.50e-01 | 0.1636 |
| 4832 | NME3 | GSM4909305 | Human | Breast | IDC | 1.26e-06 | 3.87e-01 | 0.0436 |
| 4832 | NME3 | GSM4909306 | Human | Breast | IDC | 1.19e-47 | 8.23e-01 | 0.1564 |
| 4832 | NME3 | GSM4909307 | Human | Breast | IDC | 1.08e-08 | 4.21e-01 | 0.1569 |
| 4832 | NME3 | GSM4909308 | Human | Breast | IDC | 1.49e-13 | 4.60e-01 | 0.158 |
| 4832 | NME3 | GSM4909311 | Human | Breast | IDC | 1.27e-26 | -1.21e-01 | 0.1534 |
| 4832 | NME3 | GSM4909312 | Human | Breast | IDC | 2.58e-08 | -1.89e-03 | 0.1552 |
| 4832 | NME3 | GSM4909313 | Human | Breast | IDC | 6.42e-05 | 3.39e-01 | 0.0391 |
| 4832 | NME3 | GSM4909317 | Human | Breast | IDC | 6.90e-08 | 3.95e-01 | 0.1355 |
| 4832 | NME3 | GSM4909319 | Human | Breast | IDC | 1.34e-52 | 4.62e-01 | 0.1563 |
| 4832 | NME3 | GSM4909320 | Human | Breast | IDC | 8.02e-06 | 2.12e-01 | 0.1575 |
| 4832 | NME3 | GSM4909321 | Human | Breast | IDC | 1.58e-12 | 2.83e-01 | 0.1559 |
| Page: 1 2 3 4 5 6 7 8 9 10 |
| Tissue | Expression Dynamics | Abbreviation |
| Breast | 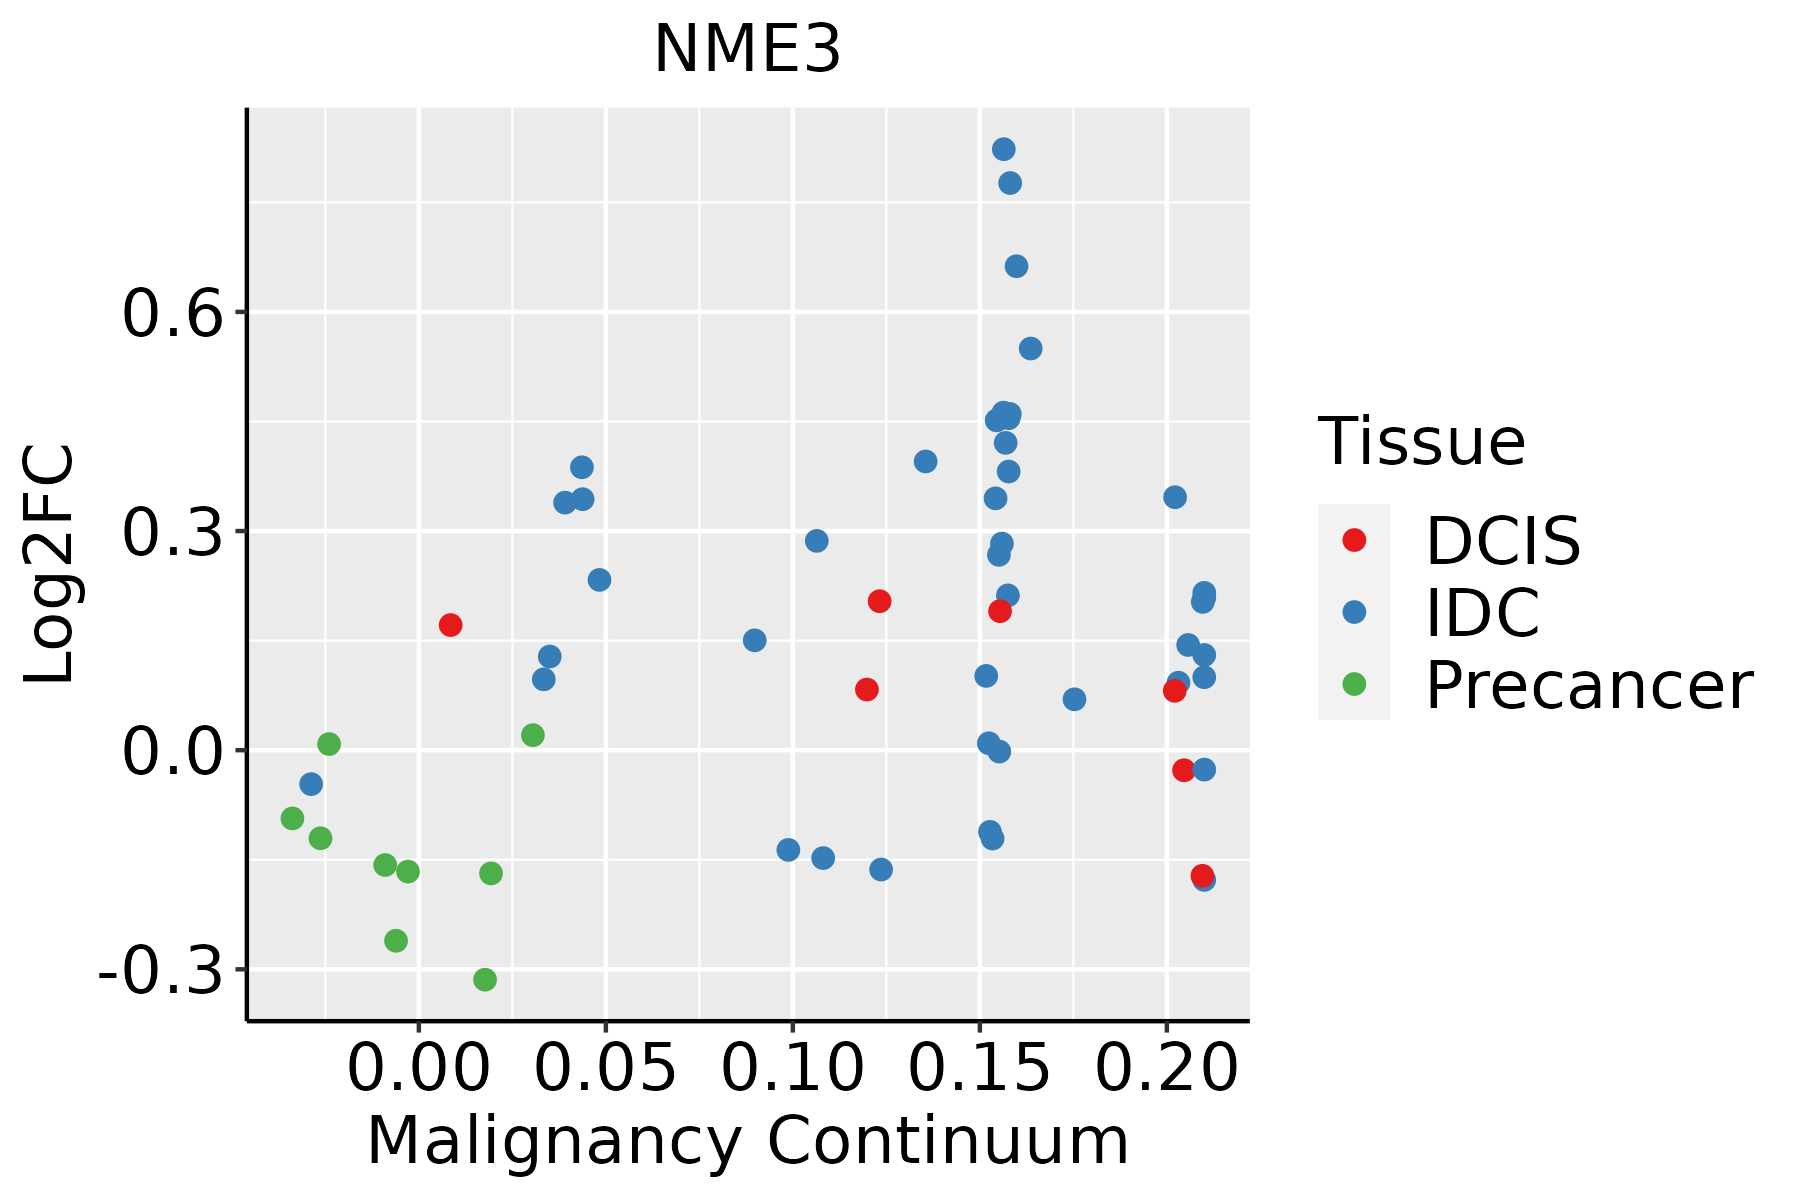 | IDC: Invasive ductal carcinoma |
| DCIS: Ductal carcinoma in situ | ||
| Precancer(BRCA1-mut): Precancerous lesion from BRCA1 mutation carriers | ||
| Cervix |  | CC: Cervix cancer |
| HSIL_HPV: HPV-infected high-grade squamous intraepithelial lesions | ||
| N_HPV: HPV-infected normal cervix | ||
| Endometrium |  | AEH: Atypical endometrial hyperplasia |
| EEC: Endometrioid Cancer | ||
| Esophagus |  | ESCC: Esophageal squamous cell carcinoma |
| HGIN: High-grade intraepithelial neoplasias | ||
| LGIN: Low-grade intraepithelial neoplasias | ||
| Liver | 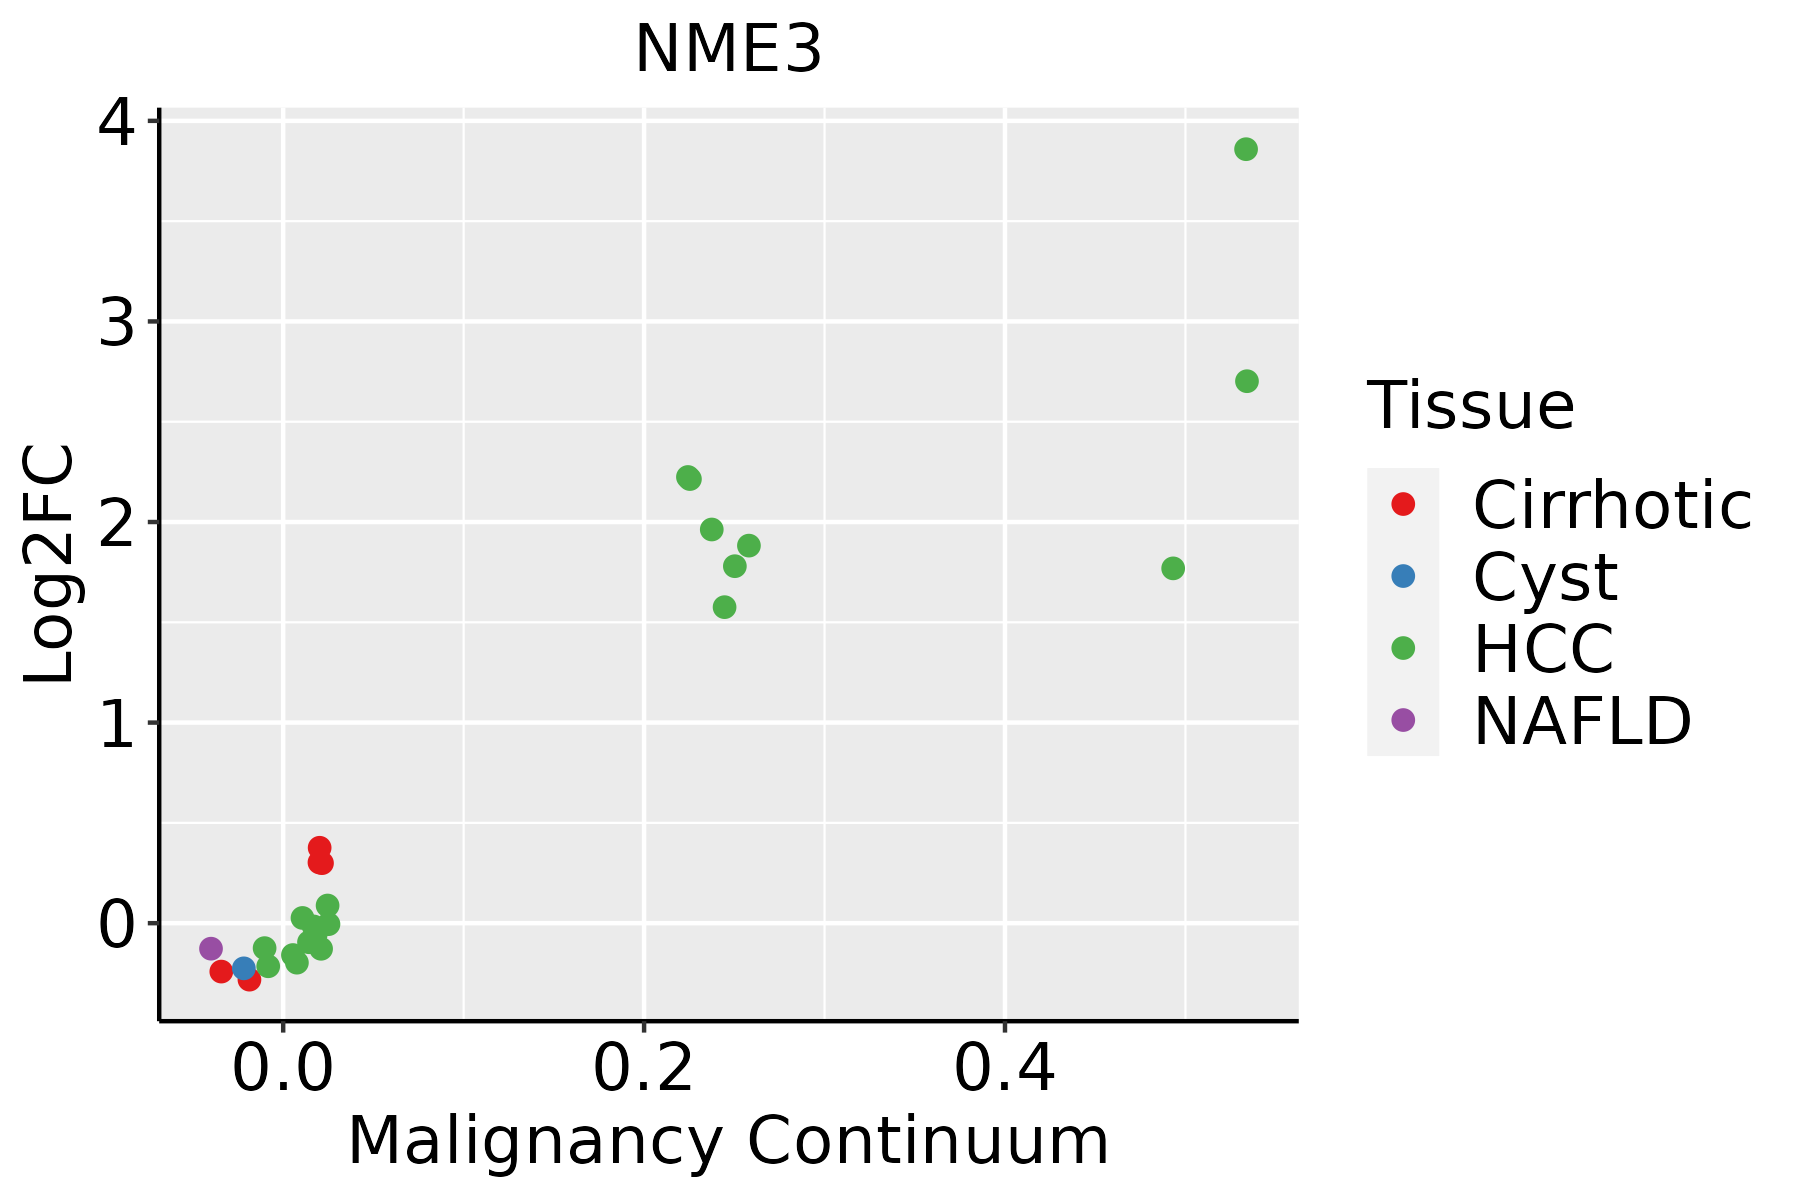 | HCC: Hepatocellular carcinoma |
| NAFLD: Non-alcoholic fatty liver disease | ||
| Lung | 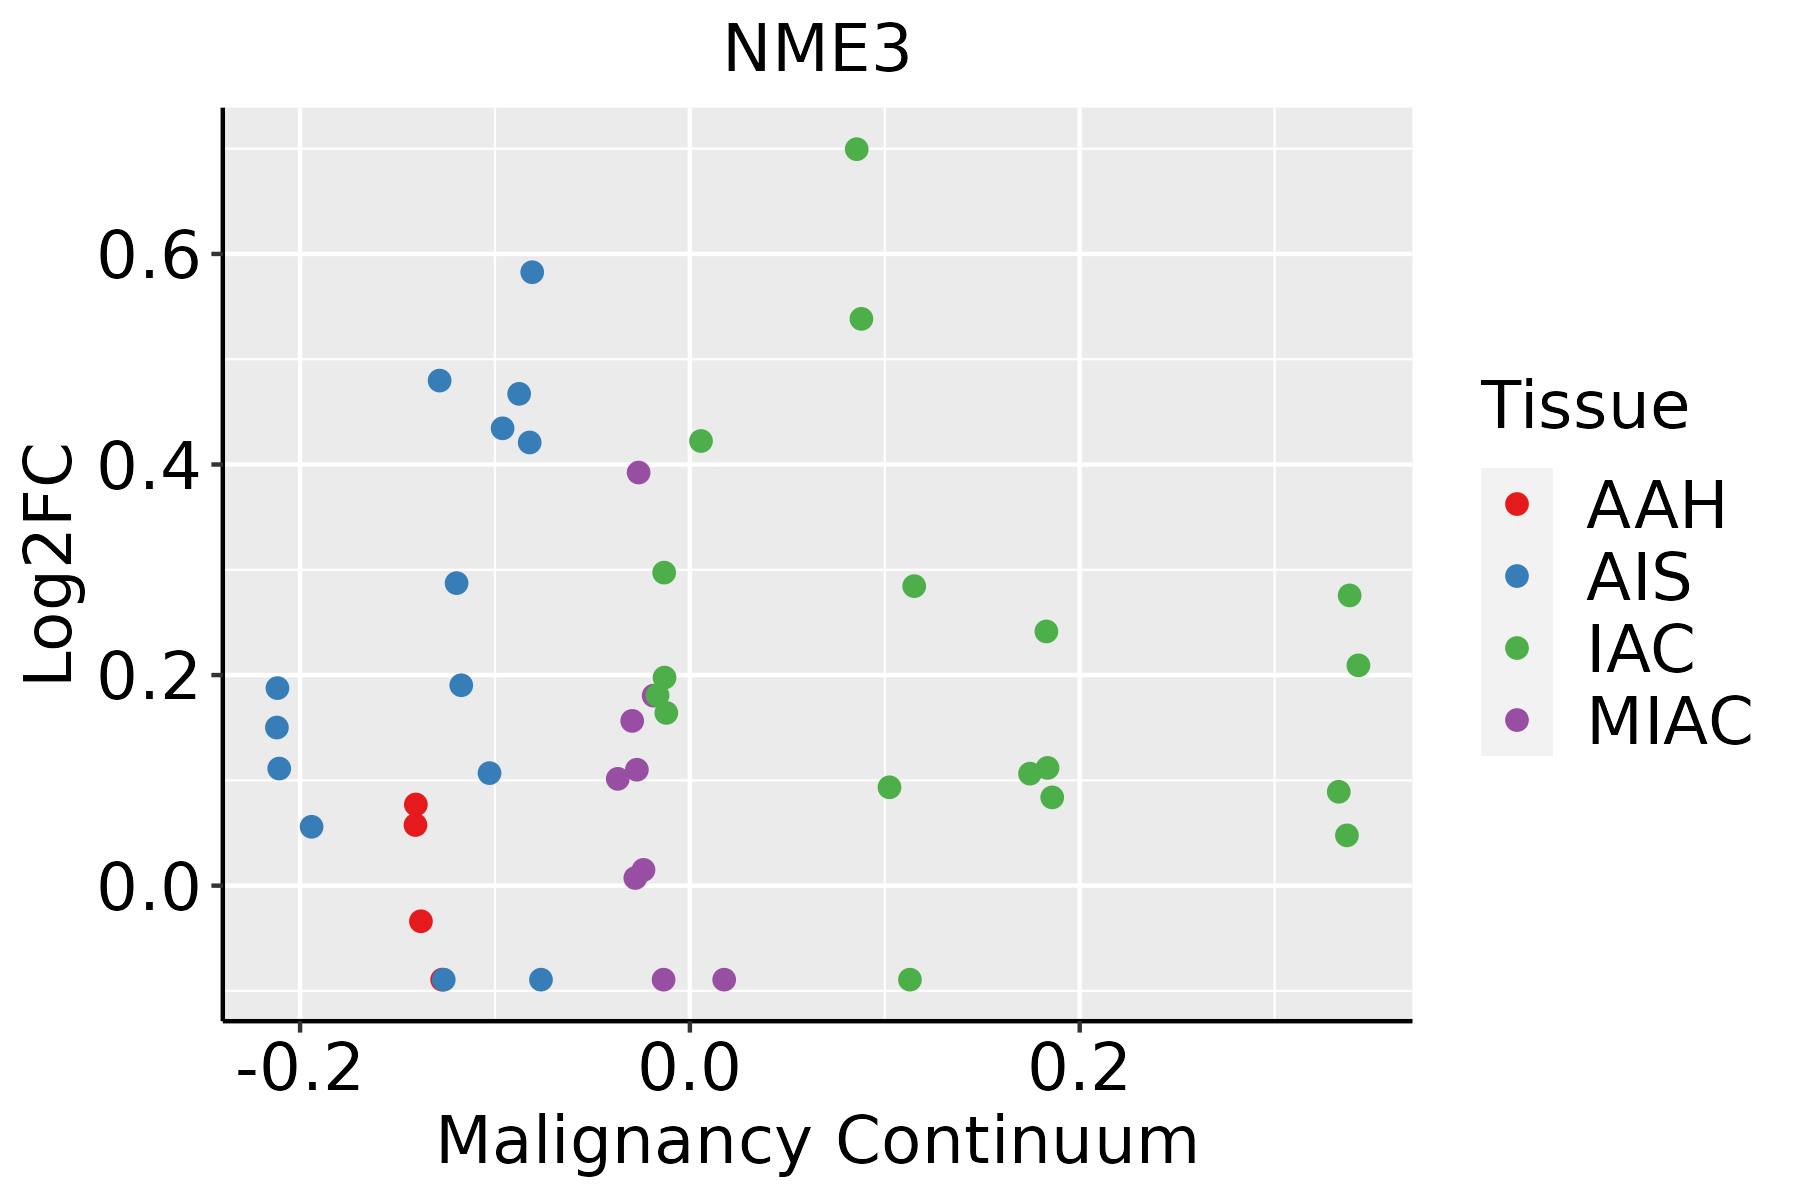 | AAH: Atypical adenomatous hyperplasia |
| AIS: Adenocarcinoma in situ | ||
| IAC: Invasive lung adenocarcinoma | ||
| MIA: Minimally invasive adenocarcinoma | ||
| Oral Cavity | 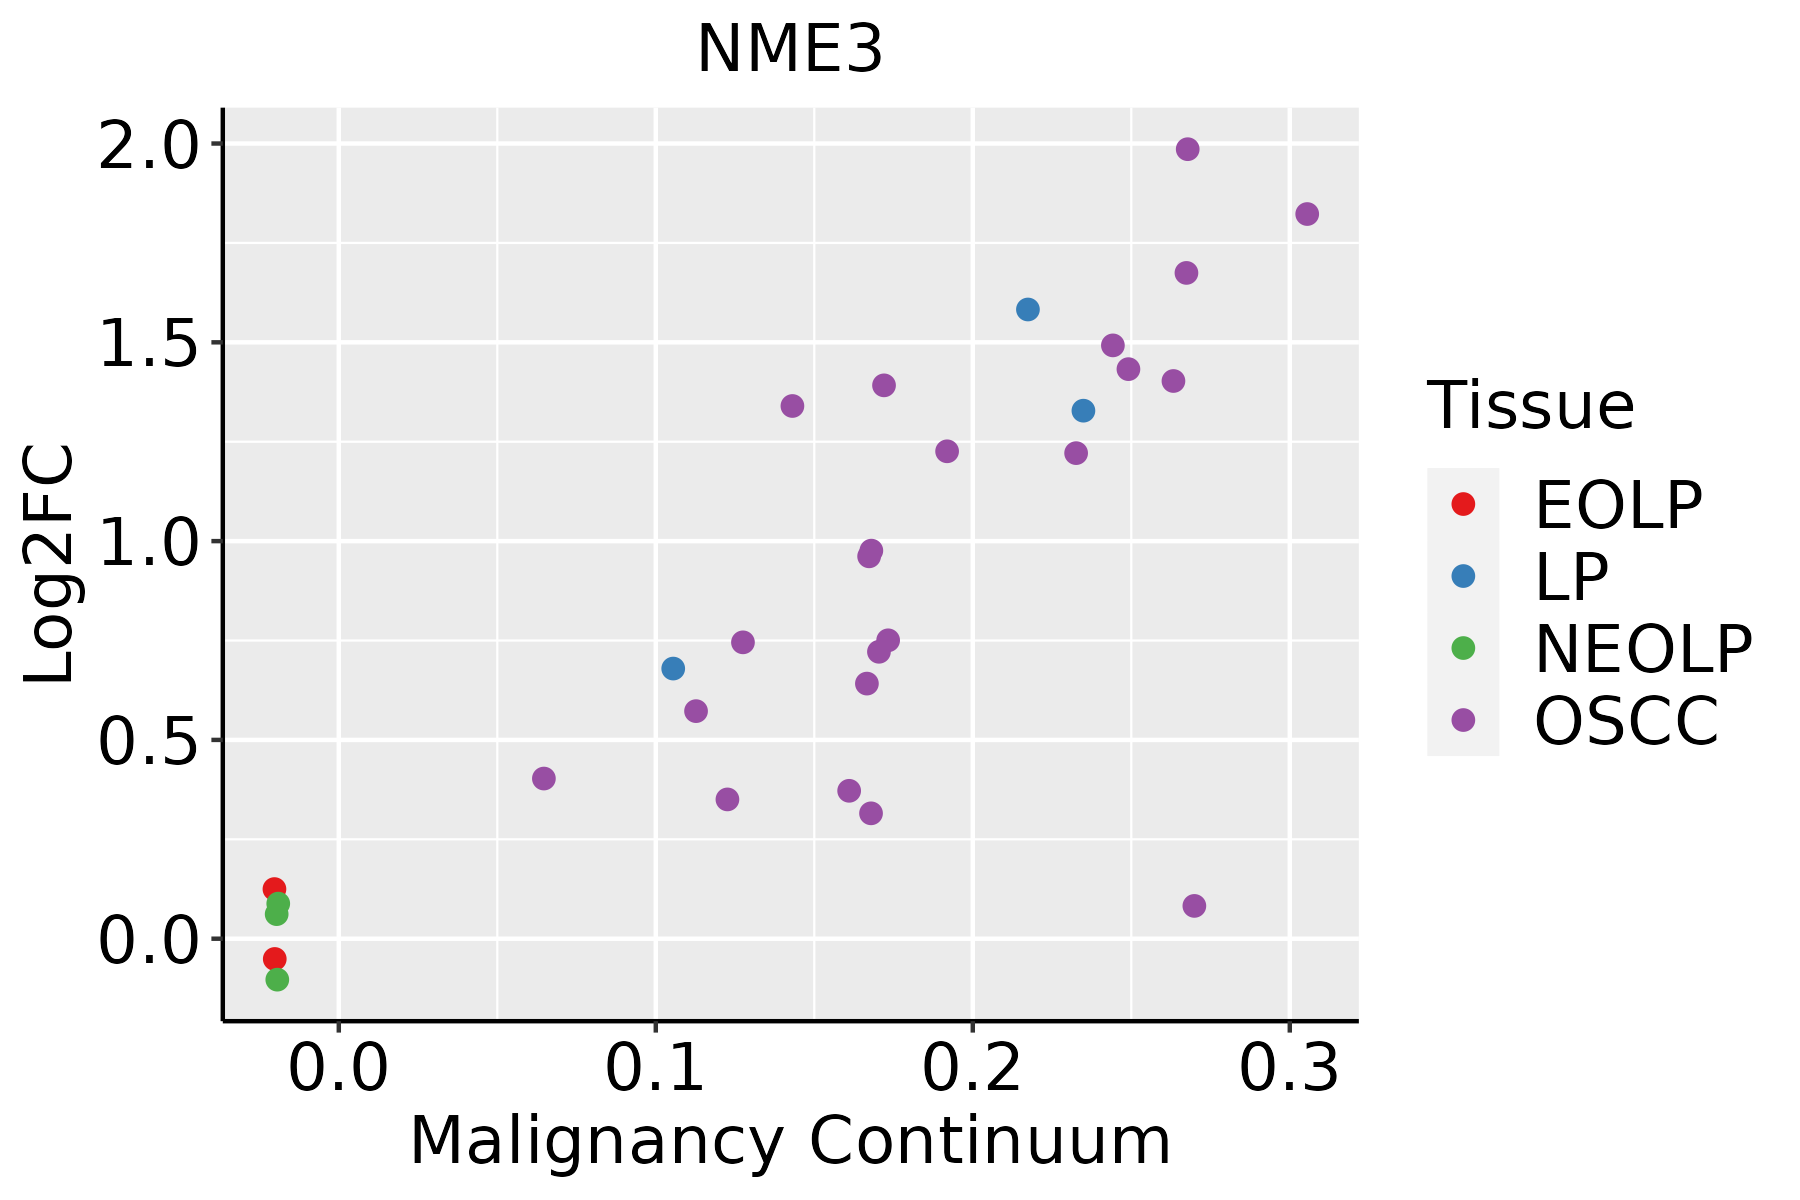 | EOLP: Erosive Oral lichen planus |
| LP: leukoplakia | ||
| NEOLP: Non-erosive oral lichen planus | ||
| OSCC: Oral squamous cell carcinoma | ||
| Prostate | 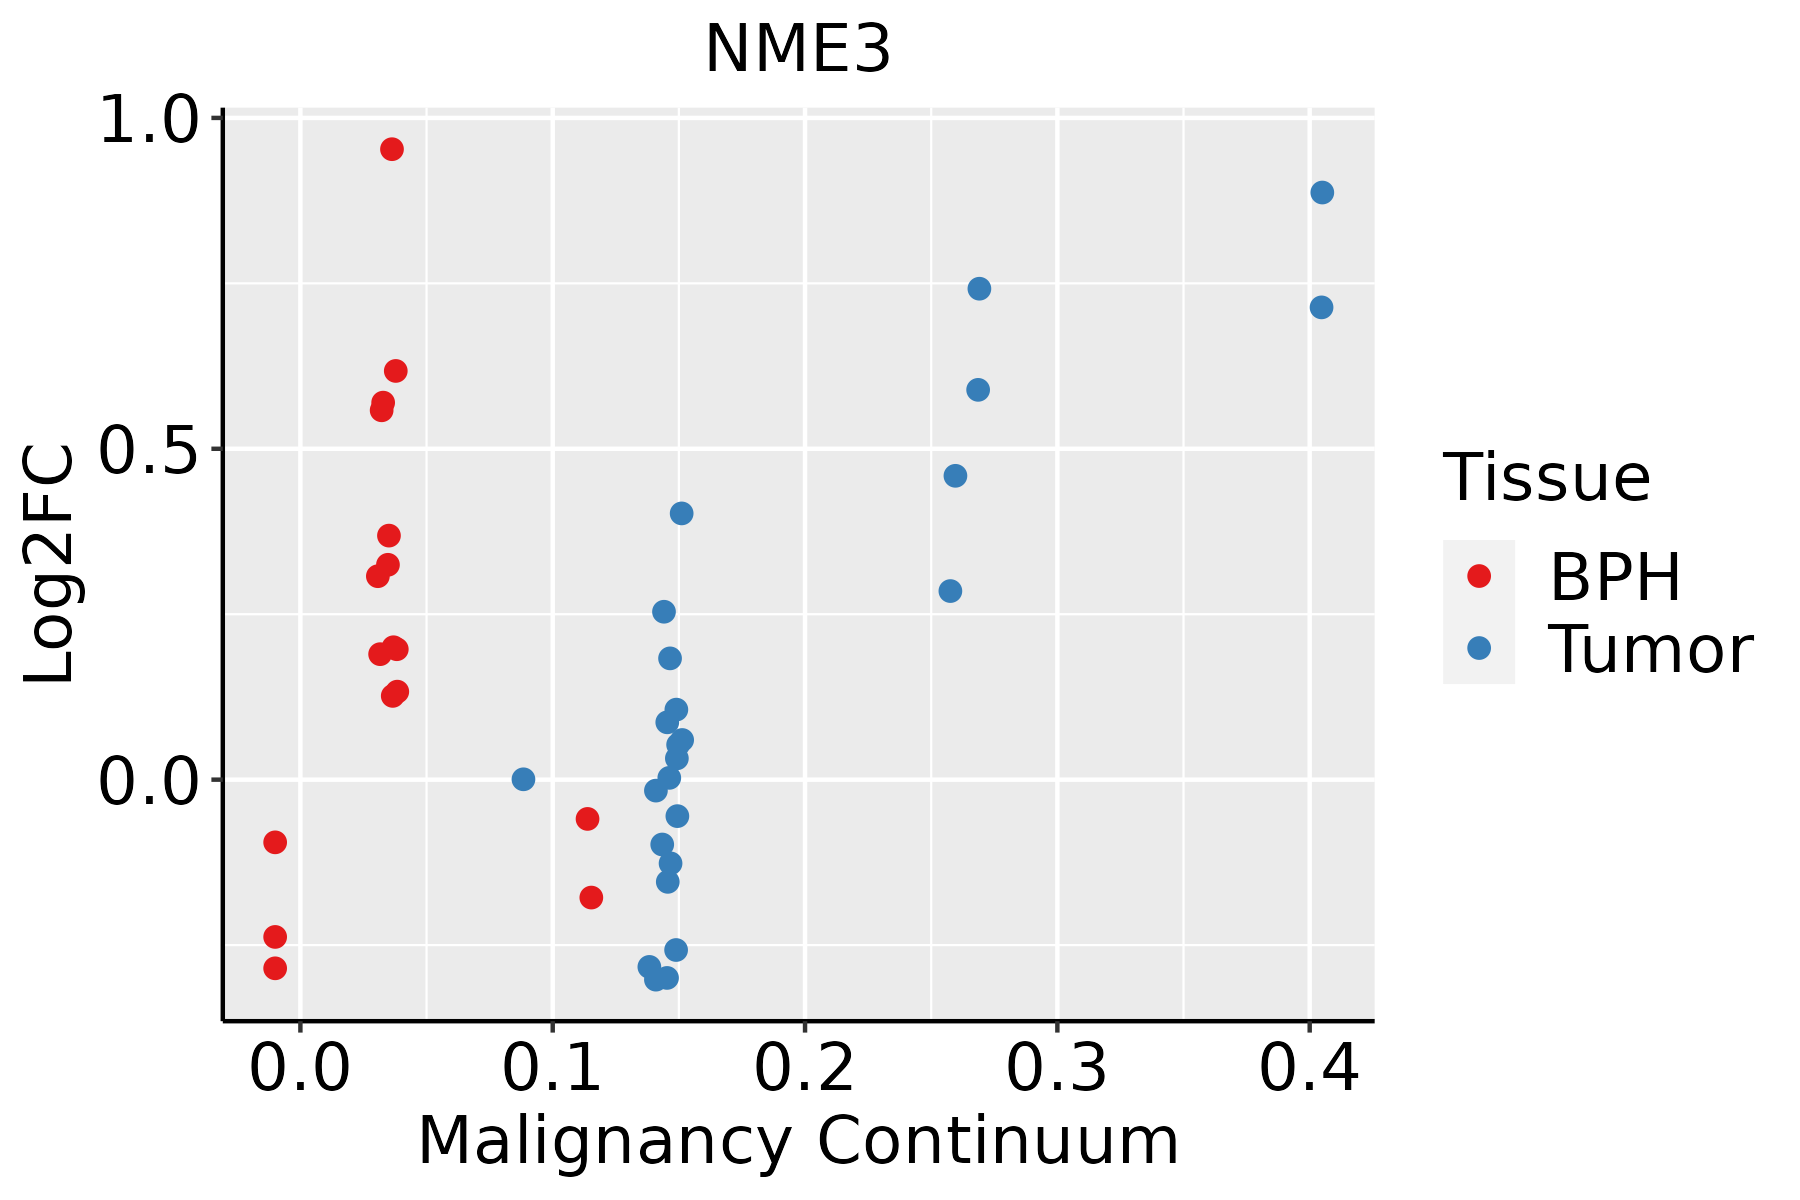 | BPH: Benign Prostatic Hyperplasia |
| Skin |  | AK: Actinic keratosis |
| cSCC: Cutaneous squamous cell carcinoma | ||
| SCCIS:squamous cell carcinoma in situ | ||
| Thyroid |  | ATC: Anaplastic thyroid cancer |
| HT: Hashimoto's thyroiditis | ||
| PTC: Papillary thyroid cancer |
| ∗log2FC in expression of this searched gene in stem-like cells from each diseased tissue sample relative to stem-like cells in normal samples in each tissue plotted against the malignancy continuum. Samples are colored based on if they are from different disease stage. |
Top |
Malignant transformation related pathway analysis |
| Find out the enriched GO biological processes and KEGG pathways involved in transition from healthy to precancer to cancer |
| Tissue | Disease Stage | Enriched GO biological Processes |
| Colorectum | AD |  |
| Colorectum | SER |  |
| Colorectum | MSS |  |
| Colorectum | MSI-H |  |
| Colorectum | FAP |  |
| ∗Top 15 enriched GO BP terms are showed in the bar plot of each disease state in each tissue. Each row represents a significant GO biological process which is colored according to the -log10(p.adjust). |
| Page: 1 2 3 4 5 6 7 8 9 |
| GO ID | Tissue | Disease Stage | Description | Gene Ratio | Bg Ratio | pvalue | p.adjust | Count |
| GO:000920614 | Breast | IDC | purine ribonucleoside triphosphate biosynthetic process | 24/1434 | 68/18723 | 7.70e-11 | 1.07e-08 | 24 |
| GO:000914514 | Breast | IDC | purine nucleoside triphosphate biosynthetic process | 24/1434 | 69/18723 | 1.10e-10 | 1.38e-08 | 24 |
| GO:000914214 | Breast | IDC | nucleoside triphosphate biosynthetic process | 26/1434 | 85/18723 | 4.72e-10 | 5.06e-08 | 26 |
| GO:000920113 | Breast | IDC | ribonucleoside triphosphate biosynthetic process | 24/1434 | 74/18723 | 5.73e-10 | 6.03e-08 | 24 |
| GO:000914414 | Breast | IDC | purine nucleoside triphosphate metabolic process | 26/1434 | 88/18723 | 1.09e-09 | 1.07e-07 | 26 |
| GO:000920514 | Breast | IDC | purine ribonucleoside triphosphate metabolic process | 25/1434 | 82/18723 | 1.10e-09 | 1.07e-07 | 25 |
| GO:000914114 | Breast | IDC | nucleoside triphosphate metabolic process | 29/1434 | 112/18723 | 3.68e-09 | 3.03e-07 | 29 |
| GO:000919913 | Breast | IDC | ribonucleoside triphosphate metabolic process | 25/1434 | 89/18723 | 7.22e-09 | 5.47e-07 | 25 |
| GO:000915214 | Breast | IDC | purine ribonucleotide biosynthetic process | 34/1434 | 169/18723 | 1.63e-07 | 8.92e-06 | 34 |
| GO:004639013 | Breast | IDC | ribose phosphate biosynthetic process | 36/1434 | 190/18723 | 3.40e-07 | 1.73e-05 | 36 |
| GO:000926013 | Breast | IDC | ribonucleotide biosynthetic process | 35/1434 | 182/18723 | 3.40e-07 | 1.73e-05 | 35 |
| GO:000915014 | Breast | IDC | purine ribonucleotide metabolic process | 55/1434 | 368/18723 | 1.30e-06 | 5.72e-05 | 55 |
| GO:001969314 | Breast | IDC | ribose phosphate metabolic process | 58/1434 | 396/18723 | 1.31e-06 | 5.73e-05 | 58 |
| GO:000675313 | Breast | IDC | nucleoside phosphate metabolic process | 68/1434 | 497/18723 | 2.01e-06 | 8.23e-05 | 68 |
| GO:000911713 | Breast | IDC | nucleotide metabolic process | 67/1434 | 489/18723 | 2.28e-06 | 9.05e-05 | 67 |
| GO:000925914 | Breast | IDC | ribonucleotide metabolic process | 56/1434 | 385/18723 | 2.47e-06 | 9.63e-05 | 56 |
| GO:000616413 | Breast | IDC | purine nucleotide biosynthetic process | 34/1434 | 191/18723 | 3.11e-06 | 1.15e-04 | 34 |
| GO:190129313 | Breast | IDC | nucleoside phosphate biosynthetic process | 41/1434 | 256/18723 | 5.15e-06 | 1.73e-04 | 41 |
| GO:000616314 | Breast | IDC | purine nucleotide metabolic process | 56/1434 | 396/18723 | 5.90e-06 | 1.90e-04 | 56 |
| GO:004693913 | Breast | IDC | nucleotide phosphorylation | 22/1434 | 101/18723 | 6.31e-06 | 1.98e-04 | 22 |
| Page: 1 2 3 4 5 6 7 8 9 10 11 12 13 14 15 16 17 18 19 20 21 |
| Pathway ID | Tissue | Disease Stage | Description | Gene Ratio | Bg Ratio | pvalue | p.adjust | qvalue | Count |
| hsa012325 | Esophagus | ESCC | Nucleotide metabolism | 59/4205 | 85/8465 | 1.67e-04 | 6.58e-04 | 3.37e-04 | 59 |
| hsa012405 | Esophagus | ESCC | Biosynthesis of cofactors | 97/4205 | 153/8465 | 3.88e-04 | 1.35e-03 | 6.94e-04 | 97 |
| hsa002405 | Esophagus | ESCC | Pyrimidine metabolism | 41/4205 | 58/8465 | 9.14e-04 | 2.92e-03 | 1.49e-03 | 41 |
| hsa0123212 | Esophagus | ESCC | Nucleotide metabolism | 59/4205 | 85/8465 | 1.67e-04 | 6.58e-04 | 3.37e-04 | 59 |
| hsa0124012 | Esophagus | ESCC | Biosynthesis of cofactors | 97/4205 | 153/8465 | 3.88e-04 | 1.35e-03 | 6.94e-04 | 97 |
| hsa0024012 | Esophagus | ESCC | Pyrimidine metabolism | 41/4205 | 58/8465 | 9.14e-04 | 2.92e-03 | 1.49e-03 | 41 |
| hsa01240 | Liver | Cirrhotic | Biosynthesis of cofactors | 66/2530 | 153/8465 | 3.11e-04 | 1.99e-03 | 1.23e-03 | 66 |
| hsa01232 | Liver | Cirrhotic | Nucleotide metabolism | 39/2530 | 85/8465 | 1.27e-03 | 6.73e-03 | 4.15e-03 | 39 |
| hsa00240 | Liver | Cirrhotic | Pyrimidine metabolism | 27/2530 | 58/8465 | 5.31e-03 | 1.88e-02 | 1.16e-02 | 27 |
| hsa00983 | Liver | Cirrhotic | Drug metabolism - other enzymes | 34/2530 | 80/8465 | 1.08e-02 | 3.57e-02 | 2.20e-02 | 34 |
| hsa012401 | Liver | Cirrhotic | Biosynthesis of cofactors | 66/2530 | 153/8465 | 3.11e-04 | 1.99e-03 | 1.23e-03 | 66 |
| hsa012321 | Liver | Cirrhotic | Nucleotide metabolism | 39/2530 | 85/8465 | 1.27e-03 | 6.73e-03 | 4.15e-03 | 39 |
| hsa002401 | Liver | Cirrhotic | Pyrimidine metabolism | 27/2530 | 58/8465 | 5.31e-03 | 1.88e-02 | 1.16e-02 | 27 |
| hsa009831 | Liver | Cirrhotic | Drug metabolism - other enzymes | 34/2530 | 80/8465 | 1.08e-02 | 3.57e-02 | 2.20e-02 | 34 |
| hsa012402 | Liver | HCC | Biosynthesis of cofactors | 103/4020 | 153/8465 | 4.67e-07 | 5.05e-06 | 2.81e-06 | 103 |
| hsa002402 | Liver | HCC | Pyrimidine metabolism | 44/4020 | 58/8465 | 9.34e-06 | 7.11e-05 | 3.95e-05 | 44 |
| hsa012322 | Liver | HCC | Nucleotide metabolism | 59/4020 | 85/8465 | 3.30e-05 | 1.88e-04 | 1.04e-04 | 59 |
| hsa009832 | Liver | HCC | Drug metabolism - other enzymes | 54/4020 | 80/8465 | 2.25e-04 | 1.09e-03 | 6.08e-04 | 54 |
| hsa012403 | Liver | HCC | Biosynthesis of cofactors | 103/4020 | 153/8465 | 4.67e-07 | 5.05e-06 | 2.81e-06 | 103 |
| hsa002403 | Liver | HCC | Pyrimidine metabolism | 44/4020 | 58/8465 | 9.34e-06 | 7.11e-05 | 3.95e-05 | 44 |
| Page: 1 2 |
Top |
Cell-cell communication analysis |
| Identification of potential cell-cell interactions between two cell types and their ligand-receptor pairs for different disease states |
| Ligand | Receptor | LRpair | Pathway | Tissue | Disease Stage |
| Page: 1 |
Top |
Single-cell gene regulatory network inference analysis |
| Find out the significant the regulons (TFs) and the target genes of each regulon across cell types for different disease states |
| TF | Cell Type | Tissue | Disease Stage | Target Gene | RSS | Regulon Activity |
| ∗The dot plots of a searched regulon are shown for all cell subpopulations in each disease state of each tissue based on the regulon specific score inferred using pySCENIC and by calculating the average expression. |
| Page: 1 |
Top |
Somatic mutation of malignant transformation related genes |
| Annotation of somatic variants for genes involved in malignant transformation |
| Hugo Symbol | Variant Class | Variant Classification | dbSNP RS | HGVSc | HGVSp | HGVSp Short | SWISSPROT | BIOTYPE | SIFT | PolyPhen | Tumor Sample Barcode | Tissue | Histology | Sex | Age | Stage | Therapy Types | Drugs | Outcome |
| NME3 | SNV | Missense_Mutation | c.370N>T | p.Asp124Tyr | p.D124Y | Q13232 | protein_coding | deleterious(0) | probably_damaging(1) | TCGA-A6-6141-01 | Colorectum | colon adenocarcinoma | Male | <65 | I/II | Chemotherapy | 5-fu | SD | |
| NME3 | SNV | Missense_Mutation | novel | c.91N>A | p.Asp31Asn | p.D31N | Q13232 | protein_coding | deleterious(0.01) | probably_damaging(0.987) | TCGA-DD-A1EJ-01 | Liver | liver hepatocellular carcinoma | Female | >=65 | III/IV | Targeted Molecular therapy | sorafenib | PD |
| NME3 | SNV | Missense_Mutation | novel | c.28G>A | p.Ala10Thr | p.A10T | Q13232 | protein_coding | deleterious(0.02) | benign(0.206) | TCGA-DD-AACZ-01 | Liver | liver hepatocellular carcinoma | Female | <65 | I/II | Unknown | Unknown | PD |
| NME3 | SNV | Missense_Mutation | c.365N>A | p.Arg122His | p.R122H | Q13232 | protein_coding | deleterious(0.02) | probably_damaging(0.978) | TCGA-39-5029-01 | Lung | lung squamous cell carcinoma | Male | >=65 | III/IV | Chemotherapy | docetaxel | PD | |
| NME3 | SNV | Missense_Mutation | c.365G>T | p.Arg122Leu | p.R122L | Q13232 | protein_coding | deleterious(0) | possibly_damaging(0.853) | TCGA-58-A46L-01 | Lung | lung squamous cell carcinoma | Male | >=65 | III/IV | Chemotherapy | carboplatin | CR | |
| NME3 | SNV | Missense_Mutation | rs189034490 | c.305N>A | p.Arg102His | p.R102H | Q13232 | protein_coding | deleterious(0.01) | benign(0.001) | TCGA-HU-A4G9-01 | Stomach | stomach adenocarcinoma | Female | >=65 | I/II | Unknown | Unknown | SD |
| NME3 | SNV | Missense_Mutation | rs754431274 | c.367N>A | p.Gly123Arg | p.G123R | Q13232 | protein_coding | deleterious(0) | probably_damaging(1) | TCGA-SW-A7EA-01 | Stomach | stomach adenocarcinoma | Female | <65 | I/II | Unknown | Unknown | SD |
| Page: 1 |
Top |
Related drugs of malignant transformation related genes |
| Identification of chemicals and drugs interact with genes involved in malignant transfromation |
| (DGIdb 4.0) |
| Entrez ID | Symbol | Category | Interaction Types | Drug Claim Name | Drug Name | PMIDs |
| Page: 1 |

Copyright 2023-Present -The University of Texas Health Science Center at Houston |