
|
|||||
|
 | |
| |
| |
| |
| |
| |
|
Gene: NME2 |
Gene summary for NME2 |
| Gene information | Species | Human | Gene symbol | NME2 | Gene ID | 4831 |
| Gene name | NME/NM23 nucleoside diphosphate kinase 2 | |
| Gene Alias | NDKB | |
| Cytomap | 17q21.33 | |
| Gene Type | protein-coding | GO ID | GO:0001678 | UniProtAcc | P22392 |
Top |
Malignant transformation analysis |
| Identification of the aberrant gene expression in precancerous and cancerous lesions by comparing the gene expression of stem-like cells in diseased tissues with normal stem cells |
| Entrez ID | Symbol | Replicates | Species | Organ | Tissue | Adj P-value | Log2FC | Malignancy |
| 4831 | NME2 | HSIL_HPV_1 | Human | Cervix | HSIL_HPV | 2.01e-04 | 2.87e-01 | 0.0116 |
| 4831 | NME2 | HSIL_HPV_2 | Human | Cervix | HSIL_HPV | 2.80e-03 | 2.49e-01 | 0.0208 |
| 4831 | NME2 | sample1 | Human | Cervix | CC | 2.21e-49 | 1.33e+00 | 0.0959 |
| 4831 | NME2 | sample3 | Human | Cervix | CC | 5.90e-83 | 1.17e+00 | 0.1387 |
| 4831 | NME2 | H2 | Human | Cervix | HSIL_HPV | 5.92e-25 | 7.14e-01 | 0.0632 |
| 4831 | NME2 | L1 | Human | Cervix | CC | 7.66e-39 | 1.17e+00 | 0.0802 |
| 4831 | NME2 | T1 | Human | Cervix | CC | 2.46e-52 | 1.07e+00 | 0.0918 |
| 4831 | NME2 | T2 | Human | Cervix | CC | 3.28e-32 | 1.16e+00 | 0.0709 |
| 4831 | NME2 | T3 | Human | Cervix | CC | 1.21e-80 | 1.16e+00 | 0.1389 |
| 4831 | NME2 | HTA11_3410_2000001011 | Human | Colorectum | AD | 5.74e-102 | 1.64e+00 | 0.0155 |
| 4831 | NME2 | HTA11_2487_2000001011 | Human | Colorectum | SER | 6.21e-60 | 1.77e+00 | -0.1808 |
| 4831 | NME2 | HTA11_2951_2000001011 | Human | Colorectum | AD | 5.56e-36 | 1.64e+00 | 0.0216 |
| 4831 | NME2 | HTA11_1938_2000001011 | Human | Colorectum | AD | 2.14e-76 | 2.04e+00 | -0.0811 |
| 4831 | NME2 | HTA11_78_2000001011 | Human | Colorectum | AD | 3.01e-46 | 1.06e+00 | -0.1088 |
| 4831 | NME2 | HTA11_347_2000001011 | Human | Colorectum | AD | 6.61e-90 | 1.70e+00 | -0.1954 |
| 4831 | NME2 | HTA11_411_2000001011 | Human | Colorectum | SER | 6.46e-27 | 1.92e+00 | -0.2602 |
| 4831 | NME2 | HTA11_2112_2000001011 | Human | Colorectum | SER | 1.45e-19 | 1.66e+00 | -0.2196 |
| 4831 | NME2 | HTA11_3361_2000001011 | Human | Colorectum | AD | 5.82e-39 | 1.45e+00 | -0.1207 |
| 4831 | NME2 | HTA11_83_2000001011 | Human | Colorectum | SER | 1.22e-53 | 1.83e+00 | -0.1526 |
| 4831 | NME2 | HTA11_696_2000001011 | Human | Colorectum | AD | 1.97e-106 | 1.96e+00 | -0.1464 |
| Page: 1 2 3 4 5 6 7 8 9 10 11 12 13 14 15 |
| Tissue | Expression Dynamics | Abbreviation |
| Cervix | 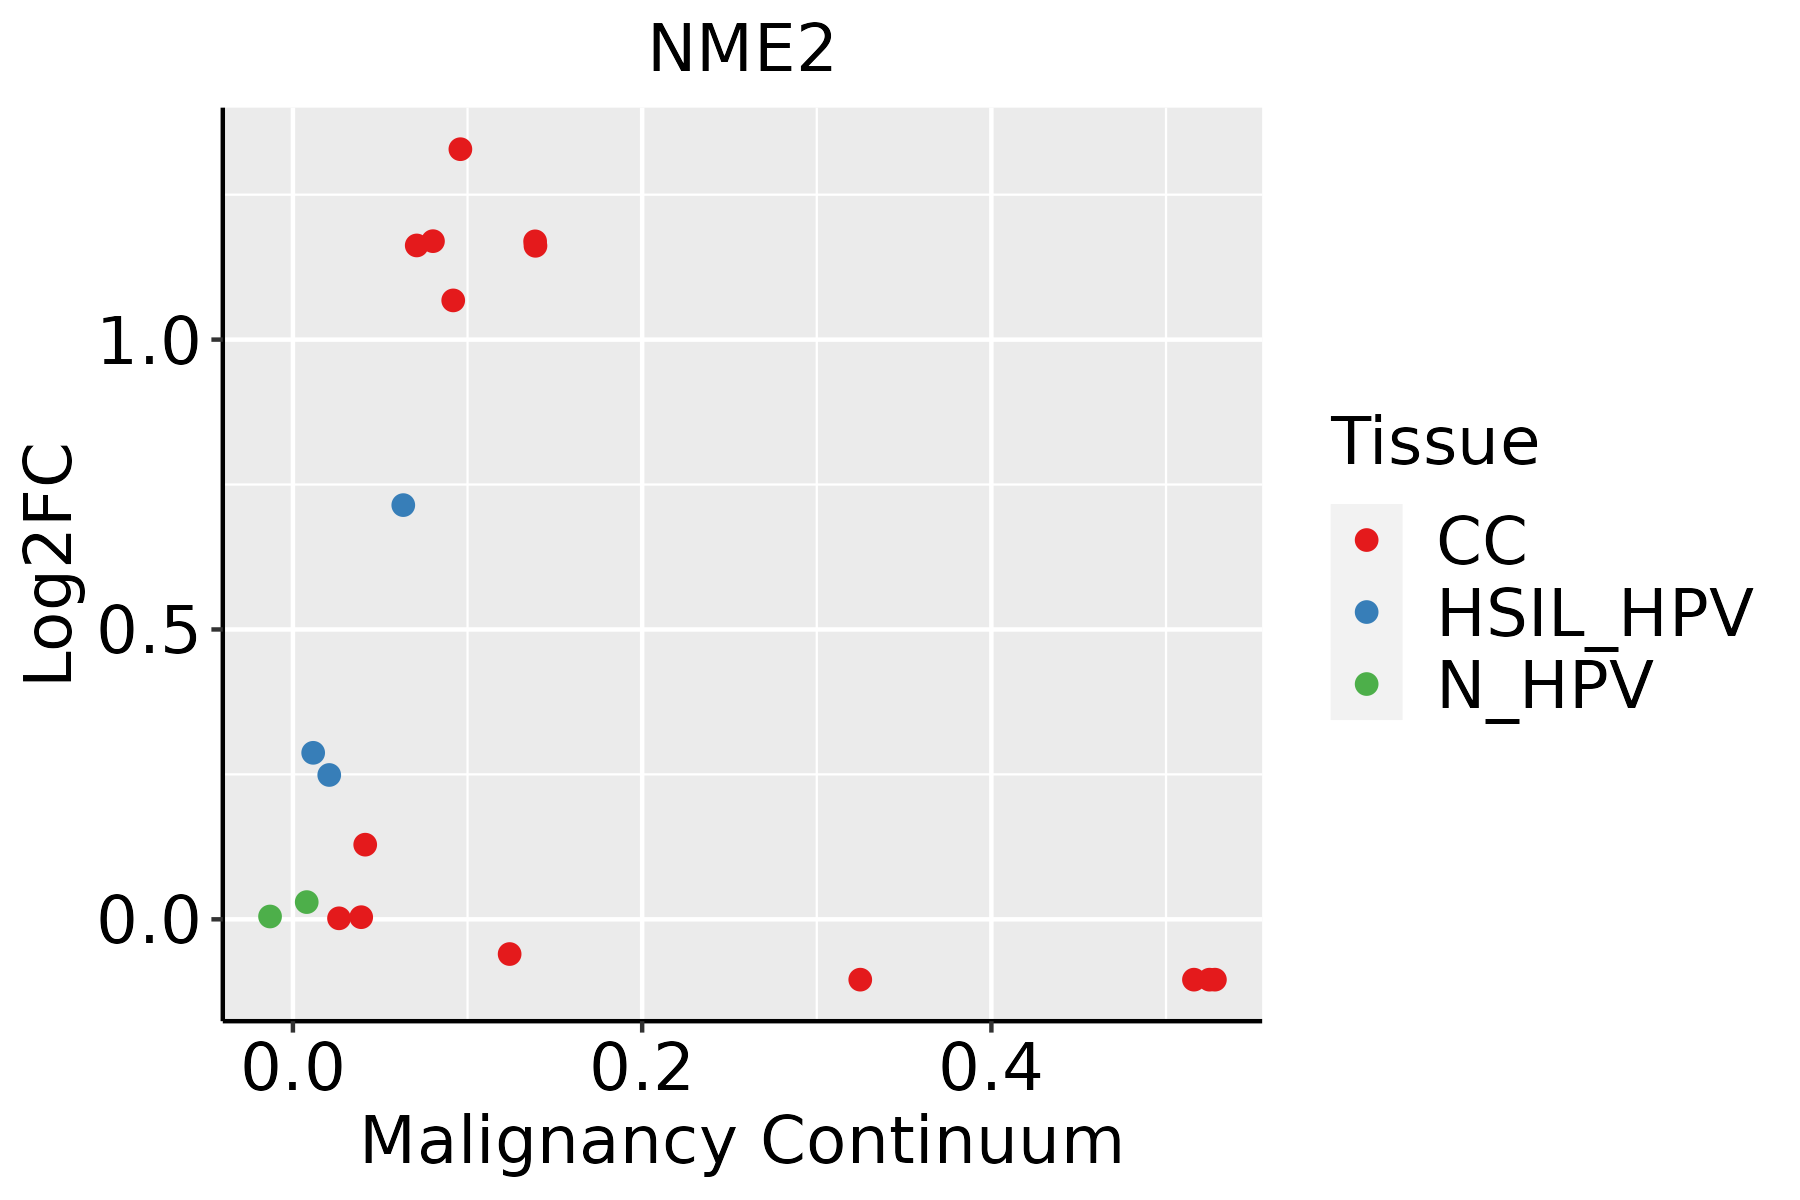 | CC: Cervix cancer |
| HSIL_HPV: HPV-infected high-grade squamous intraepithelial lesions | ||
| N_HPV: HPV-infected normal cervix | ||
| Colorectum (GSE201348) |  | FAP: Familial adenomatous polyposis |
| CRC: Colorectal cancer | ||
| Colorectum (HTA11) |  | AD: Adenomas |
| SER: Sessile serrated lesions | ||
| MSI-H: Microsatellite-high colorectal cancer | ||
| MSS: Microsatellite stable colorectal cancer | ||
| Endometrium | 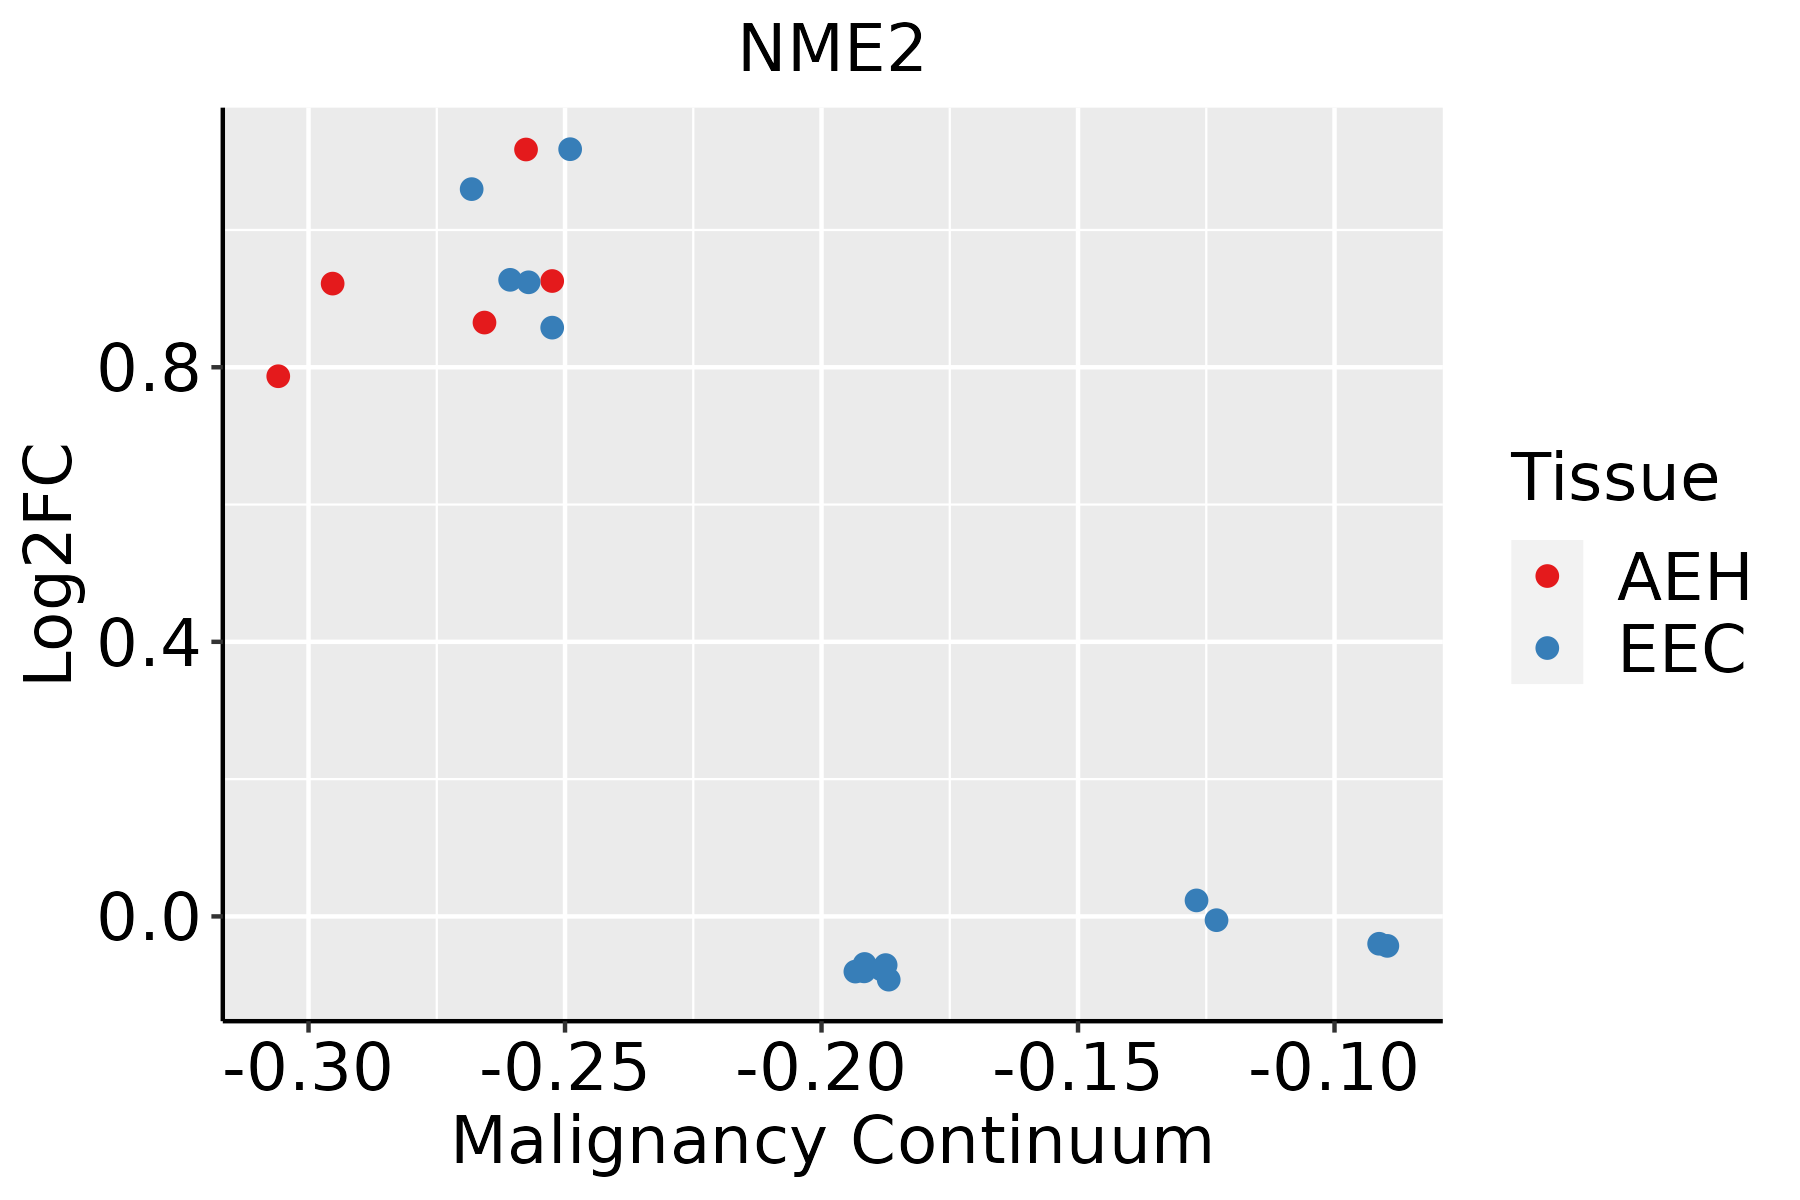 | AEH: Atypical endometrial hyperplasia |
| EEC: Endometrioid Cancer | ||
| Esophagus | 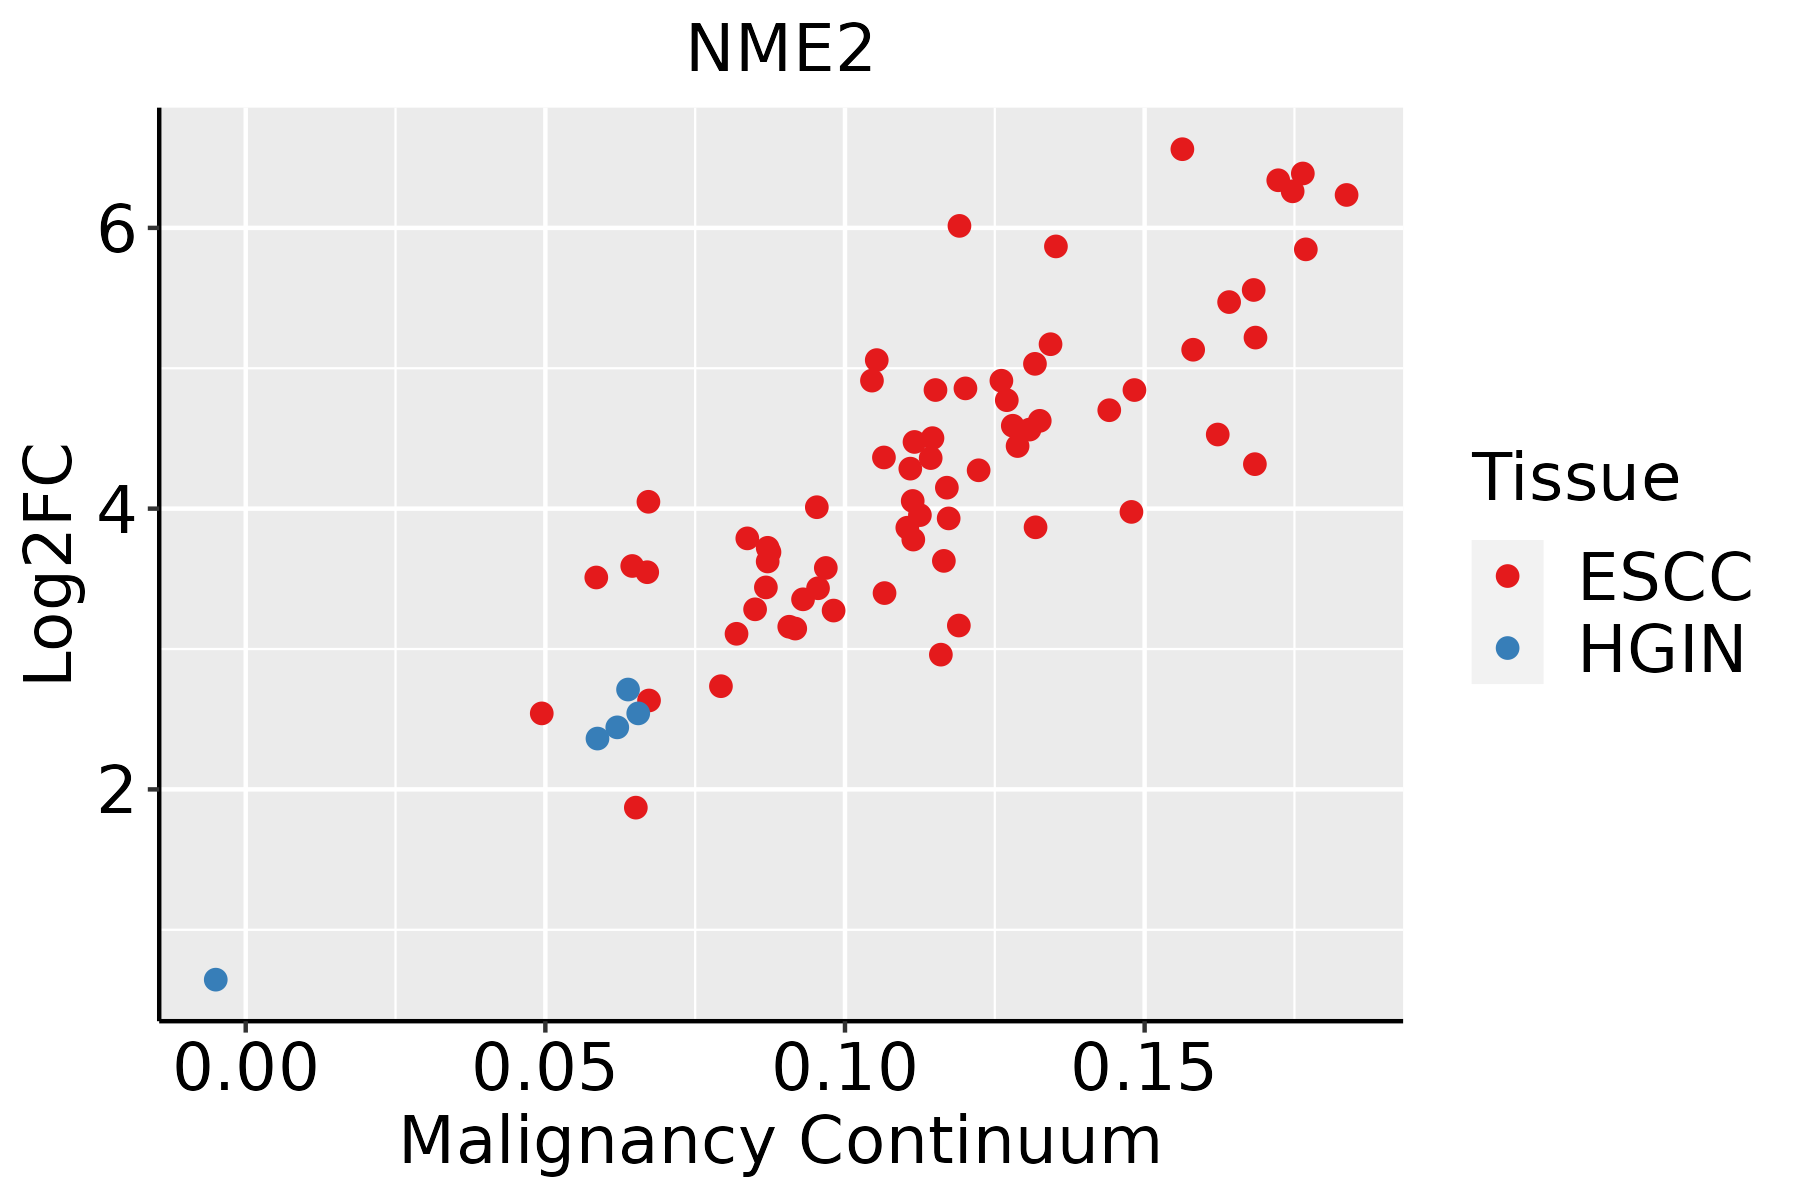 | ESCC: Esophageal squamous cell carcinoma |
| HGIN: High-grade intraepithelial neoplasias | ||
| LGIN: Low-grade intraepithelial neoplasias | ||
| GC | 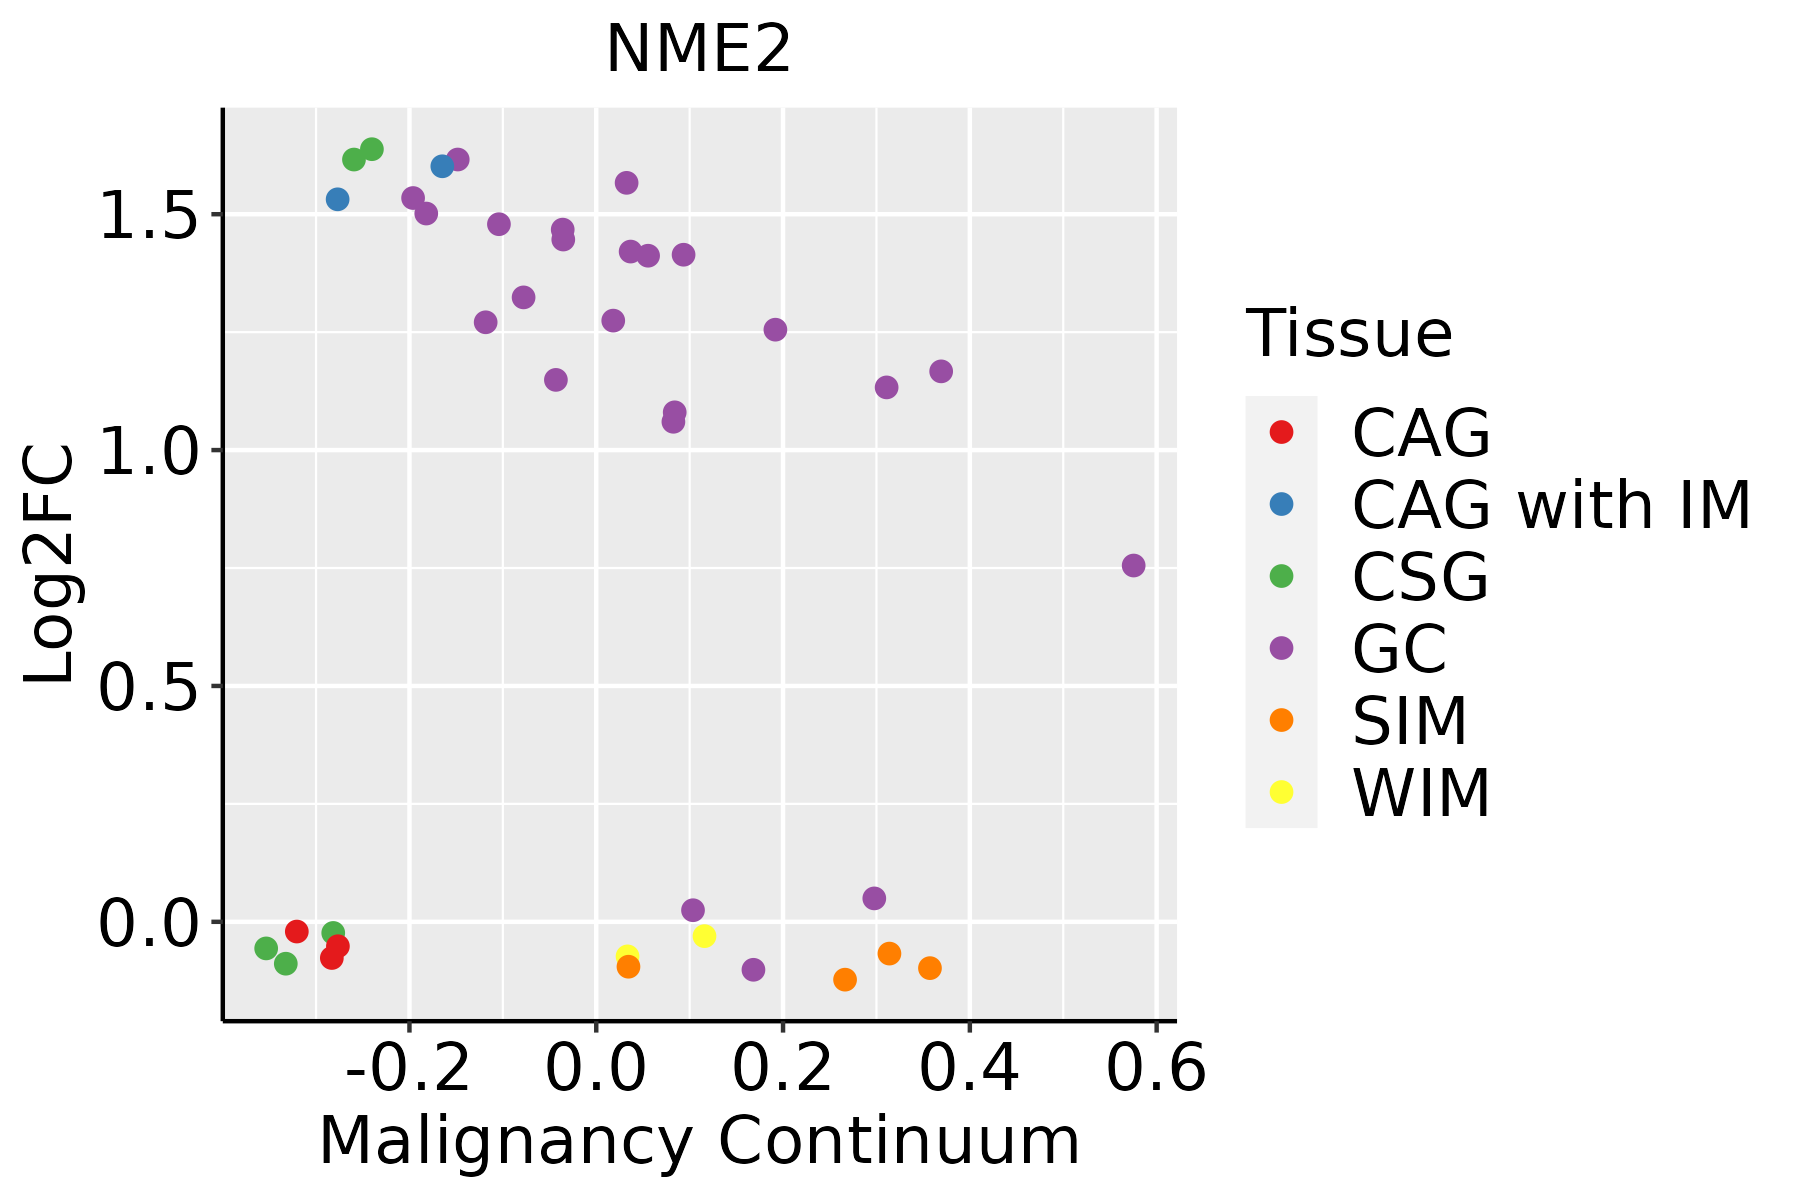 | CAG: Chronic atrophic gastritis |
| CAG with IM: Chronic atrophic gastritis with intestinal metaplasia | ||
| CSG: Chronic superficial gastritis | ||
| GC: Gastric cancer | ||
| SIM: Severe intestinal metaplasia | ||
| WIM: Wild intestinal metaplasia | ||
| Liver | 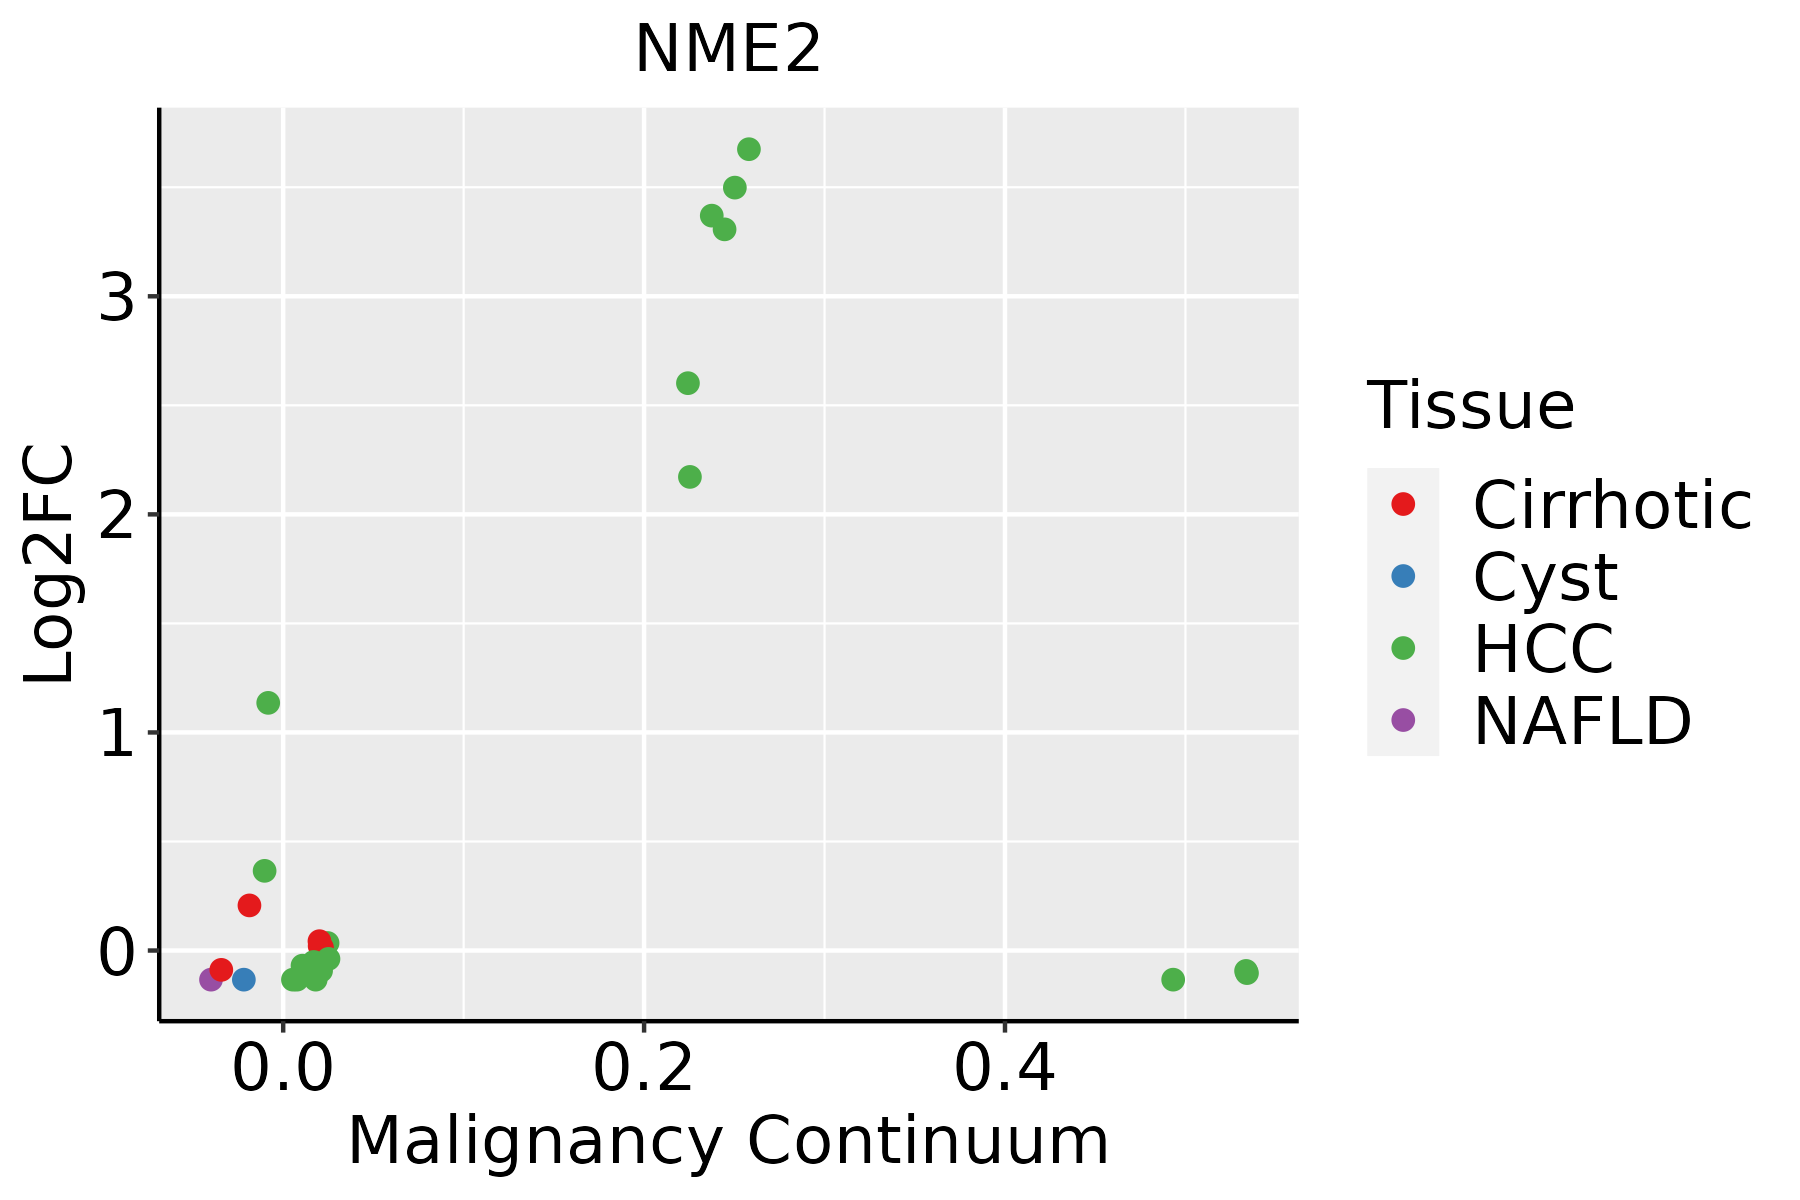 | HCC: Hepatocellular carcinoma |
| NAFLD: Non-alcoholic fatty liver disease | ||
| Lung |  | AAH: Atypical adenomatous hyperplasia |
| AIS: Adenocarcinoma in situ | ||
| IAC: Invasive lung adenocarcinoma | ||
| MIA: Minimally invasive adenocarcinoma | ||
| Oral Cavity | 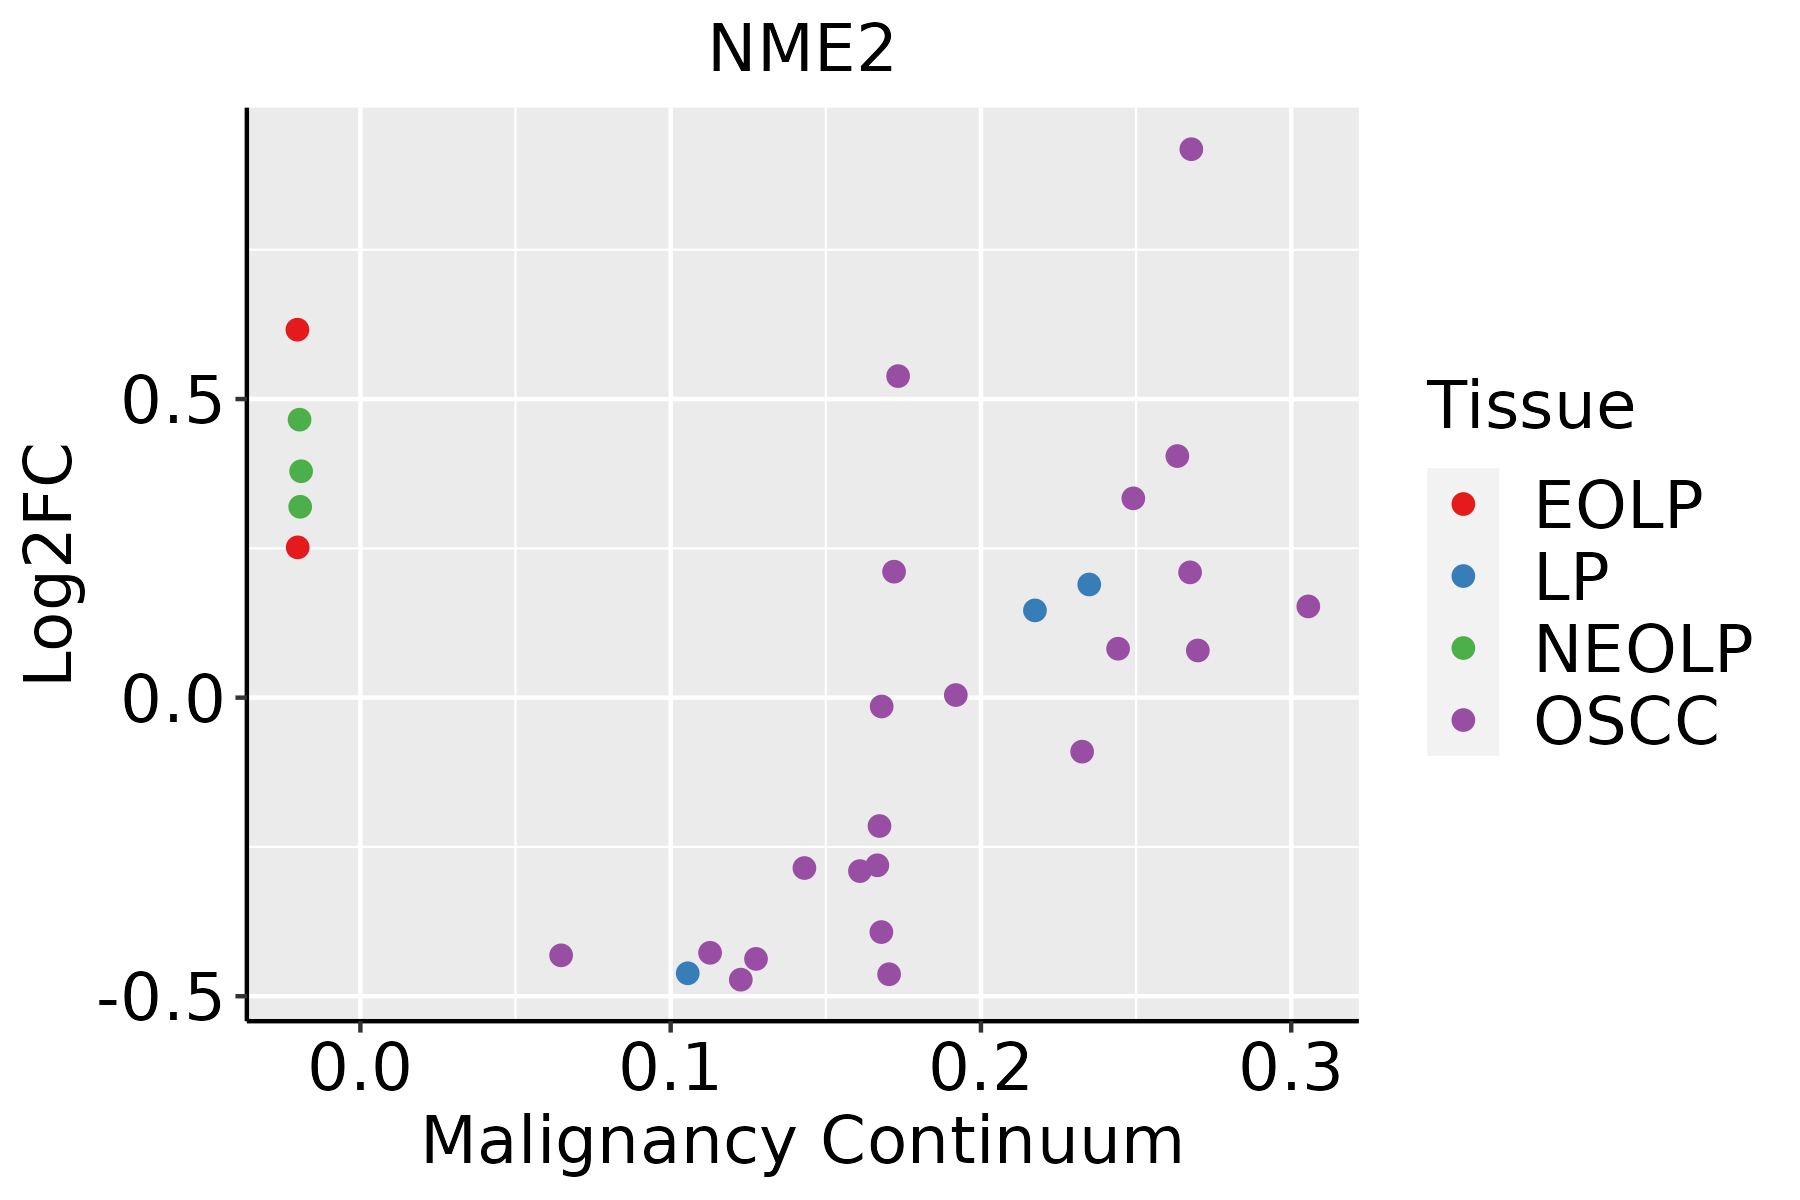 | EOLP: Erosive Oral lichen planus |
| LP: leukoplakia | ||
| NEOLP: Non-erosive oral lichen planus | ||
| OSCC: Oral squamous cell carcinoma | ||
| Prostate |  | BPH: Benign Prostatic Hyperplasia |
| Skin | 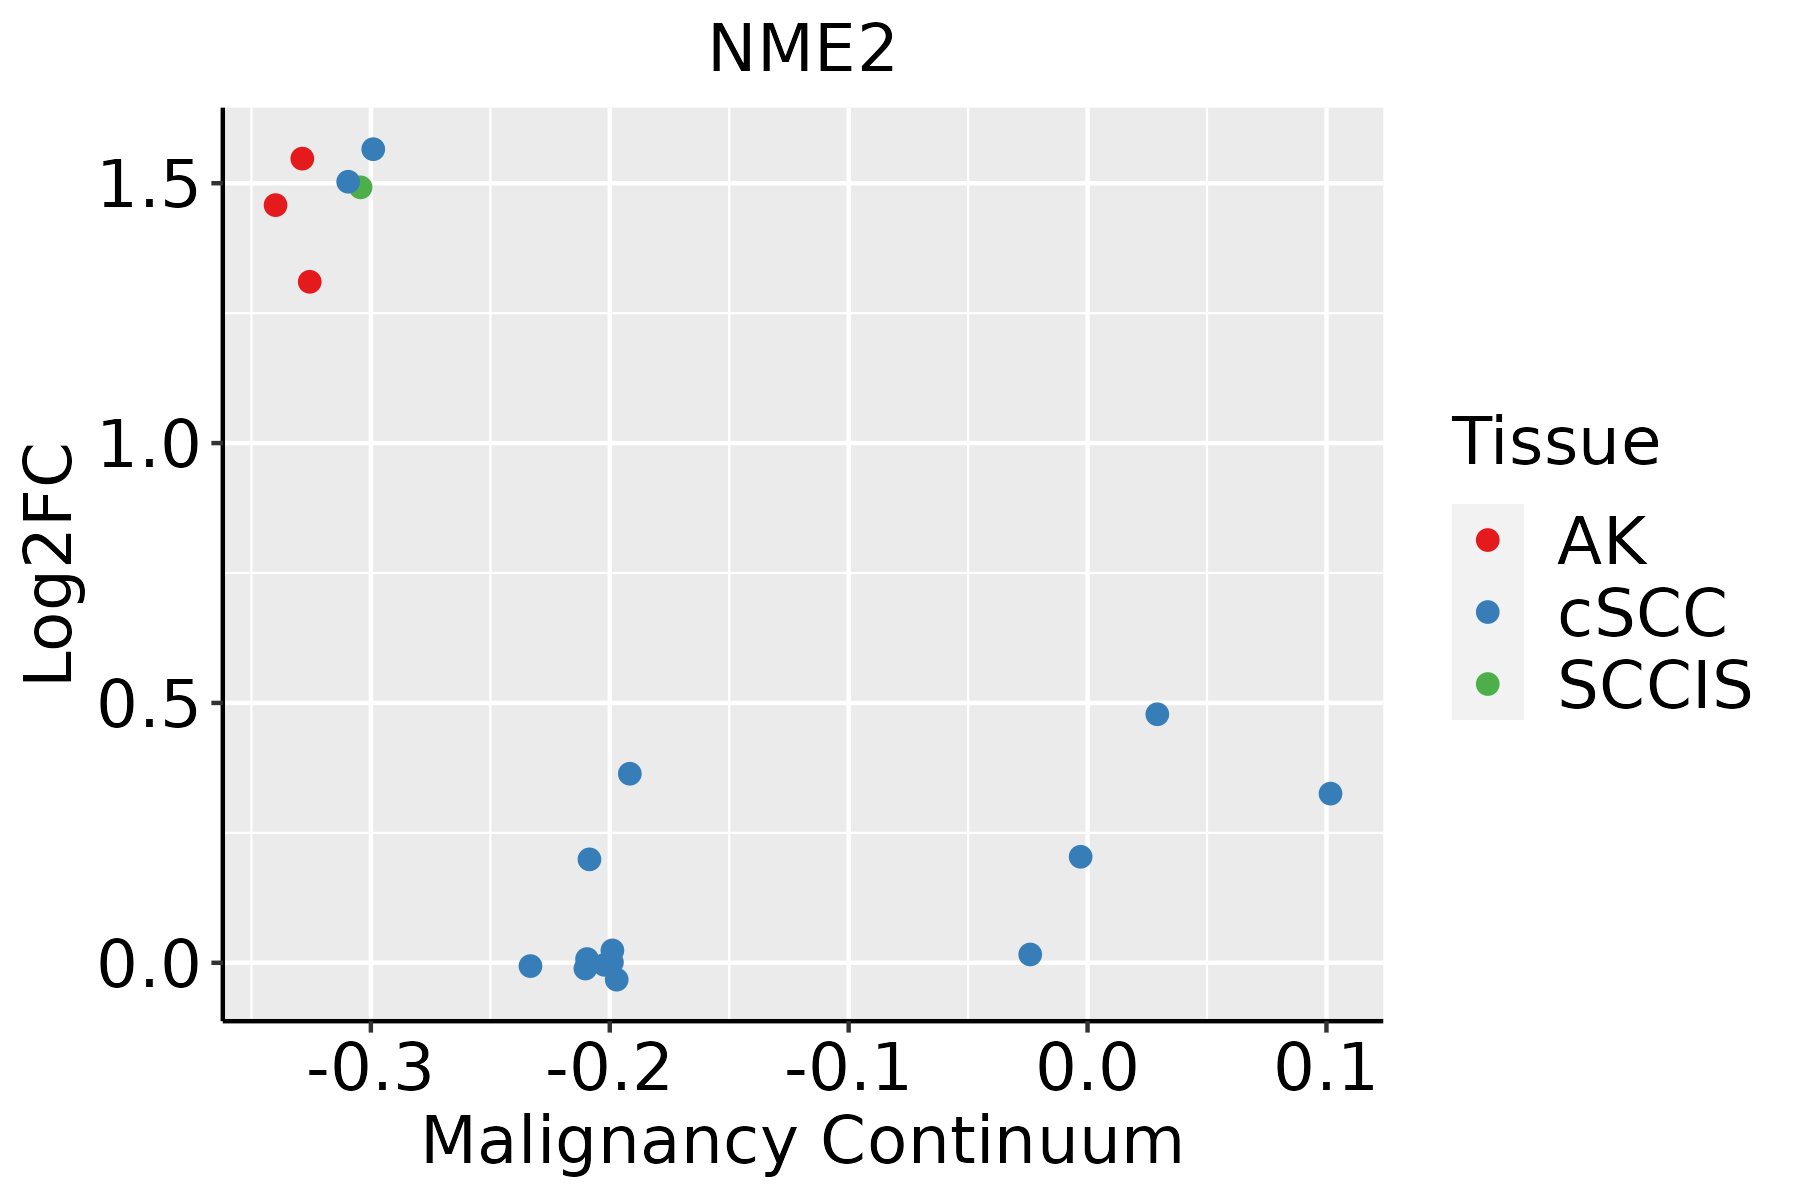 | AK: Actinic keratosis |
| cSCC: Cutaneous squamous cell carcinoma | ||
| SCCIS:squamous cell carcinoma in situ | ||
| Thyroid | 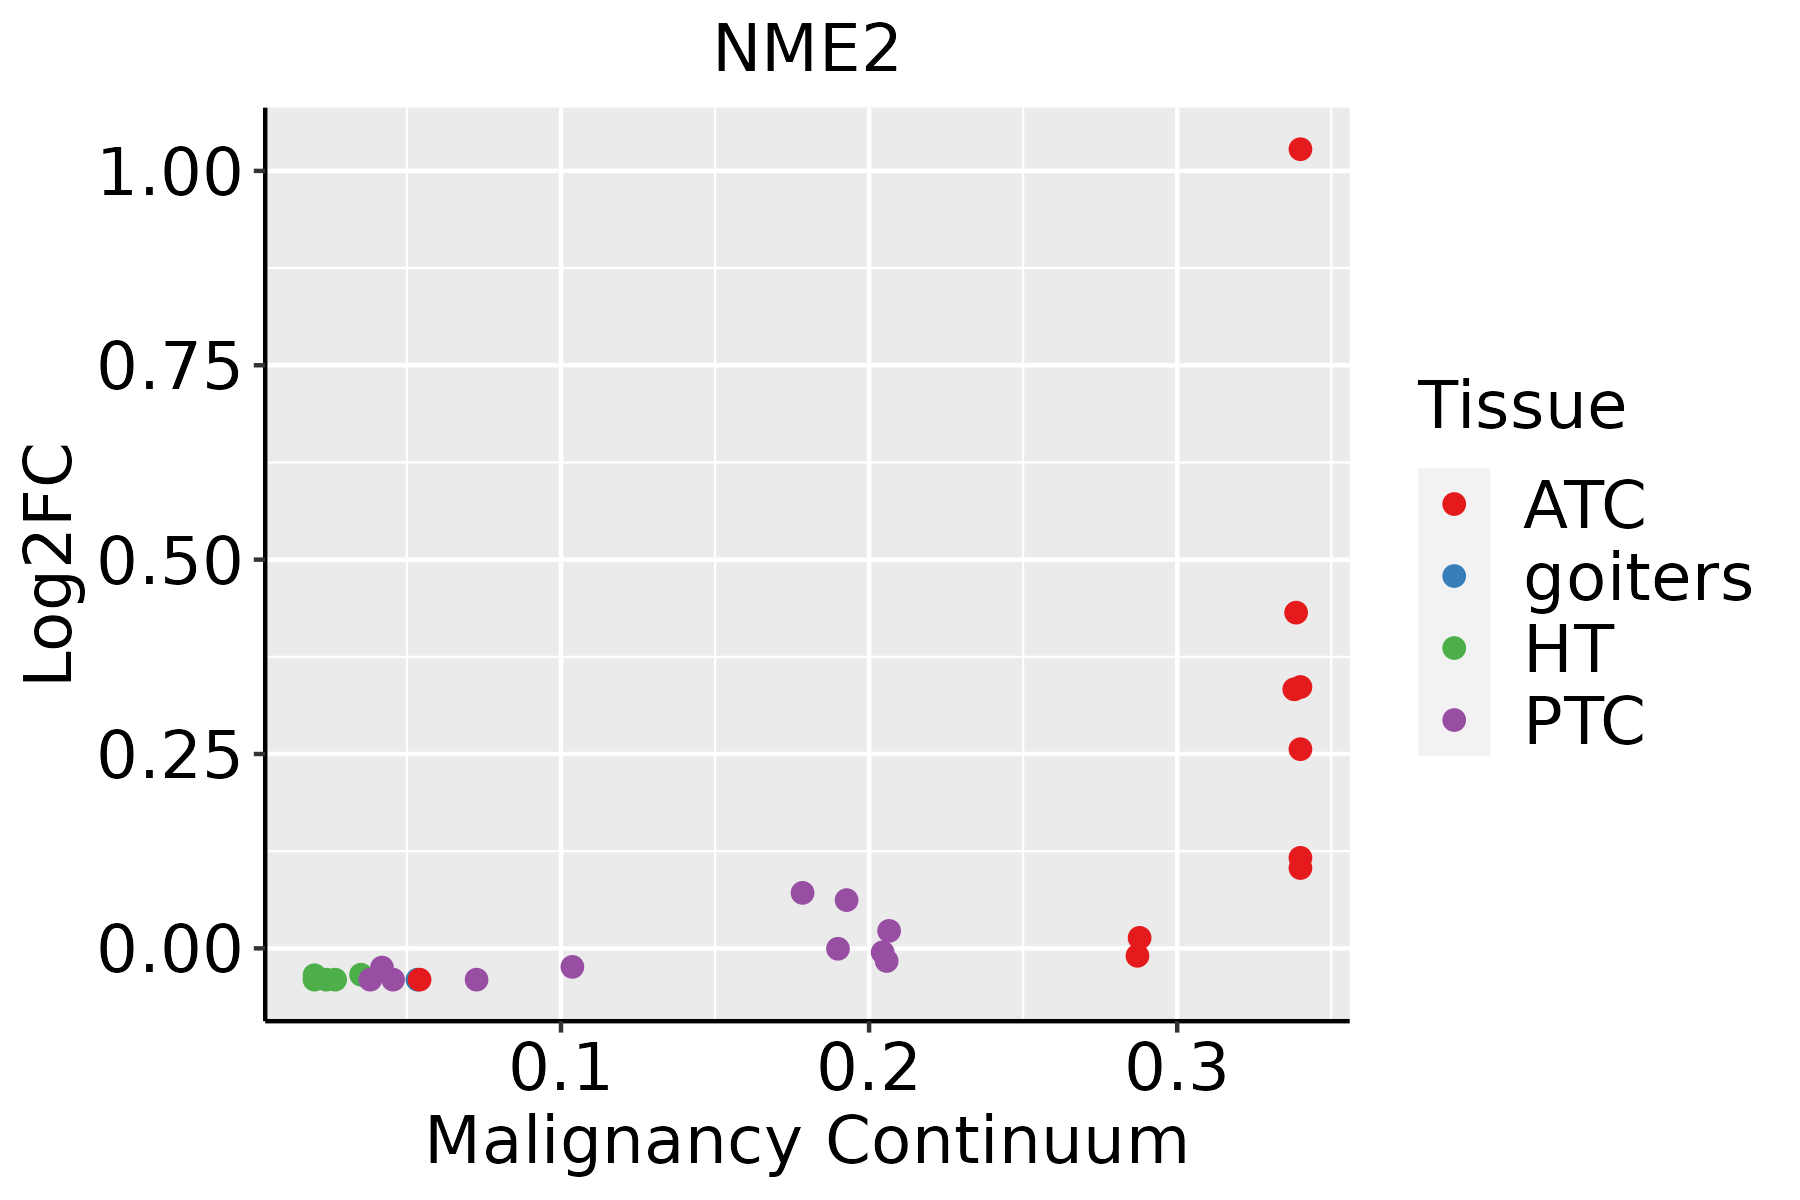 | ATC: Anaplastic thyroid cancer |
| HT: Hashimoto's thyroiditis | ||
| PTC: Papillary thyroid cancer |
| ∗log2FC in expression of this searched gene in stem-like cells from each diseased tissue sample relative to stem-like cells in normal samples in each tissue plotted against the malignancy continuum. Samples are colored based on if they are from different disease stage. |
Top |
Malignant transformation related pathway analysis |
| Find out the enriched GO biological processes and KEGG pathways involved in transition from healthy to precancer to cancer |
| Tissue | Disease Stage | Enriched GO biological Processes |
| Colorectum | AD |  |
| Colorectum | SER |  |
| Colorectum | MSS |  |
| Colorectum | MSI-H |  |
| Colorectum | FAP |  |
| ∗Top 15 enriched GO BP terms are showed in the bar plot of each disease state in each tissue. Each row represents a significant GO biological process which is colored according to the -log10(p.adjust). |
| Page: 1 2 3 4 5 6 7 8 9 |
| GO ID | Tissue | Disease Stage | Description | Gene Ratio | Bg Ratio | pvalue | p.adjust | Count |
| GO:00085446 | Cervix | CC | epidermis development | 83/2311 | 324/18723 | 3.91e-11 | 8.54e-09 | 83 |
| GO:00435884 | Cervix | CC | skin development | 71/2311 | 263/18723 | 8.04e-11 | 1.46e-08 | 71 |
| GO:000697910 | Cervix | CC | response to oxidative stress | 102/2311 | 446/18723 | 2.99e-10 | 4.36e-08 | 102 |
| GO:00506737 | Cervix | CC | epithelial cell proliferation | 98/2311 | 437/18723 | 2.01e-09 | 2.15e-07 | 98 |
| GO:00302164 | Cervix | CC | keratinocyte differentiation | 42/2311 | 139/18723 | 1.74e-08 | 1.28e-06 | 42 |
| GO:00026837 | Cervix | CC | negative regulation of immune system process | 94/2311 | 434/18723 | 2.63e-08 | 1.87e-06 | 94 |
| GO:00099137 | Cervix | CC | epidermal cell differentiation | 53/2311 | 202/18723 | 5.48e-08 | 3.25e-06 | 53 |
| GO:00072295 | Cervix | CC | integrin-mediated signaling pathway | 34/2311 | 107/18723 | 1.01e-07 | 5.25e-06 | 34 |
| GO:006219710 | Cervix | CC | cellular response to chemical stress | 76/2311 | 337/18723 | 1.01e-07 | 5.25e-06 | 76 |
| GO:003009910 | Cervix | CC | myeloid cell differentiation | 83/2311 | 381/18723 | 1.31e-07 | 6.42e-06 | 83 |
| GO:00506787 | Cervix | CC | regulation of epithelial cell proliferation | 83/2311 | 381/18723 | 1.31e-07 | 6.42e-06 | 83 |
| GO:190370610 | Cervix | CC | regulation of hemopoiesis | 80/2311 | 367/18723 | 2.14e-07 | 9.55e-06 | 80 |
| GO:00091449 | Cervix | CC | purine nucleoside triphosphate metabolic process | 29/2311 | 88/18723 | 3.62e-07 | 1.45e-05 | 29 |
| GO:00092058 | Cervix | CC | purine ribonucleoside triphosphate metabolic process | 27/2311 | 82/18723 | 9.24e-07 | 3.25e-05 | 27 |
| GO:00091458 | Cervix | CC | purine nucleoside triphosphate biosynthetic process | 24/2311 | 69/18723 | 1.21e-06 | 4.15e-05 | 24 |
| GO:00091998 | Cervix | CC | ribonucleoside triphosphate metabolic process | 28/2311 | 89/18723 | 1.65e-06 | 5.44e-05 | 28 |
| GO:00092068 | Cervix | CC | purine ribonucleoside triphosphate biosynthetic process | 23/2311 | 68/18723 | 3.47e-06 | 9.26e-05 | 23 |
| GO:003459910 | Cervix | CC | cellular response to oxidative stress | 63/2311 | 288/18723 | 3.58e-06 | 9.50e-05 | 63 |
| GO:00109757 | Cervix | CC | regulation of neuron projection development | 88/2311 | 445/18723 | 4.26e-06 | 1.09e-04 | 88 |
| GO:00092018 | Cervix | CC | ribonucleoside triphosphate biosynthetic process | 24/2311 | 74/18723 | 4.95e-06 | 1.24e-04 | 24 |
| Page: 1 2 3 4 5 6 7 8 9 10 11 12 13 14 15 16 17 18 19 20 21 22 23 24 25 26 27 28 29 30 31 32 33 34 35 36 37 38 39 40 41 42 43 44 45 46 47 48 49 50 51 52 53 54 55 56 57 58 59 60 61 62 63 64 65 66 67 68 69 70 71 |
| Pathway ID | Tissue | Disease Stage | Description | Gene Ratio | Bg Ratio | pvalue | p.adjust | qvalue | Count |
| hsa012325 | Esophagus | ESCC | Nucleotide metabolism | 59/4205 | 85/8465 | 1.67e-04 | 6.58e-04 | 3.37e-04 | 59 |
| hsa012405 | Esophagus | ESCC | Biosynthesis of cofactors | 97/4205 | 153/8465 | 3.88e-04 | 1.35e-03 | 6.94e-04 | 97 |
| hsa002405 | Esophagus | ESCC | Pyrimidine metabolism | 41/4205 | 58/8465 | 9.14e-04 | 2.92e-03 | 1.49e-03 | 41 |
| hsa0123212 | Esophagus | ESCC | Nucleotide metabolism | 59/4205 | 85/8465 | 1.67e-04 | 6.58e-04 | 3.37e-04 | 59 |
| hsa0124012 | Esophagus | ESCC | Biosynthesis of cofactors | 97/4205 | 153/8465 | 3.88e-04 | 1.35e-03 | 6.94e-04 | 97 |
| hsa0024012 | Esophagus | ESCC | Pyrimidine metabolism | 41/4205 | 58/8465 | 9.14e-04 | 2.92e-03 | 1.49e-03 | 41 |
| hsa01240 | Liver | Cirrhotic | Biosynthesis of cofactors | 66/2530 | 153/8465 | 3.11e-04 | 1.99e-03 | 1.23e-03 | 66 |
| hsa01232 | Liver | Cirrhotic | Nucleotide metabolism | 39/2530 | 85/8465 | 1.27e-03 | 6.73e-03 | 4.15e-03 | 39 |
| hsa00240 | Liver | Cirrhotic | Pyrimidine metabolism | 27/2530 | 58/8465 | 5.31e-03 | 1.88e-02 | 1.16e-02 | 27 |
| hsa00983 | Liver | Cirrhotic | Drug metabolism - other enzymes | 34/2530 | 80/8465 | 1.08e-02 | 3.57e-02 | 2.20e-02 | 34 |
| hsa012401 | Liver | Cirrhotic | Biosynthesis of cofactors | 66/2530 | 153/8465 | 3.11e-04 | 1.99e-03 | 1.23e-03 | 66 |
| hsa012321 | Liver | Cirrhotic | Nucleotide metabolism | 39/2530 | 85/8465 | 1.27e-03 | 6.73e-03 | 4.15e-03 | 39 |
| hsa002401 | Liver | Cirrhotic | Pyrimidine metabolism | 27/2530 | 58/8465 | 5.31e-03 | 1.88e-02 | 1.16e-02 | 27 |
| hsa009831 | Liver | Cirrhotic | Drug metabolism - other enzymes | 34/2530 | 80/8465 | 1.08e-02 | 3.57e-02 | 2.20e-02 | 34 |
| hsa012402 | Liver | HCC | Biosynthesis of cofactors | 103/4020 | 153/8465 | 4.67e-07 | 5.05e-06 | 2.81e-06 | 103 |
| hsa002402 | Liver | HCC | Pyrimidine metabolism | 44/4020 | 58/8465 | 9.34e-06 | 7.11e-05 | 3.95e-05 | 44 |
| hsa012322 | Liver | HCC | Nucleotide metabolism | 59/4020 | 85/8465 | 3.30e-05 | 1.88e-04 | 1.04e-04 | 59 |
| hsa009832 | Liver | HCC | Drug metabolism - other enzymes | 54/4020 | 80/8465 | 2.25e-04 | 1.09e-03 | 6.08e-04 | 54 |
| hsa012403 | Liver | HCC | Biosynthesis of cofactors | 103/4020 | 153/8465 | 4.67e-07 | 5.05e-06 | 2.81e-06 | 103 |
| hsa002403 | Liver | HCC | Pyrimidine metabolism | 44/4020 | 58/8465 | 9.34e-06 | 7.11e-05 | 3.95e-05 | 44 |
| Page: 1 2 |
Top |
Cell-cell communication analysis |
| Identification of potential cell-cell interactions between two cell types and their ligand-receptor pairs for different disease states |
| Ligand | Receptor | LRpair | Pathway | Tissue | Disease Stage |
| Page: 1 |
Top |
Single-cell gene regulatory network inference analysis |
| Find out the significant the regulons (TFs) and the target genes of each regulon across cell types for different disease states |
| TF | Cell Type | Tissue | Disease Stage | Target Gene | RSS | Regulon Activity |
| ∗The dot plots of a searched regulon are shown for all cell subpopulations in each disease state of each tissue based on the regulon specific score inferred using pySCENIC and by calculating the average expression. |
| Page: 1 |
Top |
Somatic mutation of malignant transformation related genes |
| Annotation of somatic variants for genes involved in malignant transformation |
| Hugo Symbol | Variant Class | Variant Classification | dbSNP RS | HGVSc | HGVSp | HGVSp Short | SWISSPROT | BIOTYPE | SIFT | PolyPhen | Tumor Sample Barcode | Tissue | Histology | Sex | Age | Stage | Therapy Types | Drugs | Outcome |
| NME2 | SNV | Missense_Mutation | novel | c.290N>T | p.Ala97Val | p.A97V | P22392 | protein_coding | tolerated(0.17) | benign(0.013) | TCGA-AC-A23H-01 | Breast | breast invasive carcinoma | Female | >=65 | I/II | Unknown | Unknown | PD |
| NME2 | SNV | Missense_Mutation | rs757730632 | c.247N>A | p.Val83Met | p.V83M | P22392 | protein_coding | deleterious(0.01) | possibly_damaging(0.585) | TCGA-AP-A059-01 | Endometrium | uterine corpus endometrioid carcinoma | Female | >=65 | I/II | Unknown | Unknown | SD |
| NME2 | SNV | Missense_Mutation | rs757730632 | c.247N>A | p.Val83Met | p.V83M | P22392 | protein_coding | deleterious(0.01) | possibly_damaging(0.585) | TCGA-BG-A221-01 | Endometrium | uterine corpus endometrioid carcinoma | Female | >=65 | I/II | Unknown | Unknown | SD |
| NME2 | SNV | Missense_Mutation | novel | c.335T>G | p.Val112Gly | p.V112G | P22392 | protein_coding | deleterious(0.04) | benign(0.168) | TCGA-BS-A0UA-01 | Endometrium | uterine corpus endometrioid carcinoma | Female | >=65 | I/II | Unknown | Unknown | PD |
| NME2 | SNV | Missense_Mutation | novel | c.439N>T | p.His147Tyr | p.H147Y | P22392 | protein_coding | tolerated(0.48) | benign(0) | TCGA-21-5783-01 | Lung | lung squamous cell carcinoma | Male | >=65 | I/II | Unknown | Unknown | SD |
| NME2 | SNV | Missense_Mutation | rs777392074 | c.263G>A | p.Arg88Gln | p.R88Q | P22392 | protein_coding | deleterious(0.02) | benign(0.3) | TCGA-HD-A4C1-01 | Oral cavity | head & neck squamous cell carcinoma | Female | <65 | I/II | Unknown | Unknown | SD |
| NME2 | SNV | Missense_Mutation | rs377454242 | c.314N>A | p.Arg105His | p.R105H | P22392 | protein_coding | deleterious(0.04) | possibly_damaging(0.786) | TCGA-BR-8487-01 | Stomach | stomach adenocarcinoma | Female | <65 | I/II | Unknown | Unknown | SD |
| Page: 1 |
Top |
Related drugs of malignant transformation related genes |
| Identification of chemicals and drugs interact with genes involved in malignant transfromation |
| (DGIdb 4.0) |
| Entrez ID | Symbol | Category | Interaction Types | Drug Claim Name | Drug Name | PMIDs |
| 4831 | NME2 | KINASE | zidovudine | ZIDOVUDINE | 22960662 | |
| 4831 | NME2 | KINASE | lamivudine | LAMIVUDINE | ||
| 4831 | NME2 | KINASE | tenofovir | TENOFOVIR | ||
| 4831 | NME2 | KINASE | adefovir dipivoxil | |||
| 4831 | NME2 | KINASE | PROGESTERONE | PROGESTERONE | 15674352 |
| Page: 1 |

Copyright 2023-Present -The University of Texas Health Science Center at Houston |