
|
|||||
|
 | |
| |
| |
| |
| |
| |
|
Gene: NMD3 |
Gene summary for NMD3 |
| Gene information | Species | Human | Gene symbol | NMD3 | Gene ID | 51068 |
| Gene name | NMD3 ribosome export adaptor | |
| Gene Alias | CGI-07 | |
| Cytomap | 3q26.1 | |
| Gene Type | protein-coding | GO ID | GO:0000054 | UniProtAcc | C9JA08 |
Top |
Malignant transformation analysis |
| Identification of the aberrant gene expression in precancerous and cancerous lesions by comparing the gene expression of stem-like cells in diseased tissues with normal stem cells |
| Entrez ID | Symbol | Replicates | Species | Organ | Tissue | Adj P-value | Log2FC | Malignancy |
| 51068 | NMD3 | LZE2D | Human | Esophagus | HGIN | 3.74e-02 | 1.08e-01 | 0.0642 |
| 51068 | NMD3 | LZE2T | Human | Esophagus | ESCC | 1.68e-02 | 6.79e-01 | 0.082 |
| 51068 | NMD3 | LZE4T | Human | Esophagus | ESCC | 3.07e-14 | 4.53e-01 | 0.0811 |
| 51068 | NMD3 | LZE7T | Human | Esophagus | ESCC | 2.58e-05 | 3.36e-01 | 0.0667 |
| 51068 | NMD3 | LZE8T | Human | Esophagus | ESCC | 1.13e-05 | -2.35e-03 | 0.067 |
| 51068 | NMD3 | LZE20T | Human | Esophagus | ESCC | 4.87e-06 | 2.32e-01 | 0.0662 |
| 51068 | NMD3 | LZE24T | Human | Esophagus | ESCC | 6.65e-15 | 5.47e-01 | 0.0596 |
| 51068 | NMD3 | LZE21T | Human | Esophagus | ESCC | 5.21e-07 | 6.56e-01 | 0.0655 |
| 51068 | NMD3 | LZE6T | Human | Esophagus | ESCC | 8.25e-04 | 2.24e-01 | 0.0845 |
| 51068 | NMD3 | P1T-E | Human | Esophagus | ESCC | 3.13e-08 | 2.01e-01 | 0.0875 |
| 51068 | NMD3 | P2T-E | Human | Esophagus | ESCC | 1.47e-41 | 7.89e-01 | 0.1177 |
| 51068 | NMD3 | P4T-E | Human | Esophagus | ESCC | 1.76e-36 | 7.40e-01 | 0.1323 |
| 51068 | NMD3 | P5T-E | Human | Esophagus | ESCC | 6.05e-30 | 5.97e-01 | 0.1327 |
| 51068 | NMD3 | P8T-E | Human | Esophagus | ESCC | 5.72e-44 | 7.90e-01 | 0.0889 |
| 51068 | NMD3 | P9T-E | Human | Esophagus | ESCC | 8.88e-21 | 4.42e-01 | 0.1131 |
| 51068 | NMD3 | P10T-E | Human | Esophagus | ESCC | 4.84e-41 | 6.17e-01 | 0.116 |
| 51068 | NMD3 | P11T-E | Human | Esophagus | ESCC | 4.30e-07 | 5.23e-01 | 0.1426 |
| 51068 | NMD3 | P12T-E | Human | Esophagus | ESCC | 9.30e-25 | 4.03e-01 | 0.1122 |
| 51068 | NMD3 | P15T-E | Human | Esophagus | ESCC | 9.26e-37 | 8.73e-01 | 0.1149 |
| 51068 | NMD3 | P16T-E | Human | Esophagus | ESCC | 2.80e-42 | 7.71e-01 | 0.1153 |
| Page: 1 2 3 4 5 6 |
| Tissue | Expression Dynamics | Abbreviation |
| Esophagus | 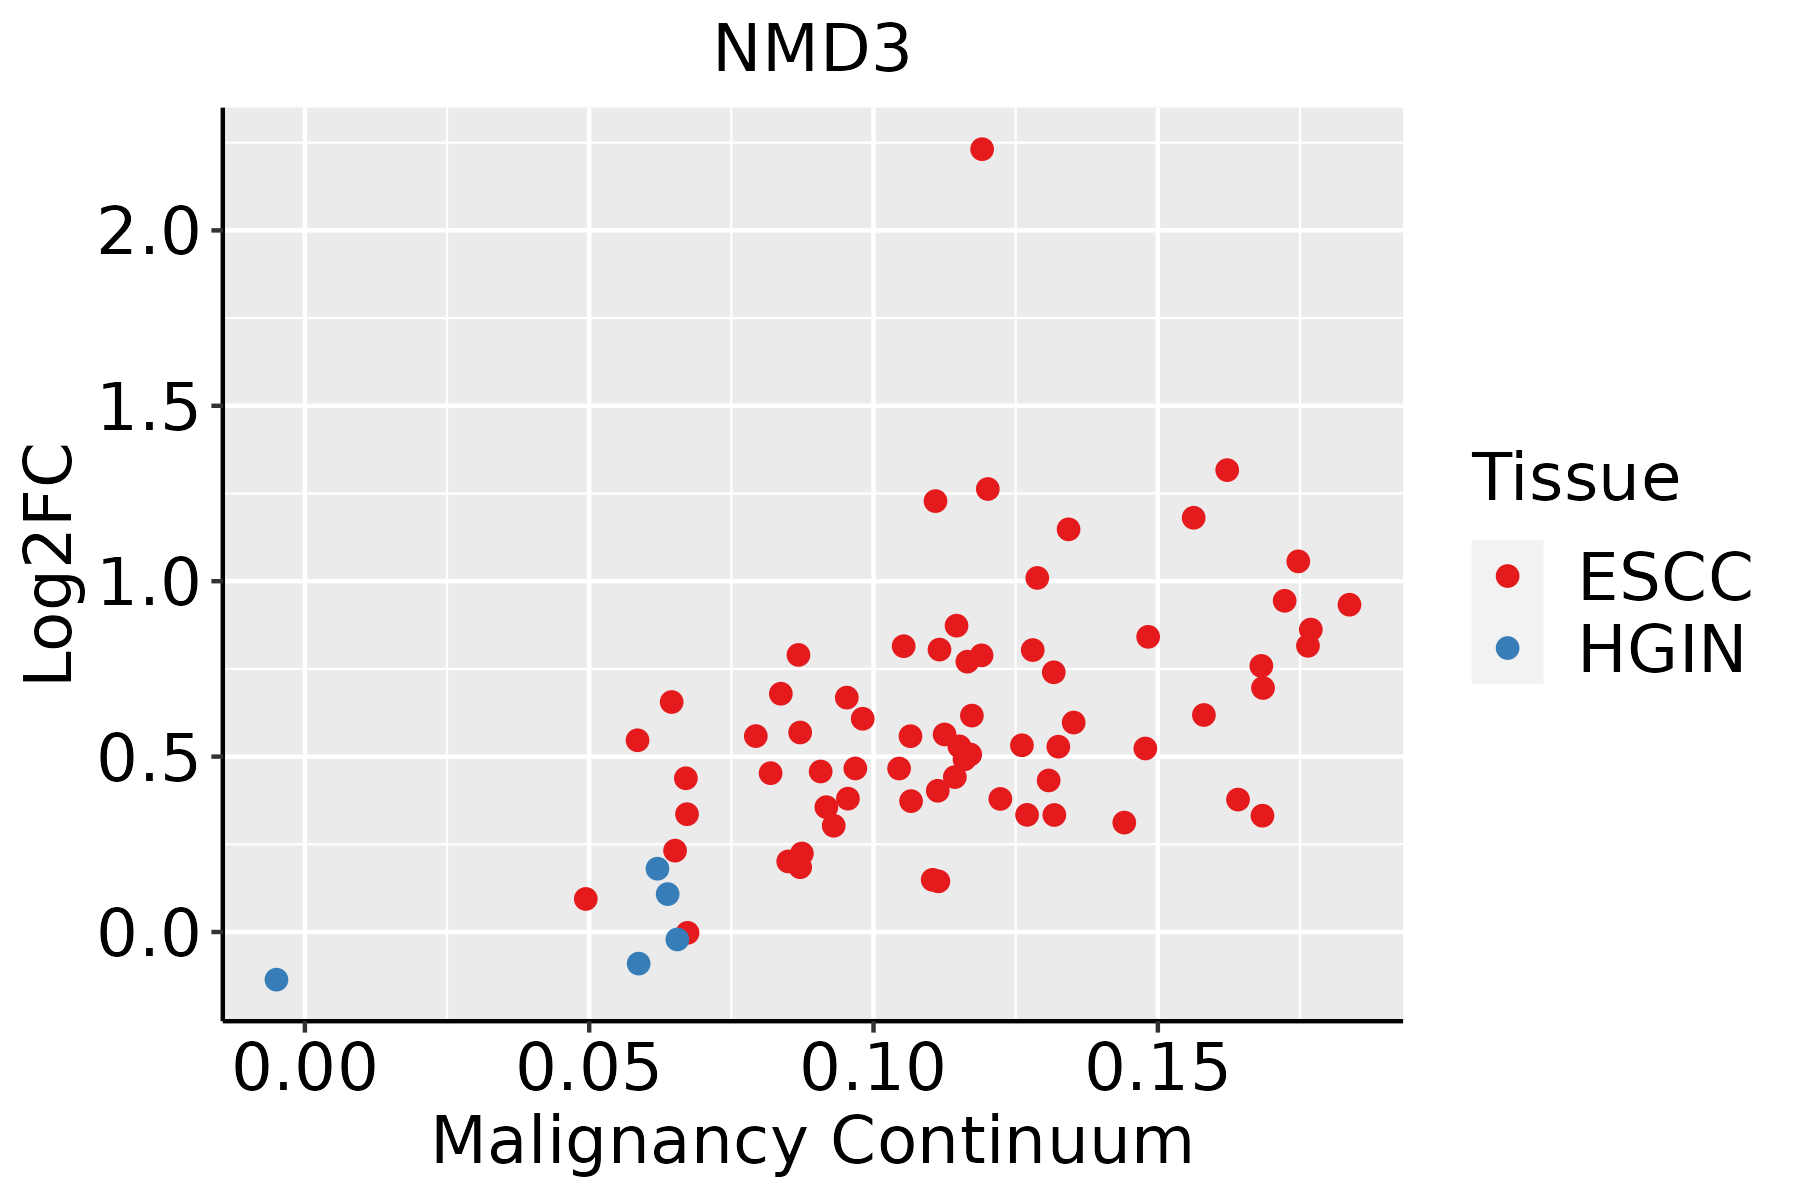 | ESCC: Esophageal squamous cell carcinoma |
| HGIN: High-grade intraepithelial neoplasias | ||
| LGIN: Low-grade intraepithelial neoplasias | ||
| Liver | 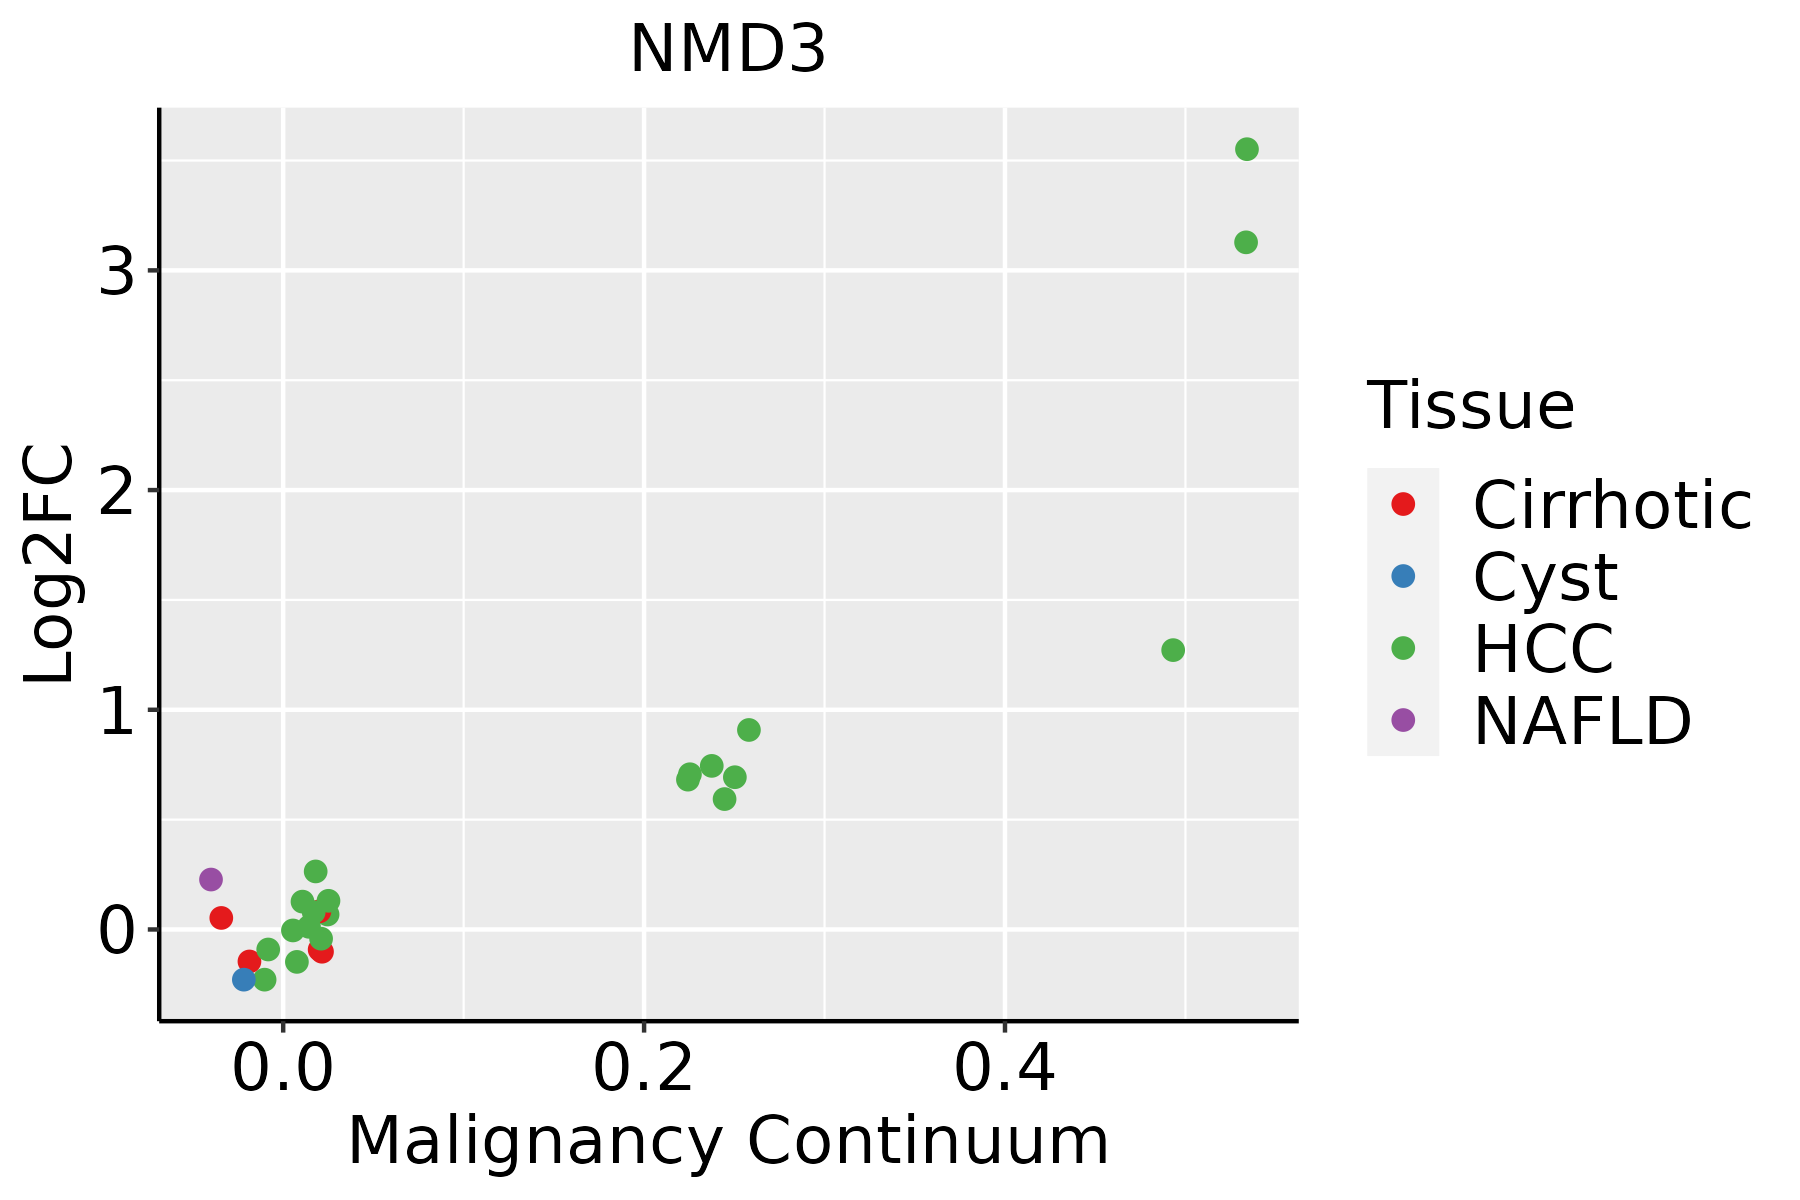 | HCC: Hepatocellular carcinoma |
| NAFLD: Non-alcoholic fatty liver disease | ||
| Oral Cavity | 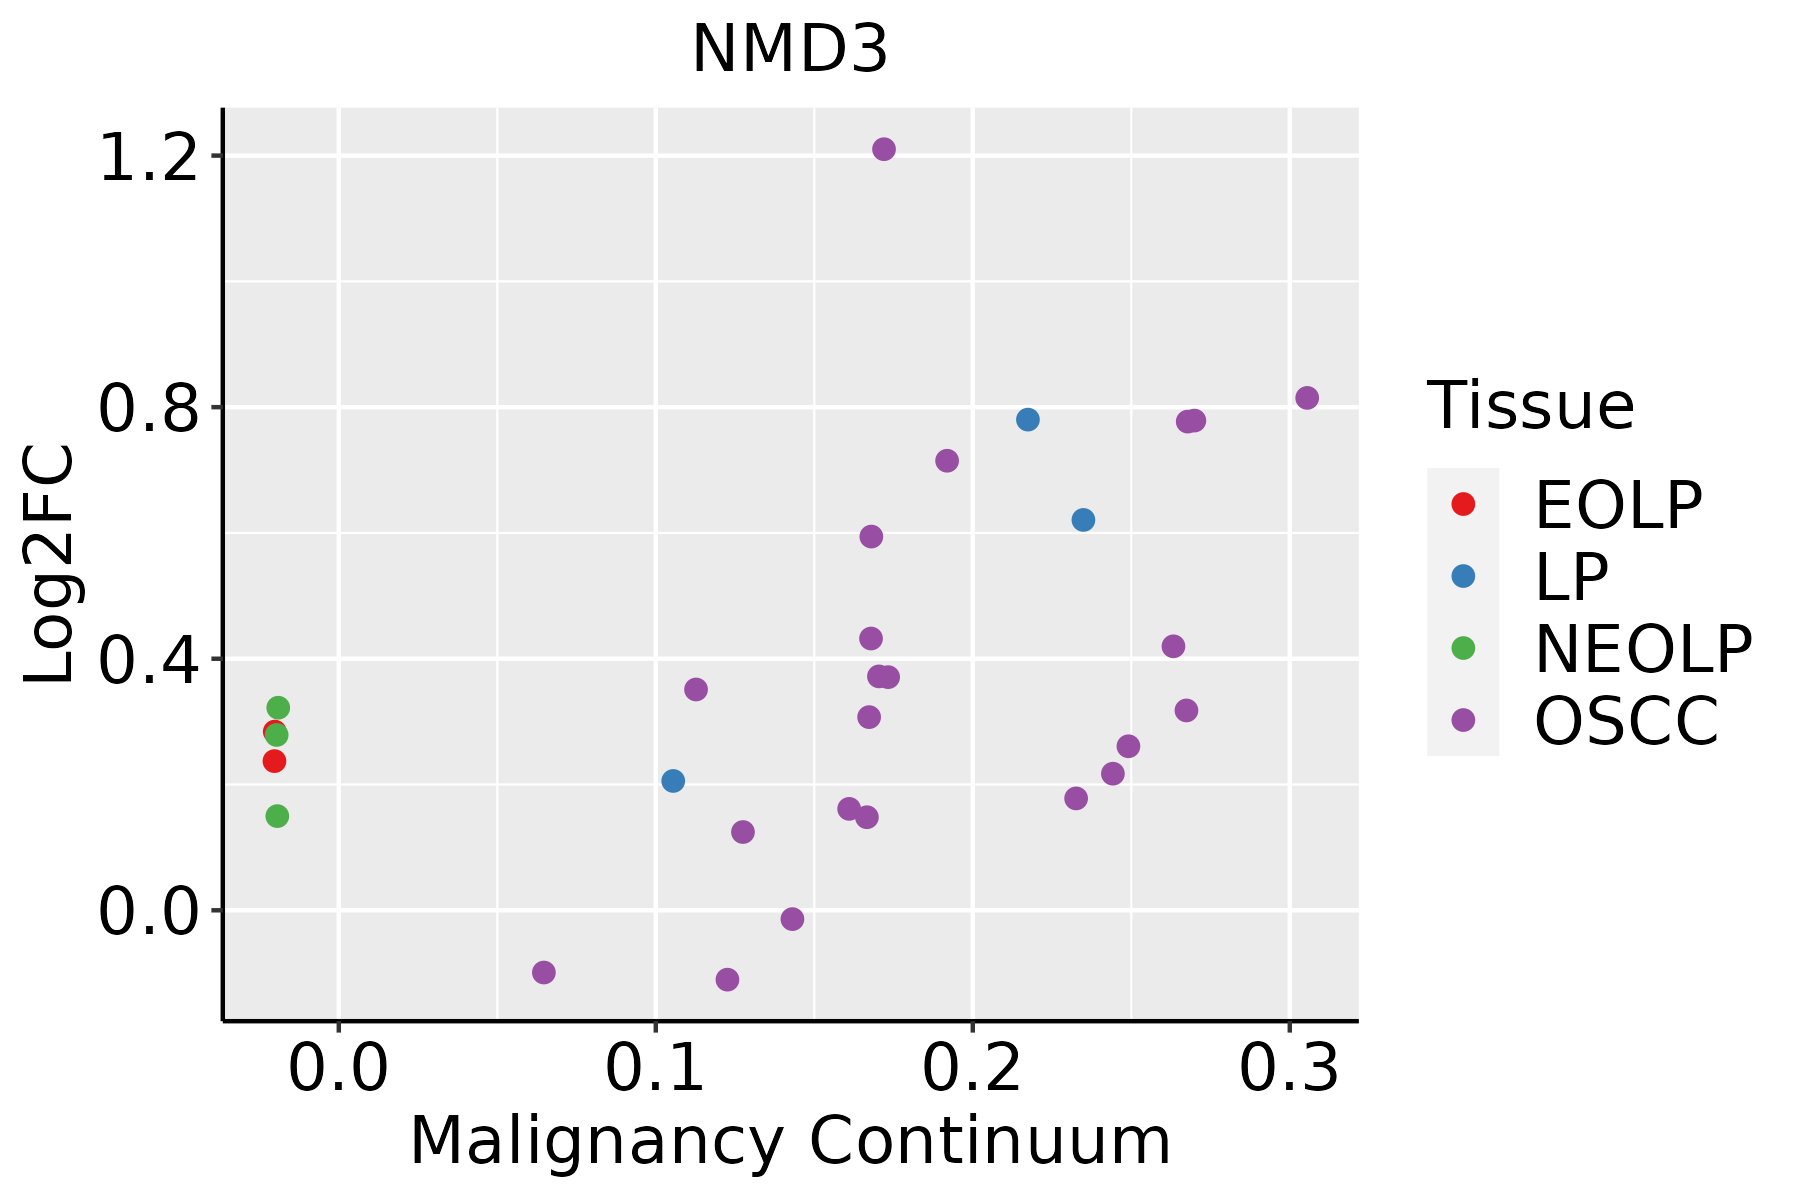 | EOLP: Erosive Oral lichen planus |
| LP: leukoplakia | ||
| NEOLP: Non-erosive oral lichen planus | ||
| OSCC: Oral squamous cell carcinoma | ||
| Skin | 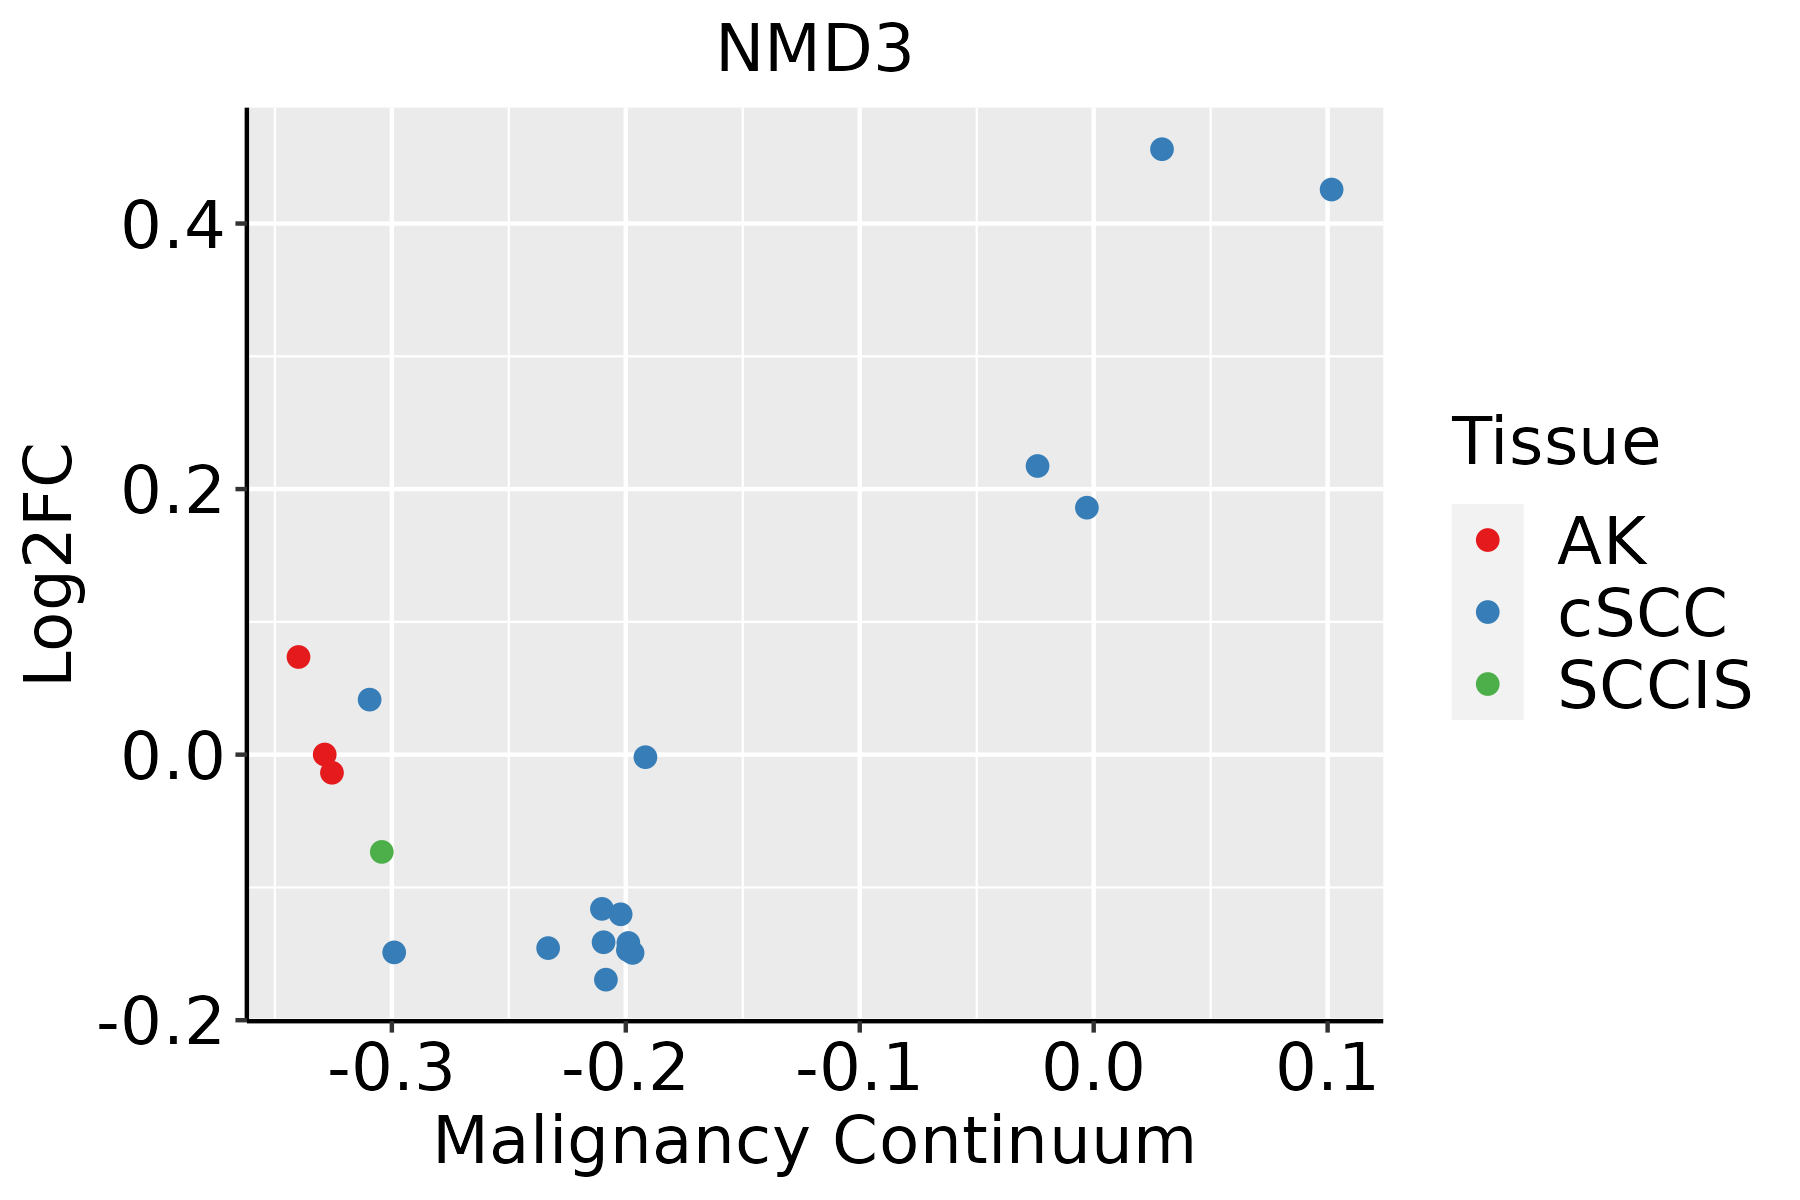 | AK: Actinic keratosis |
| cSCC: Cutaneous squamous cell carcinoma | ||
| SCCIS:squamous cell carcinoma in situ |
| ∗log2FC in expression of this searched gene in stem-like cells from each diseased tissue sample relative to stem-like cells in normal samples in each tissue plotted against the malignancy continuum. Samples are colored based on if they are from different disease stage. |
Top |
Malignant transformation related pathway analysis |
| Find out the enriched GO biological processes and KEGG pathways involved in transition from healthy to precancer to cancer |
| Tissue | Disease Stage | Enriched GO biological Processes |
| Colorectum | AD |  |
| Colorectum | SER |  |
| Colorectum | MSS |  |
| Colorectum | MSI-H |  |
| Colorectum | FAP |  |
| ∗Top 15 enriched GO BP terms are showed in the bar plot of each disease state in each tissue. Each row represents a significant GO biological process which is colored according to the -log10(p.adjust). |
| Page: 1 2 3 4 5 6 7 8 9 |
| GO ID | Tissue | Disease Stage | Description | Gene Ratio | Bg Ratio | pvalue | p.adjust | Count |
| GO:002261327 | Esophagus | HGIN | ribonucleoprotein complex biogenesis | 158/2587 | 463/18723 | 2.61e-29 | 5.23e-26 | 158 |
| GO:004225426 | Esophagus | HGIN | ribosome biogenesis | 101/2587 | 299/18723 | 8.74e-19 | 4.03e-16 | 101 |
| GO:003450417 | Esophagus | HGIN | protein localization to nucleus | 84/2587 | 290/18723 | 1.06e-11 | 1.24e-09 | 84 |
| GO:000691319 | Esophagus | HGIN | nucleocytoplasmic transport | 83/2587 | 301/18723 | 2.14e-10 | 1.97e-08 | 83 |
| GO:005116919 | Esophagus | HGIN | nuclear transport | 83/2587 | 301/18723 | 2.14e-10 | 1.97e-08 | 83 |
| GO:190382926 | Esophagus | HGIN | positive regulation of cellular protein localization | 75/2587 | 276/18723 | 3.19e-09 | 2.30e-07 | 75 |
| GO:005116819 | Esophagus | HGIN | nuclear export | 48/2587 | 154/18723 | 2.21e-08 | 1.34e-06 | 48 |
| GO:005165616 | Esophagus | HGIN | establishment of organelle localization | 90/2587 | 390/18723 | 4.27e-07 | 1.94e-05 | 90 |
| GO:190018216 | Esophagus | HGIN | positive regulation of protein localization to nucleus | 30/2587 | 87/18723 | 8.74e-07 | 3.59e-05 | 30 |
| GO:190018017 | Esophagus | HGIN | regulation of protein localization to nucleus | 40/2587 | 136/18723 | 1.69e-06 | 6.31e-05 | 40 |
| GO:005109825 | Esophagus | HGIN | regulation of binding | 78/2587 | 363/18723 | 3.73e-05 | 9.30e-04 | 78 |
| GO:005109925 | Esophagus | HGIN | positive regulation of binding | 42/2587 | 173/18723 | 1.51e-04 | 2.97e-03 | 42 |
| GO:00711665 | Esophagus | HGIN | ribonucleoprotein complex localization | 23/2587 | 77/18723 | 2.00e-04 | 3.72e-03 | 23 |
| GO:00315035 | Esophagus | HGIN | protein-containing complex localization | 50/2587 | 220/18723 | 2.18e-04 | 3.98e-03 | 50 |
| GO:00714265 | Esophagus | HGIN | ribonucleoprotein complex export from nucleus | 22/2587 | 76/18723 | 4.44e-04 | 6.62e-03 | 22 |
| GO:00000547 | Esophagus | HGIN | ribosomal subunit export from nucleus | 7/2587 | 14/18723 | 1.34e-03 | 1.57e-02 | 7 |
| GO:00337507 | Esophagus | HGIN | ribosome localization | 7/2587 | 14/18723 | 1.34e-03 | 1.57e-02 | 7 |
| GO:00714284 | Esophagus | HGIN | rRNA-containing ribonucleoprotein complex export from nucleus | 7/2587 | 15/18723 | 2.22e-03 | 2.28e-02 | 7 |
| GO:19025702 | Esophagus | HGIN | protein localization to nucleolus | 7/2587 | 16/18723 | 3.47e-03 | 3.22e-02 | 7 |
| GO:0022613111 | Esophagus | ESCC | ribonucleoprotein complex biogenesis | 365/8552 | 463/18723 | 1.74e-49 | 1.11e-45 | 365 |
| Page: 1 2 3 4 5 6 7 8 9 |
| Pathway ID | Tissue | Disease Stage | Description | Gene Ratio | Bg Ratio | pvalue | p.adjust | qvalue | Count |
| hsa030137 | Esophagus | HGIN | Nucleocytoplasmic transport | 31/1383 | 108/8465 | 8.29e-04 | 7.95e-03 | 6.31e-03 | 31 |
| hsa0301312 | Esophagus | HGIN | Nucleocytoplasmic transport | 31/1383 | 108/8465 | 8.29e-04 | 7.95e-03 | 6.31e-03 | 31 |
| hsa0301321 | Esophagus | ESCC | Nucleocytoplasmic transport | 89/4205 | 108/8465 | 1.20e-12 | 2.37e-11 | 1.21e-11 | 89 |
| hsa0301331 | Esophagus | ESCC | Nucleocytoplasmic transport | 89/4205 | 108/8465 | 1.20e-12 | 2.37e-11 | 1.21e-11 | 89 |
| hsa03013 | Liver | HCC | Nucleocytoplasmic transport | 81/4020 | 108/8465 | 4.28e-09 | 6.83e-08 | 3.80e-08 | 81 |
| hsa030131 | Liver | HCC | Nucleocytoplasmic transport | 81/4020 | 108/8465 | 4.28e-09 | 6.83e-08 | 3.80e-08 | 81 |
| hsa030136 | Oral cavity | OSCC | Nucleocytoplasmic transport | 82/3704 | 108/8465 | 7.93e-12 | 1.33e-10 | 6.77e-11 | 82 |
| hsa0301311 | Oral cavity | OSCC | Nucleocytoplasmic transport | 82/3704 | 108/8465 | 7.93e-12 | 1.33e-10 | 6.77e-11 | 82 |
| hsa030134 | Oral cavity | EOLP | Nucleocytoplasmic transport | 34/1218 | 108/8465 | 4.24e-06 | 2.91e-05 | 1.72e-05 | 34 |
| hsa030135 | Oral cavity | EOLP | Nucleocytoplasmic transport | 34/1218 | 108/8465 | 4.24e-06 | 2.91e-05 | 1.72e-05 | 34 |
| Page: 1 |
Top |
Cell-cell communication analysis |
| Identification of potential cell-cell interactions between two cell types and their ligand-receptor pairs for different disease states |
| Ligand | Receptor | LRpair | Pathway | Tissue | Disease Stage |
| Page: 1 |
Top |
Single-cell gene regulatory network inference analysis |
| Find out the significant the regulons (TFs) and the target genes of each regulon across cell types for different disease states |
| TF | Cell Type | Tissue | Disease Stage | Target Gene | RSS | Regulon Activity |
| ∗The dot plots of a searched regulon are shown for all cell subpopulations in each disease state of each tissue based on the regulon specific score inferred using pySCENIC and by calculating the average expression. |
| Page: 1 |
Top |
Somatic mutation of malignant transformation related genes |
| Annotation of somatic variants for genes involved in malignant transformation |
| Hugo Symbol | Variant Class | Variant Classification | dbSNP RS | HGVSc | HGVSp | HGVSp Short | SWISSPROT | BIOTYPE | SIFT | PolyPhen | Tumor Sample Barcode | Tissue | Histology | Sex | Age | Stage | Therapy Types | Drugs | Outcome |
| NMD3 | SNV | Missense_Mutation | novel | c.539N>T | p.Gly180Val | p.G180V | protein_coding | tolerated(0.05) | benign(0.21) | TCGA-EW-A3U0-01 | Breast | breast invasive carcinoma | Female | <65 | III/IV | Chemotherapy | cisplatin | CR | |
| NMD3 | SNV | Missense_Mutation | novel | c.1561N>A | p.Ala521Thr | p.A521T | protein_coding | deleterious_low_confidence(0.03) | benign(0.007) | TCGA-DS-A7WF-01 | Cervix | cervical & endocervical cancer | Female | <65 | I/II | Chemotherapy | cisplatin | PD | |
| NMD3 | SNV | Missense_Mutation | c.1162N>A | p.Glu388Lys | p.E388K | protein_coding | tolerated(0.37) | benign(0.025) | TCGA-EK-A2PG-01 | Cervix | cervical & endocervical cancer | Female | >=65 | I/II | Unknown | Unknown | SD | ||
| NMD3 | SNV | Missense_Mutation | rs369937656 | c.1229G>A | p.Arg410Gln | p.R410Q | protein_coding | deleterious(0.03) | possibly_damaging(0.63) | TCGA-EK-A2RM-01 | Cervix | cervical & endocervical cancer | Female | <65 | I/II | Unknown | Unknown | SD | |
| NMD3 | SNV | Missense_Mutation | c.249N>C | p.Leu83Phe | p.L83F | protein_coding | deleterious(0) | probably_damaging(0.955) | TCGA-HM-A4S6-01 | Cervix | cervical & endocervical cancer | Female | <65 | III/IV | Chemotherapy | cisplatin | CR | ||
| NMD3 | SNV | Missense_Mutation | rs777533028 | c.1411G>A | p.Asp471Asn | p.D471N | protein_coding | deleterious(0.03) | benign(0.081) | TCGA-VS-A8EK-01 | Cervix | cervical & endocervical cancer | Female | >=65 | I/II | Chemotherapy | cisplatin | PD | |
| NMD3 | SNV | Missense_Mutation | rs759384327 | c.280N>T | p.Arg94Trp | p.R94W | protein_coding | deleterious(0) | probably_damaging(0.999) | TCGA-A6-6141-01 | Colorectum | colon adenocarcinoma | Male | <65 | I/II | Chemotherapy | 5-fu | SD | |
| NMD3 | SNV | Missense_Mutation | c.667N>C | p.Ser223Pro | p.S223P | protein_coding | deleterious(0) | probably_damaging(0.988) | TCGA-AA-3663-01 | Colorectum | colon adenocarcinoma | Male | <65 | I/II | Unknown | Unknown | SD | ||
| NMD3 | SNV | Missense_Mutation | rs768281274 | c.1114G>A | p.Gly372Arg | p.G372R | protein_coding | deleterious(0.02) | probably_damaging(0.998) | TCGA-AA-3973-01 | Colorectum | colon adenocarcinoma | Male | >=65 | III/IV | Targeted Molecular therapy | bevacizumab | SD | |
| NMD3 | SNV | Missense_Mutation | novel | c.364N>C | p.Asn122His | p.N122H | protein_coding | tolerated(0.09) | probably_damaging(0.957) | TCGA-AA-3984-01 | Colorectum | colon adenocarcinoma | Female | <65 | I/II | Unknown | Unknown | SD |
| Page: 1 2 3 4 5 |
Top |
Related drugs of malignant transformation related genes |
| Identification of chemicals and drugs interact with genes involved in malignant transfromation |
| (DGIdb 4.0) |
| Entrez ID | Symbol | Category | Interaction Types | Drug Claim Name | Drug Name | PMIDs |
| Page: 1 |

Copyright 2023-Present -The University of Texas Health Science Center at Houston |