
|
|||||
|
 | |
| |
| |
| |
| |
| |
|
Gene: NLRX1 |
Gene summary for NLRX1 |
| Gene information | Species | Human | Gene symbol | NLRX1 | Gene ID | 79671 |
| Gene name | NLR family member X1 | |
| Gene Alias | CLR11.3 | |
| Cytomap | 11q23.3 | |
| Gene Type | protein-coding | GO ID | GO:0001816 | UniProtAcc | Q86UT6 |
Top |
Malignant transformation analysis |
| Identification of the aberrant gene expression in precancerous and cancerous lesions by comparing the gene expression of stem-like cells in diseased tissues with normal stem cells |
| Entrez ID | Symbol | Replicates | Species | Organ | Tissue | Adj P-value | Log2FC | Malignancy |
| 79671 | NLRX1 | LZE22D1 | Human | Esophagus | HGIN | 9.23e-03 | 1.86e-01 | 0.0595 |
| 79671 | NLRX1 | LZE22T | Human | Esophagus | ESCC | 1.58e-11 | 6.15e-01 | 0.068 |
| 79671 | NLRX1 | LZE24T | Human | Esophagus | ESCC | 9.30e-08 | 2.37e-01 | 0.0596 |
| 79671 | NLRX1 | P2T-E | Human | Esophagus | ESCC | 2.71e-08 | 8.76e-02 | 0.1177 |
| 79671 | NLRX1 | P4T-E | Human | Esophagus | ESCC | 1.70e-07 | 1.94e-01 | 0.1323 |
| 79671 | NLRX1 | P5T-E | Human | Esophagus | ESCC | 4.21e-15 | 1.54e-01 | 0.1327 |
| 79671 | NLRX1 | P8T-E | Human | Esophagus | ESCC | 4.42e-03 | 1.09e-01 | 0.0889 |
| 79671 | NLRX1 | P9T-E | Human | Esophagus | ESCC | 1.48e-03 | 6.49e-02 | 0.1131 |
| 79671 | NLRX1 | P10T-E | Human | Esophagus | ESCC | 1.66e-05 | 3.98e-02 | 0.116 |
| 79671 | NLRX1 | P11T-E | Human | Esophagus | ESCC | 1.32e-02 | 1.47e-01 | 0.1426 |
| 79671 | NLRX1 | P12T-E | Human | Esophagus | ESCC | 2.16e-08 | 2.20e-01 | 0.1122 |
| 79671 | NLRX1 | P16T-E | Human | Esophagus | ESCC | 1.47e-08 | 8.69e-02 | 0.1153 |
| 79671 | NLRX1 | P21T-E | Human | Esophagus | ESCC | 2.39e-03 | 5.47e-02 | 0.1617 |
| 79671 | NLRX1 | P22T-E | Human | Esophagus | ESCC | 2.66e-08 | 9.15e-02 | 0.1236 |
| 79671 | NLRX1 | P24T-E | Human | Esophagus | ESCC | 2.50e-04 | 4.94e-02 | 0.1287 |
| 79671 | NLRX1 | P26T-E | Human | Esophagus | ESCC | 3.32e-10 | 1.10e-01 | 0.1276 |
| 79671 | NLRX1 | P27T-E | Human | Esophagus | ESCC | 5.67e-13 | 8.37e-02 | 0.1055 |
| 79671 | NLRX1 | P28T-E | Human | Esophagus | ESCC | 4.65e-04 | 1.09e-01 | 0.1149 |
| 79671 | NLRX1 | P30T-E | Human | Esophagus | ESCC | 2.66e-07 | 2.79e-01 | 0.137 |
| 79671 | NLRX1 | P31T-E | Human | Esophagus | ESCC | 3.58e-09 | 7.86e-02 | 0.1251 |
| Page: 1 2 3 |
| Tissue | Expression Dynamics | Abbreviation |
| Esophagus | 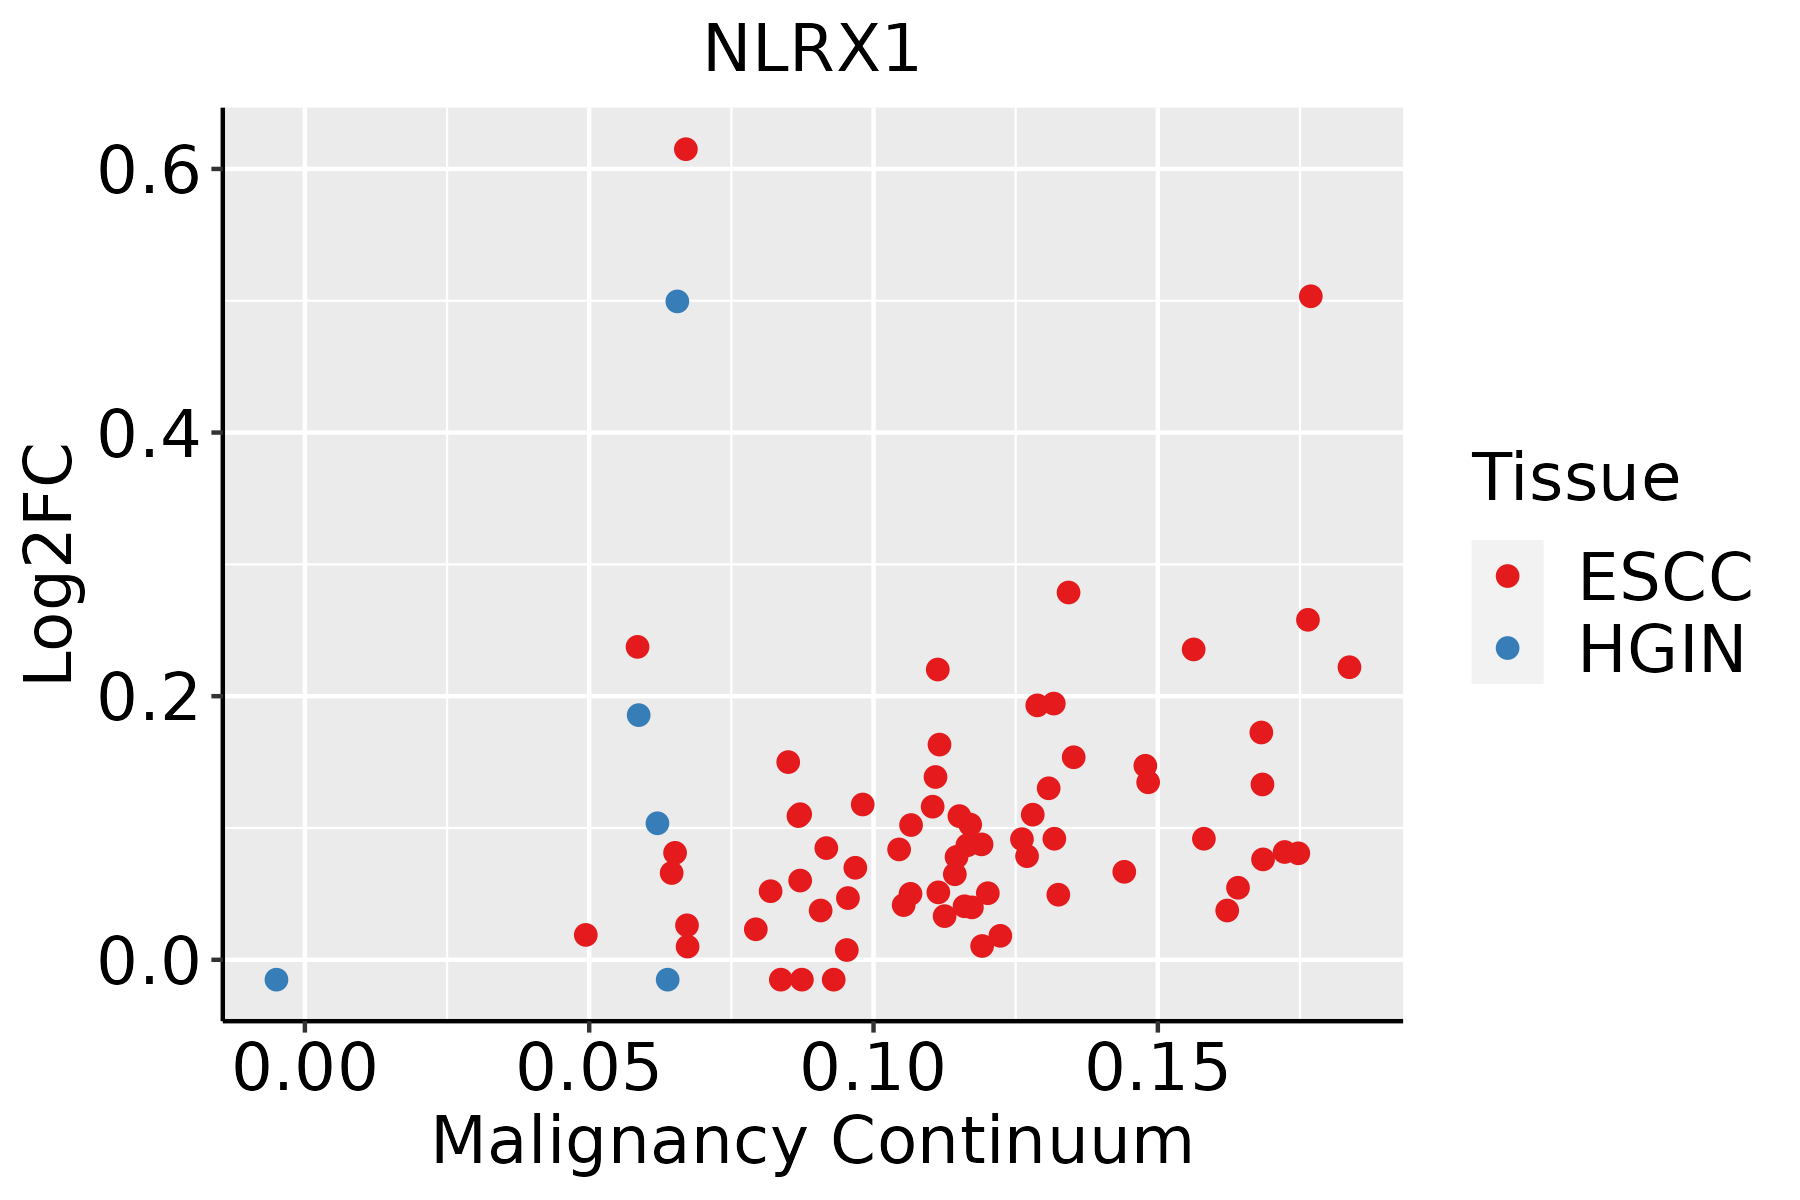 | ESCC: Esophageal squamous cell carcinoma |
| HGIN: High-grade intraepithelial neoplasias | ||
| LGIN: Low-grade intraepithelial neoplasias |
| ∗log2FC in expression of this searched gene in stem-like cells from each diseased tissue sample relative to stem-like cells in normal samples in each tissue plotted against the malignancy continuum. Samples are colored based on if they are from different disease stage. |
Top |
Malignant transformation related pathway analysis |
| Find out the enriched GO biological processes and KEGG pathways involved in transition from healthy to precancer to cancer |
| Tissue | Disease Stage | Enriched GO biological Processes |
| Colorectum | AD |  |
| Colorectum | SER |  |
| Colorectum | MSS |  |
| Colorectum | MSI-H |  |
| Colorectum | FAP |  |
| ∗Top 15 enriched GO BP terms are showed in the bar plot of each disease state in each tissue. Each row represents a significant GO biological process which is colored according to the -log10(p.adjust). |
| Page: 1 2 3 4 5 6 7 8 9 |
| GO ID | Tissue | Disease Stage | Description | Gene Ratio | Bg Ratio | pvalue | p.adjust | Count |
| GO:004312220 | Esophagus | HGIN | regulation of I-kappaB kinase/NF-kappaB signaling | 63/2587 | 249/18723 | 8.91e-07 | 3.61e-05 | 63 |
| GO:000724918 | Esophagus | HGIN | I-kappaB kinase/NF-kappaB signaling | 67/2587 | 281/18723 | 3.84e-06 | 1.29e-04 | 67 |
| GO:003052220 | Esophagus | HGIN | intracellular receptor signaling pathway | 62/2587 | 265/18723 | 1.63e-05 | 4.50e-04 | 62 |
| GO:00027538 | Esophagus | HGIN | cytoplasmic pattern recognition receptor signaling pathway | 19/2587 | 60/18723 | 3.07e-04 | 5.15e-03 | 19 |
| GO:00395284 | Esophagus | HGIN | cytoplasmic pattern recognition receptor signaling pathway in response to virus | 13/2587 | 34/18723 | 3.51e-04 | 5.65e-03 | 13 |
| GO:00395295 | Esophagus | HGIN | RIG-I signaling pathway | 11/2587 | 27/18723 | 5.28e-04 | 7.56e-03 | 11 |
| GO:00985867 | Esophagus | HGIN | cellular response to virus | 21/2587 | 84/18723 | 4.35e-03 | 3.84e-02 | 21 |
| GO:000961517 | Esophagus | HGIN | response to virus | 69/2587 | 367/18723 | 4.39e-03 | 3.86e-02 | 69 |
| GO:00324794 | Esophagus | HGIN | regulation of type I interferon production | 23/2587 | 95/18723 | 4.51e-03 | 3.93e-02 | 23 |
| GO:00326064 | Esophagus | HGIN | type I interferon production | 23/2587 | 95/18723 | 4.51e-03 | 3.93e-02 | 23 |
| GO:00028325 | Esophagus | HGIN | negative regulation of response to biotic stimulus | 25/2587 | 108/18723 | 5.87e-03 | 4.77e-02 | 25 |
| GO:000961518 | Esophagus | ESCC | response to virus | 238/8552 | 367/18723 | 6.65e-14 | 3.32e-12 | 238 |
| GO:0043122110 | Esophagus | ESCC | regulation of I-kappaB kinase/NF-kappaB signaling | 167/8552 | 249/18723 | 6.11e-12 | 2.32e-10 | 167 |
| GO:000724919 | Esophagus | ESCC | I-kappaB kinase/NF-kappaB signaling | 183/8552 | 281/18723 | 3.02e-11 | 1.01e-09 | 183 |
| GO:00516075 | Esophagus | ESCC | defense response to virus | 171/8552 | 265/18723 | 3.91e-10 | 1.05e-08 | 171 |
| GO:01405465 | Esophagus | ESCC | defense response to symbiont | 171/8552 | 265/18723 | 3.91e-10 | 1.05e-08 | 171 |
| GO:0030522110 | Esophagus | ESCC | intracellular receptor signaling pathway | 170/8552 | 265/18723 | 8.58e-10 | 2.09e-08 | 170 |
| GO:00028318 | Esophagus | ESCC | regulation of response to biotic stimulus | 191/8552 | 327/18723 | 2.12e-06 | 2.45e-05 | 191 |
| GO:000283212 | Esophagus | ESCC | negative regulation of response to biotic stimulus | 72/8552 | 108/18723 | 8.36e-06 | 8.11e-05 | 72 |
| GO:003952813 | Esophagus | ESCC | cytoplasmic pattern recognition receptor signaling pathway in response to virus | 28/8552 | 34/18723 | 1.21e-05 | 1.12e-04 | 28 |
| Page: 1 2 |
| Pathway ID | Tissue | Disease Stage | Description | Gene Ratio | Bg Ratio | pvalue | p.adjust | qvalue | Count |
| hsa046219 | Esophagus | HGIN | NOD-like receptor signaling pathway | 45/1383 | 186/8465 | 3.40e-03 | 2.54e-02 | 2.02e-02 | 45 |
| hsa0516420 | Esophagus | HGIN | Influenza A | 42/1383 | 171/8465 | 3.41e-03 | 2.54e-02 | 2.02e-02 | 42 |
| hsa0462114 | Esophagus | HGIN | NOD-like receptor signaling pathway | 45/1383 | 186/8465 | 3.40e-03 | 2.54e-02 | 2.02e-02 | 45 |
| hsa05164110 | Esophagus | HGIN | Influenza A | 42/1383 | 171/8465 | 3.41e-03 | 2.54e-02 | 2.02e-02 | 42 |
| hsa0516425 | Esophagus | ESCC | Influenza A | 122/4205 | 171/8465 | 5.01e-09 | 4.79e-08 | 2.45e-08 | 122 |
| hsa0462122 | Esophagus | ESCC | NOD-like receptor signaling pathway | 116/4205 | 186/8465 | 2.90e-04 | 1.03e-03 | 5.30e-04 | 116 |
| hsa0516435 | Esophagus | ESCC | Influenza A | 122/4205 | 171/8465 | 5.01e-09 | 4.79e-08 | 2.45e-08 | 122 |
| hsa0462132 | Esophagus | ESCC | NOD-like receptor signaling pathway | 116/4205 | 186/8465 | 2.90e-04 | 1.03e-03 | 5.30e-04 | 116 |
| Page: 1 |
Top |
Cell-cell communication analysis |
| Identification of potential cell-cell interactions between two cell types and their ligand-receptor pairs for different disease states |
| Ligand | Receptor | LRpair | Pathway | Tissue | Disease Stage |
| Page: 1 |
Top |
Single-cell gene regulatory network inference analysis |
| Find out the significant the regulons (TFs) and the target genes of each regulon across cell types for different disease states |
| TF | Cell Type | Tissue | Disease Stage | Target Gene | RSS | Regulon Activity |
| ∗The dot plots of a searched regulon are shown for all cell subpopulations in each disease state of each tissue based on the regulon specific score inferred using pySCENIC and by calculating the average expression. |
| Page: 1 |
Top |
Somatic mutation of malignant transformation related genes |
| Annotation of somatic variants for genes involved in malignant transformation |
| Hugo Symbol | Variant Class | Variant Classification | dbSNP RS | HGVSc | HGVSp | HGVSp Short | SWISSPROT | BIOTYPE | SIFT | PolyPhen | Tumor Sample Barcode | Tissue | Histology | Sex | Age | Stage | Therapy Types | Drugs | Outcome |
| NLRX1 | SNV | Missense_Mutation | rs772640802 | c.973C>T | p.Arg325Cys | p.R325C | Q86UT6 | protein_coding | deleterious(0.01) | probably_damaging(0.939) | TCGA-AC-A23H-01 | Breast | breast invasive carcinoma | Female | >=65 | I/II | Unknown | Unknown | PD |
| NLRX1 | SNV | Missense_Mutation | rs544880461 | c.151N>T | p.Arg51Cys | p.R51C | Q86UT6 | protein_coding | deleterious_low_confidence(0) | possibly_damaging(0.745) | TCGA-AC-A62X-01 | Breast | breast invasive carcinoma | Female | >=65 | I/II | Unknown | Unknown | SD |
| NLRX1 | SNV | Missense_Mutation | rs775689434 | c.76N>T | p.Arg26Cys | p.R26C | Q86UT6 | protein_coding | tolerated_low_confidence(0.21) | benign(0) | TCGA-D8-A1XJ-01 | Breast | breast invasive carcinoma | Female | >=65 | III/IV | Hormone Therapy | tamoxiphen | SD |
| NLRX1 | SNV | Missense_Mutation | rs749134937 | c.2251N>T | p.Arg751Cys | p.R751C | Q86UT6 | protein_coding | deleterious(0) | probably_damaging(0.974) | TCGA-D8-A1XQ-01 | Breast | breast invasive carcinoma | Female | >=65 | I/II | Unknown | Unknown | SD |
| NLRX1 | insertion | In_Frame_Ins | rs750333449 | c.1146_1147insAATGTAGAGGGCAGCCAGGTA | p.His382_Phe383insAsnValGluGlySerGlnVal | p.H382_F383insNVEGSQV | Q86UT6 | protein_coding | TCGA-A8-A08T-01 | Breast | breast invasive carcinoma | Female | <65 | III/IV | Unknown | Unknown | PD | ||
| NLRX1 | insertion | In_Frame_Ins | rs750333449 | c.1146_1147insAATGTAGAGGGCAGCCAGGTA | p.His382_Phe383insAsnValGluGlySerGlnVal | p.H382_F383insNVEGSQV | Q86UT6 | protein_coding | TCGA-A8-A09Z-01 | Breast | breast invasive carcinoma | Female | >=65 | I/II | Unknown | Unknown | SD | ||
| NLRX1 | SNV | Missense_Mutation | novel | c.1668N>G | p.Ile556Met | p.I556M | Q86UT6 | protein_coding | deleterious(0.01) | benign(0.045) | TCGA-C5-A1MH-01 | Cervix | cervical & endocervical cancer | Female | >=65 | III/IV | Chemotherapy | cisplatin | PD |
| NLRX1 | SNV | Missense_Mutation | c.1895N>G | p.Ser632Cys | p.S632C | Q86UT6 | protein_coding | deleterious(0.01) | probably_damaging(0.985) | TCGA-DG-A2KM-01 | Cervix | cervical & endocervical cancer | Female | <65 | I/II | Chemotherapy | cisplatin | SD | |
| NLRX1 | SNV | Missense_Mutation | c.1974C>G | p.Ile658Met | p.I658M | Q86UT6 | protein_coding | tolerated(0.44) | benign(0.051) | TCGA-EK-A2RA-01 | Cervix | cervical & endocervical cancer | Female | >=65 | I/II | Unknown | Unknown | SD | |
| NLRX1 | SNV | Missense_Mutation | c.1964C>T | p.Ala655Val | p.A655V | Q86UT6 | protein_coding | tolerated(0.11) | benign(0.254) | TCGA-R2-A69V-01 | Cervix | cervical & endocervical cancer | Female | <65 | I/II | Chemotherapy | cisplatin | SD |
| Page: 1 2 3 4 5 6 7 8 9 10 11 |
Top |
Related drugs of malignant transformation related genes |
| Identification of chemicals and drugs interact with genes involved in malignant transfromation |
| (DGIdb 4.0) |
| Entrez ID | Symbol | Category | Interaction Types | Drug Claim Name | Drug Name | PMIDs |
| Page: 1 |

Copyright 2023-Present -The University of Texas Health Science Center at Houston |