
|
|||||
|
 | |
| |
| |
| |
| |
| |
|
Gene: NLRP1 |
Gene summary for NLRP1 |
| Gene information | Species | Human | Gene symbol | NLRP1 | Gene ID | 22861 |
| Gene name | NLR family pyrin domain containing 1 | |
| Gene Alias | AIADK | |
| Cytomap | 17p13.2 | |
| Gene Type | protein-coding | GO ID | GO:0001816 | UniProtAcc | Q9C000 |
Top |
Malignant transformation analysis |
| Identification of the aberrant gene expression in precancerous and cancerous lesions by comparing the gene expression of stem-like cells in diseased tissues with normal stem cells |
| Entrez ID | Symbol | Replicates | Species | Organ | Tissue | Adj P-value | Log2FC | Malignancy |
| 22861 | NLRP1 | LZE4T | Human | Esophagus | ESCC | 1.92e-02 | 1.83e-01 | 0.0811 |
| 22861 | NLRP1 | P1T-E | Human | Esophagus | ESCC | 1.01e-08 | 5.21e-01 | 0.0875 |
| 22861 | NLRP1 | P2T-E | Human | Esophagus | ESCC | 7.44e-11 | 2.51e-01 | 0.1177 |
| 22861 | NLRP1 | P4T-E | Human | Esophagus | ESCC | 3.03e-16 | 3.25e-01 | 0.1323 |
| 22861 | NLRP1 | P5T-E | Human | Esophagus | ESCC | 3.38e-03 | 1.83e-02 | 0.1327 |
| 22861 | NLRP1 | P8T-E | Human | Esophagus | ESCC | 1.27e-09 | 7.00e-02 | 0.0889 |
| 22861 | NLRP1 | P9T-E | Human | Esophagus | ESCC | 2.46e-04 | 3.63e-02 | 0.1131 |
| 22861 | NLRP1 | P10T-E | Human | Esophagus | ESCC | 1.63e-29 | 4.15e-01 | 0.116 |
| 22861 | NLRP1 | P11T-E | Human | Esophagus | ESCC | 3.59e-10 | 1.87e-01 | 0.1426 |
| 22861 | NLRP1 | P12T-E | Human | Esophagus | ESCC | 2.27e-12 | 8.60e-02 | 0.1122 |
| 22861 | NLRP1 | P16T-E | Human | Esophagus | ESCC | 1.58e-08 | 7.69e-02 | 0.1153 |
| 22861 | NLRP1 | P19T-E | Human | Esophagus | ESCC | 3.90e-02 | 2.04e-01 | 0.1662 |
| 22861 | NLRP1 | P20T-E | Human | Esophagus | ESCC | 8.03e-10 | 1.05e-01 | 0.1124 |
| 22861 | NLRP1 | P21T-E | Human | Esophagus | ESCC | 6.21e-23 | 3.93e-01 | 0.1617 |
| 22861 | NLRP1 | P22T-E | Human | Esophagus | ESCC | 6.01e-08 | 4.08e-02 | 0.1236 |
| 22861 | NLRP1 | P24T-E | Human | Esophagus | ESCC | 3.86e-11 | 8.40e-02 | 0.1287 |
| 22861 | NLRP1 | P27T-E | Human | Esophagus | ESCC | 9.15e-10 | 8.20e-02 | 0.1055 |
| 22861 | NLRP1 | P31T-E | Human | Esophagus | ESCC | 4.15e-04 | 9.74e-03 | 0.1251 |
| 22861 | NLRP1 | P32T-E | Human | Esophagus | ESCC | 1.24e-11 | 1.58e-01 | 0.1666 |
| 22861 | NLRP1 | P37T-E | Human | Esophagus | ESCC | 1.23e-19 | 2.82e-01 | 0.1371 |
| Page: 1 2 3 4 |
| Tissue | Expression Dynamics | Abbreviation |
| Esophagus |  | ESCC: Esophageal squamous cell carcinoma |
| HGIN: High-grade intraepithelial neoplasias | ||
| LGIN: Low-grade intraepithelial neoplasias | ||
| Oral Cavity | 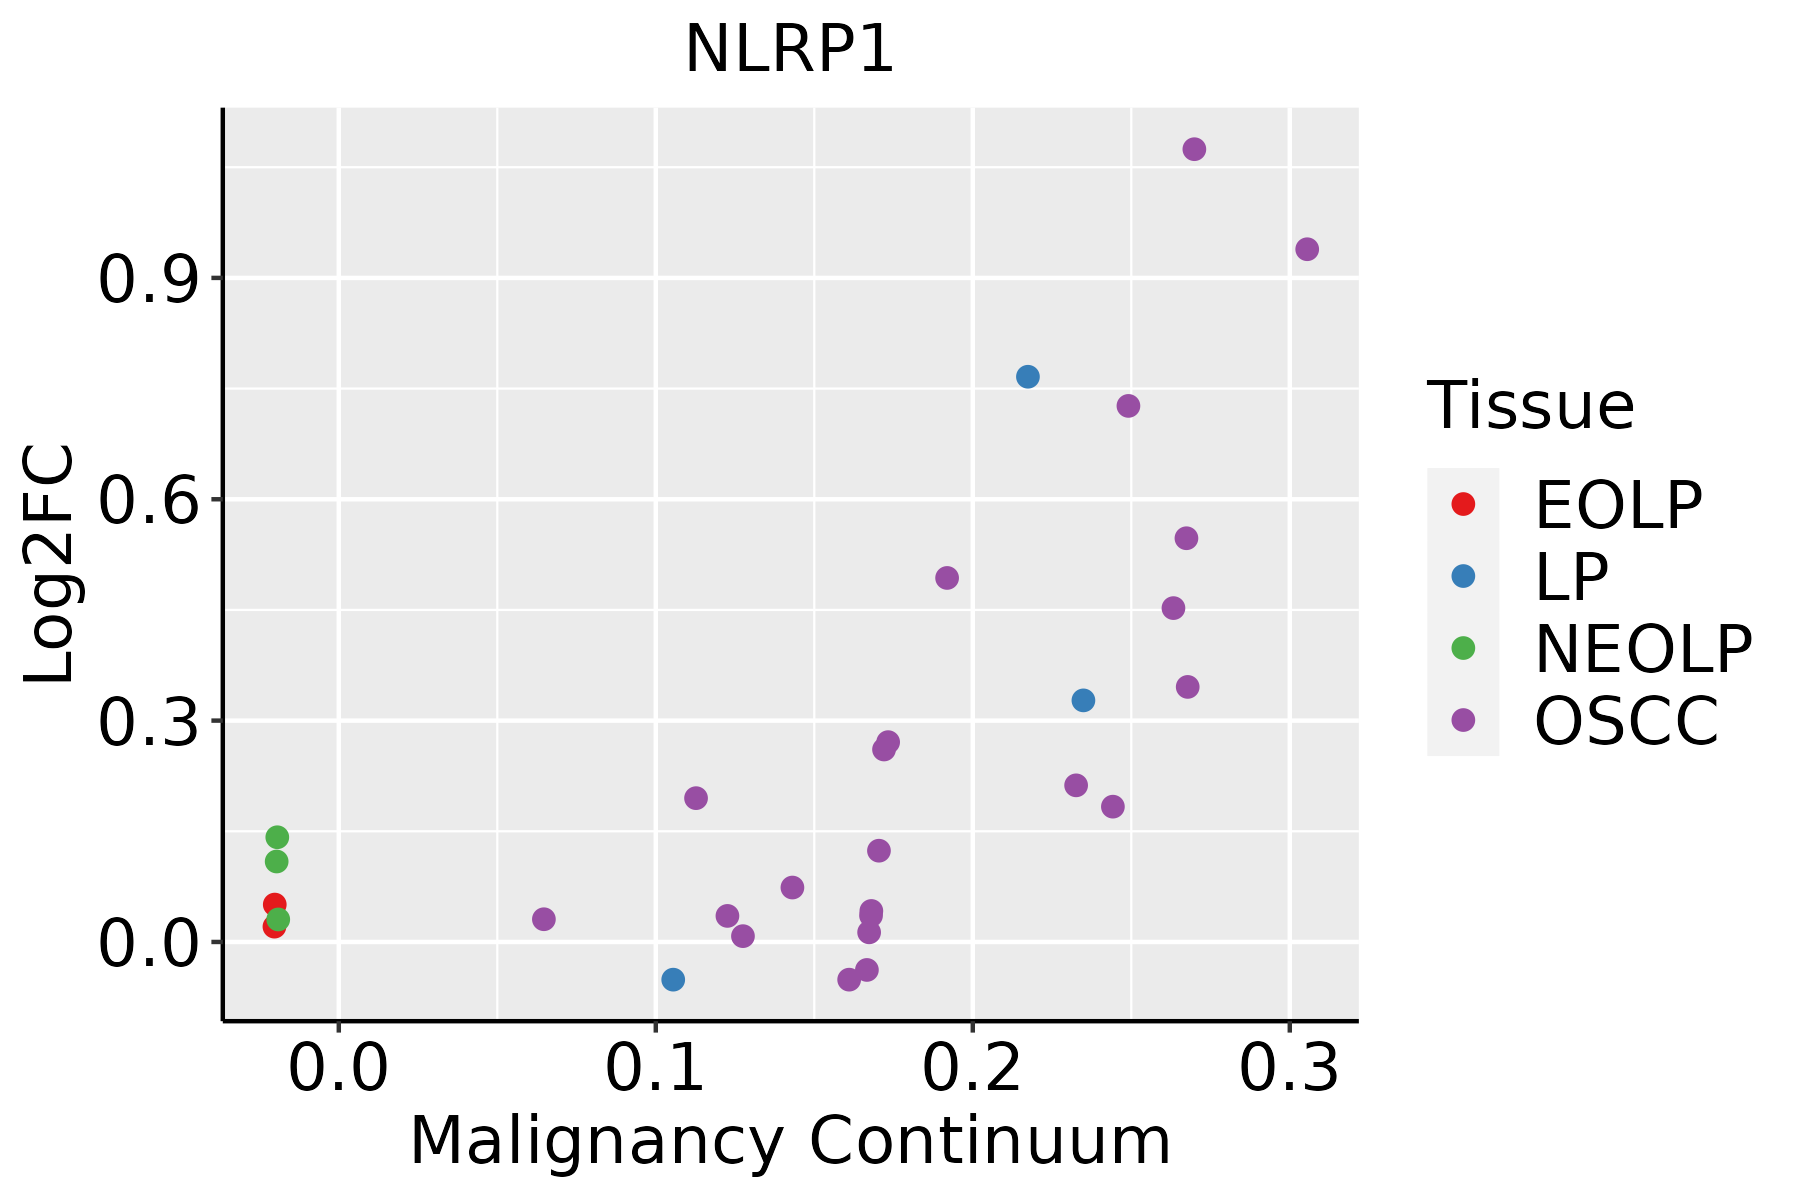 | EOLP: Erosive Oral lichen planus |
| LP: leukoplakia | ||
| NEOLP: Non-erosive oral lichen planus | ||
| OSCC: Oral squamous cell carcinoma | ||
| Thyroid | 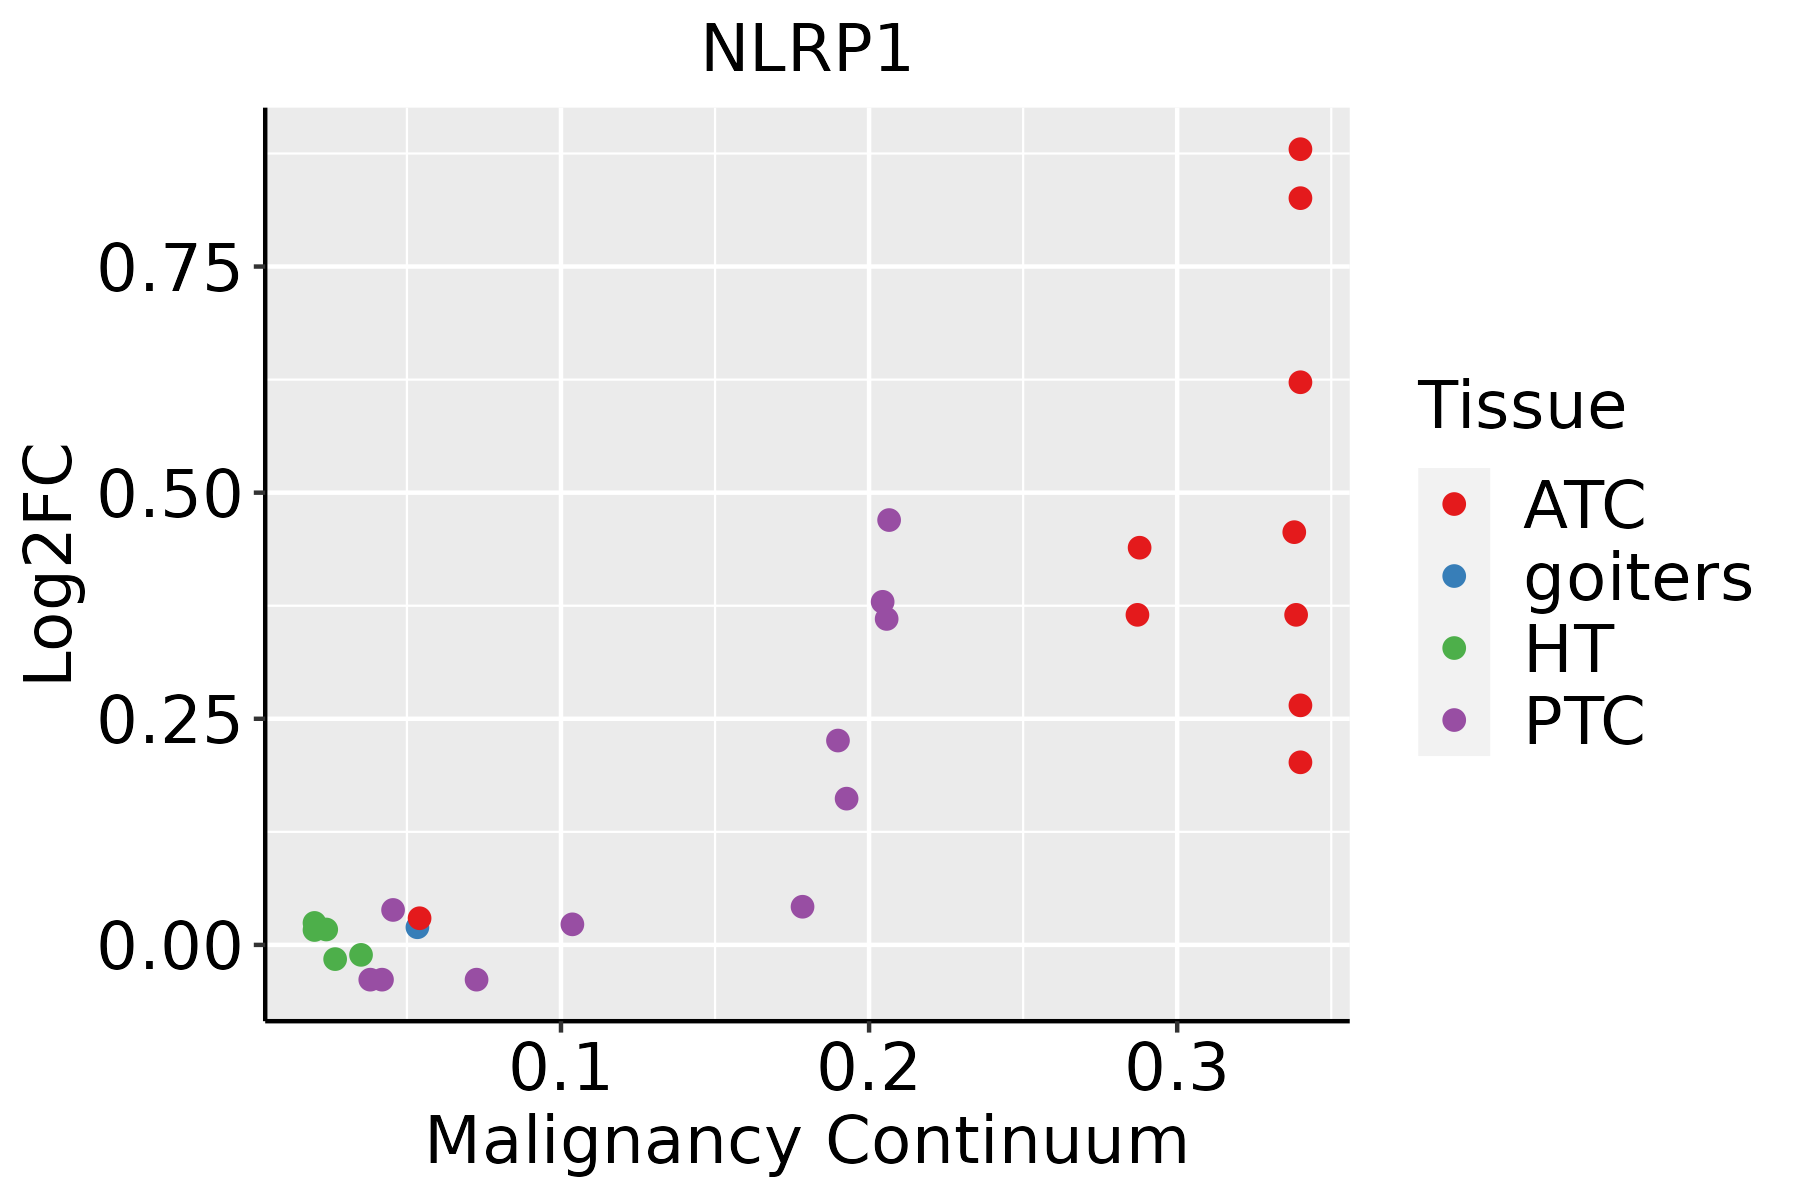 | ATC: Anaplastic thyroid cancer |
| HT: Hashimoto's thyroiditis | ||
| PTC: Papillary thyroid cancer |
| ∗log2FC in expression of this searched gene in stem-like cells from each diseased tissue sample relative to stem-like cells in normal samples in each tissue plotted against the malignancy continuum. Samples are colored based on if they are from different disease stage. |
Top |
Malignant transformation related pathway analysis |
| Find out the enriched GO biological processes and KEGG pathways involved in transition from healthy to precancer to cancer |
| Tissue | Disease Stage | Enriched GO biological Processes |
| Colorectum | AD |  |
| Colorectum | SER |  |
| Colorectum | MSS |  |
| Colorectum | MSI-H |  |
| Colorectum | FAP |  |
| ∗Top 15 enriched GO BP terms are showed in the bar plot of each disease state in each tissue. Each row represents a significant GO biological process which is colored according to the -log10(p.adjust). |
| Page: 1 2 3 4 5 6 7 8 9 |
| GO ID | Tissue | Disease Stage | Description | Gene Ratio | Bg Ratio | pvalue | p.adjust | Count |
| GO:0045862111 | Esophagus | ESCC | positive regulation of proteolysis | 256/8552 | 372/18723 | 7.88e-20 | 9.43e-18 | 256 |
| GO:000961518 | Esophagus | ESCC | response to virus | 238/8552 | 367/18723 | 6.65e-14 | 3.32e-12 | 238 |
| GO:2000116111 | Esophagus | ESCC | regulation of cysteine-type endopeptidase activity | 158/8552 | 235/18723 | 1.67e-11 | 5.90e-10 | 158 |
| GO:0043281111 | Esophagus | ESCC | regulation of cysteine-type endopeptidase activity involved in apoptotic process | 143/8552 | 209/18723 | 2.12e-11 | 7.31e-10 | 143 |
| GO:00516075 | Esophagus | ESCC | defense response to virus | 171/8552 | 265/18723 | 3.91e-10 | 1.05e-08 | 171 |
| GO:01405465 | Esophagus | ESCC | defense response to symbiont | 171/8552 | 265/18723 | 3.91e-10 | 1.05e-08 | 171 |
| GO:0010952111 | Esophagus | ESCC | positive regulation of peptidase activity | 133/8552 | 197/18723 | 4.31e-10 | 1.14e-08 | 133 |
| GO:0052547111 | Esophagus | ESCC | regulation of peptidase activity | 275/8552 | 461/18723 | 7.54e-10 | 1.88e-08 | 275 |
| GO:0070997111 | Esophagus | ESCC | neuron death | 216/8552 | 361/18723 | 3.49e-08 | 6.45e-07 | 216 |
| GO:0052548111 | Esophagus | ESCC | regulation of endopeptidase activity | 253/8552 | 432/18723 | 3.68e-08 | 6.78e-07 | 253 |
| GO:0010950111 | Esophagus | ESCC | positive regulation of endopeptidase activity | 116/8552 | 179/18723 | 1.77e-07 | 2.79e-06 | 116 |
| GO:0051402110 | Esophagus | ESCC | neuron apoptotic process | 148/8552 | 246/18723 | 3.08e-06 | 3.47e-05 | 148 |
| GO:0043280110 | Esophagus | ESCC | positive regulation of cysteine-type endopeptidase activity involved in apoptotic process | 84/8552 | 129/18723 | 6.38e-06 | 6.55e-05 | 84 |
| GO:2001056110 | Esophagus | ESCC | positive regulation of cysteine-type endopeptidase activity | 94/8552 | 148/18723 | 8.87e-06 | 8.59e-05 | 94 |
| GO:000691915 | Esophagus | ESCC | activation of cysteine-type endopeptidase activity involved in apoptotic process | 54/8552 | 78/18723 | 2.17e-05 | 1.87e-04 | 54 |
| GO:01403742 | Esophagus | ESCC | antiviral innate immune response | 13/8552 | 15/18723 | 1.31e-03 | 6.26e-03 | 13 |
| GO:000181916 | Esophagus | ESCC | positive regulation of cytokine production | 244/8552 | 467/18723 | 2.29e-03 | 1.01e-02 | 244 |
| GO:00512592 | Esophagus | ESCC | protein complex oligomerization | 130/8552 | 238/18723 | 3.29e-03 | 1.36e-02 | 130 |
| GO:004586222 | Liver | HCC | positive regulation of proteolysis | 232/7958 | 372/18723 | 5.66e-15 | 3.98e-13 | 232 |
| GO:001056322 | Liver | HCC | negative regulation of phosphorus metabolic process | 259/7958 | 442/18723 | 4.29e-12 | 1.92e-10 | 259 |
| Page: 1 2 3 4 5 6 |
| Pathway ID | Tissue | Disease Stage | Description | Gene Ratio | Bg Ratio | pvalue | p.adjust | qvalue | Count |
| hsa0462122 | Esophagus | ESCC | NOD-like receptor signaling pathway | 116/4205 | 186/8465 | 2.90e-04 | 1.03e-03 | 5.30e-04 | 116 |
| hsa0462132 | Esophagus | ESCC | NOD-like receptor signaling pathway | 116/4205 | 186/8465 | 2.90e-04 | 1.03e-03 | 5.30e-04 | 116 |
| hsa046218 | Oral cavity | OSCC | NOD-like receptor signaling pathway | 108/3704 | 186/8465 | 5.13e-05 | 2.07e-04 | 1.05e-04 | 108 |
| hsa0462113 | Oral cavity | OSCC | NOD-like receptor signaling pathway | 108/3704 | 186/8465 | 5.13e-05 | 2.07e-04 | 1.05e-04 | 108 |
| hsa0462121 | Oral cavity | LP | NOD-like receptor signaling pathway | 73/2418 | 186/8465 | 9.80e-04 | 4.53e-03 | 2.92e-03 | 73 |
| hsa0462131 | Oral cavity | LP | NOD-like receptor signaling pathway | 73/2418 | 186/8465 | 9.80e-04 | 4.53e-03 | 2.92e-03 | 73 |
| Page: 1 |
Top |
Cell-cell communication analysis |
| Identification of potential cell-cell interactions between two cell types and their ligand-receptor pairs for different disease states |
| Ligand | Receptor | LRpair | Pathway | Tissue | Disease Stage |
| Page: 1 |
Top |
Single-cell gene regulatory network inference analysis |
| Find out the significant the regulons (TFs) and the target genes of each regulon across cell types for different disease states |
| TF | Cell Type | Tissue | Disease Stage | Target Gene | RSS | Regulon Activity |
| ∗The dot plots of a searched regulon are shown for all cell subpopulations in each disease state of each tissue based on the regulon specific score inferred using pySCENIC and by calculating the average expression. |
| Page: 1 |
Top |
Somatic mutation of malignant transformation related genes |
| Annotation of somatic variants for genes involved in malignant transformation |
| Hugo Symbol | Variant Class | Variant Classification | dbSNP RS | HGVSc | HGVSp | HGVSp Short | SWISSPROT | BIOTYPE | SIFT | PolyPhen | Tumor Sample Barcode | Tissue | Histology | Sex | Age | Stage | Therapy Types | Drugs | Outcome |
| NLRP1 | SNV | Missense_Mutation | c.2901N>A | p.Met967Ile | p.M967I | Q9C000 | protein_coding | deleterious(0.02) | benign(0.001) | TCGA-5L-AAT1-01 | Breast | breast invasive carcinoma | Female | <65 | III/IV | Hormone Therapy | letrozol | SD | |
| NLRP1 | SNV | Missense_Mutation | c.3118N>G | p.Ile1040Val | p.I1040V | Q9C000 | protein_coding | tolerated(0.46) | benign(0) | TCGA-A8-A097-01 | Breast | breast invasive carcinoma | Female | >=65 | I/II | Hormone Therapy | tamoxiphen | SD | |
| NLRP1 | SNV | Missense_Mutation | c.1637C>T | p.Thr546Ile | p.T546I | Q9C000 | protein_coding | deleterious(0) | probably_damaging(0.992) | TCGA-BH-A0BV-01 | Breast | breast invasive carcinoma | Female | >=65 | I/II | Chemotherapy | doxorubicin | SD | |
| NLRP1 | SNV | Missense_Mutation | novel | c.2506N>A | p.Arg836Ser | p.R836S | Q9C000 | protein_coding | tolerated(0.76) | benign(0.031) | TCGA-BH-A18Q-01 | Breast | breast invasive carcinoma | Female | <65 | I/II | Unknown | Unknown | SD |
| NLRP1 | SNV | Missense_Mutation | c.4275N>C | p.Gln1425His | p.Q1425H | Q9C000 | protein_coding | deleterious(0) | possibly_damaging(0.83) | TCGA-C8-A1HM-01 | Breast | breast invasive carcinoma | Female | >=65 | I/II | Chemotherapy | doxorubicin | CR | |
| NLRP1 | SNV | Missense_Mutation | c.3200N>T | p.Asp1067Val | p.D1067V | Q9C000 | protein_coding | deleterious(0) | possibly_damaging(0.858) | TCGA-D8-A1J8-01 | Breast | breast invasive carcinoma | Female | >=65 | I/II | Hormone Therapy | nolvadex | SD | |
| NLRP1 | SNV | Missense_Mutation | c.839N>T | p.Gln280Leu | p.Q280L | Q9C000 | protein_coding | deleterious(0) | possibly_damaging(0.632) | TCGA-D8-A1XQ-01 | Breast | breast invasive carcinoma | Female | >=65 | I/II | Unknown | Unknown | SD | |
| NLRP1 | SNV | Missense_Mutation | novel | c.712N>C | p.Val238Leu | p.V238L | Q9C000 | protein_coding | tolerated_low_confidence(0.61) | benign(0) | TCGA-E9-A1NC-01 | Breast | breast invasive carcinoma | Female | <65 | I/II | Chemotherapy | doxorubicin | CR |
| NLRP1 | SNV | Missense_Mutation | rs200333162 | c.526N>A | p.Ala176Thr | p.A176T | Q9C000 | protein_coding | tolerated(0.23) | benign(0.011) | TCGA-OL-A5RU-01 | Breast | breast invasive carcinoma | Female | <65 | I/II | Chemotherapy | cyclophosphamide | CR |
| NLRP1 | SNV | Missense_Mutation | rs373530609 | c.2215N>A | p.Glu739Lys | p.E739K | Q9C000 | protein_coding | deleterious(0.04) | benign(0.014) | TCGA-PE-A5DE-01 | Breast | breast invasive carcinoma | Female | <65 | I/II | Chemotherapy | taxotere | CR |
| Page: 1 2 3 4 5 6 7 8 9 10 11 12 13 14 15 |
Top |
Related drugs of malignant transformation related genes |
| Identification of chemicals and drugs interact with genes involved in malignant transfromation |
| (DGIdb 4.0) |
| Entrez ID | Symbol | Category | Interaction Types | Drug Claim Name | Drug Name | PMIDs |
| 22861 | NLRP1 | PROTEASE | agonist | 178101721 | ||
| 22861 | NLRP1 | PROTEASE | PERHEXILINE MALEATE | PERHEXILINE MALEATE | ||
| 22861 | NLRP1 | PROTEASE | DITHIAZANINE IODIDE | DITHIAZANINE IODIDE |
| Page: 1 |

Copyright 2023-Present -The University of Texas Health Science Center at Houston |