| Tissue | Expression Dynamics | Abbreviation |
| Cervix | 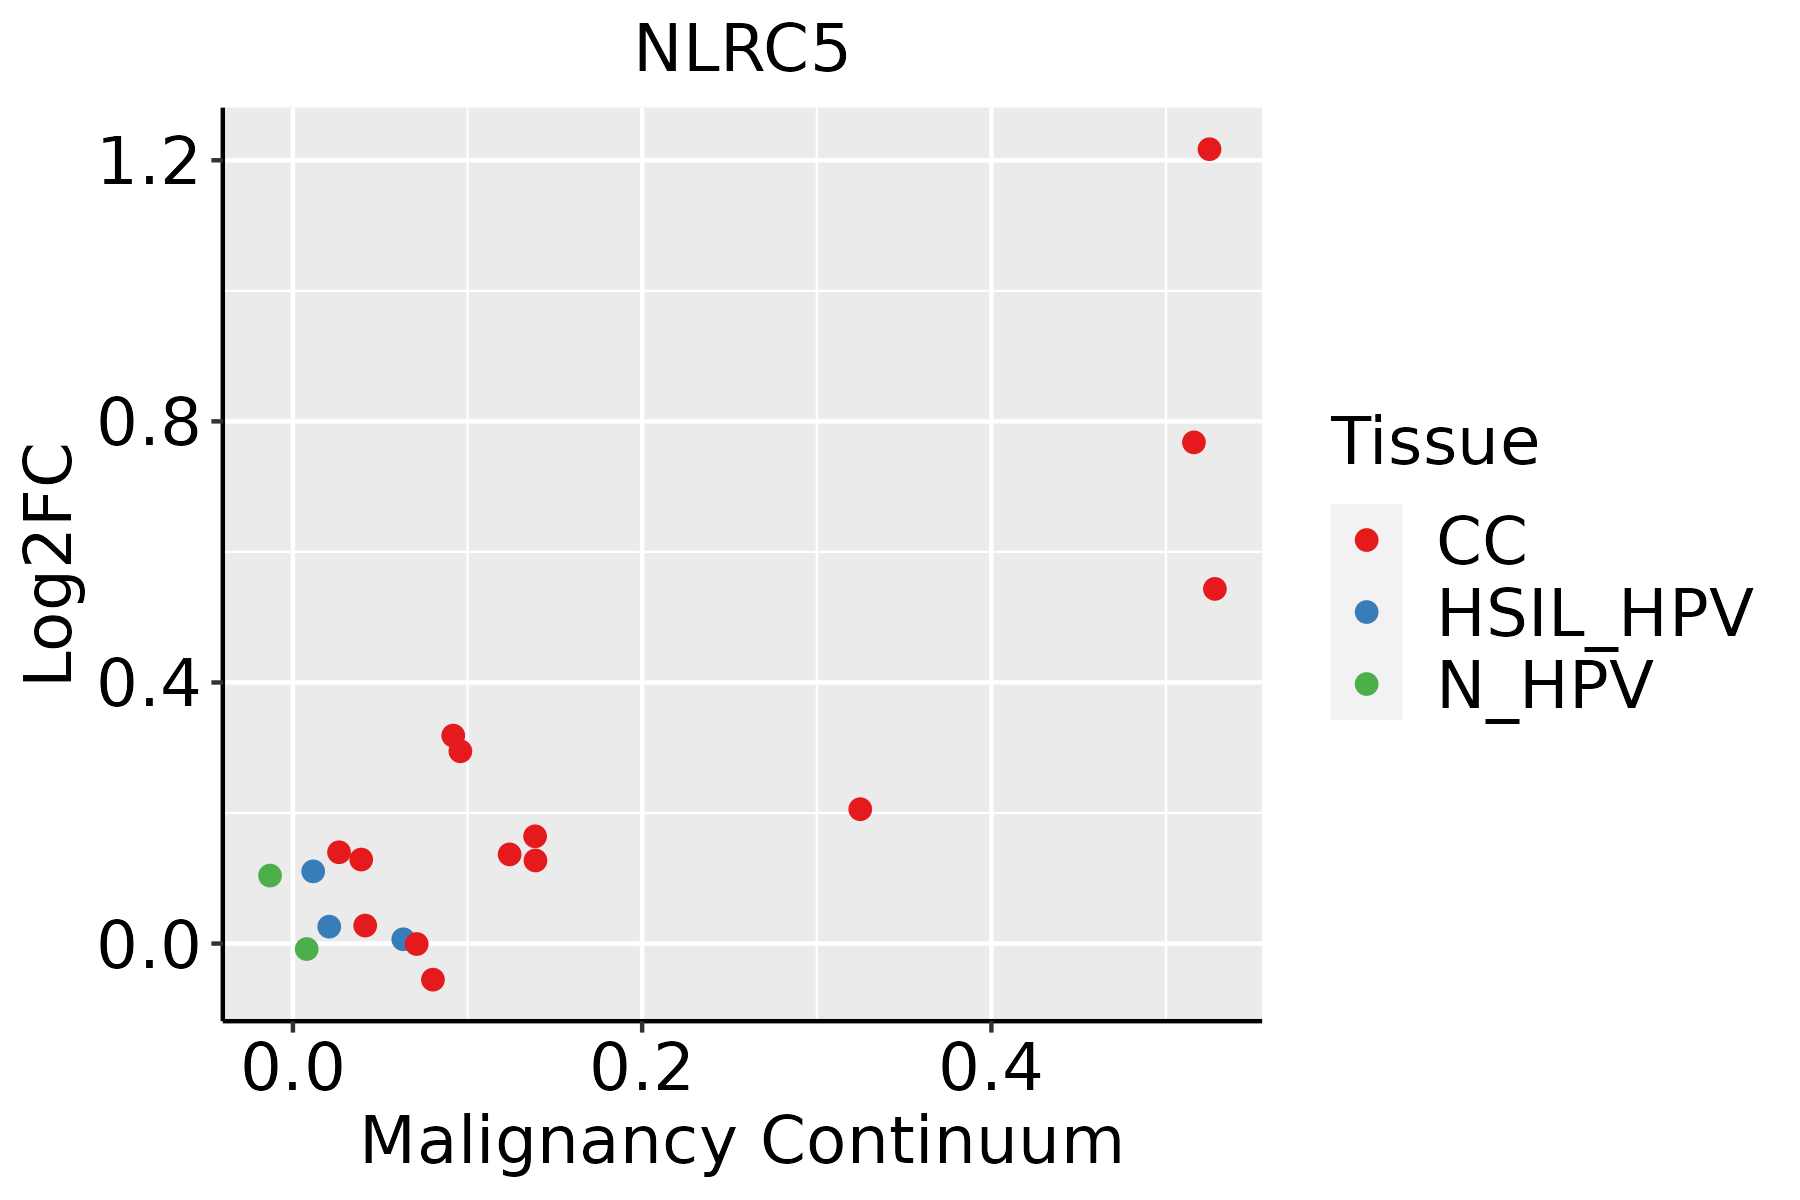 | CC: Cervix cancer |
| HSIL_HPV: HPV-infected high-grade squamous intraepithelial lesions |
| N_HPV: HPV-infected normal cervix |
| Colorectum (GSE201348) |  | FAP: Familial adenomatous polyposis |
| CRC: Colorectal cancer |
| Colorectum (HTA11) |  | AD: Adenomas |
| SER: Sessile serrated lesions |
| MSI-H: Microsatellite-high colorectal cancer |
| MSS: Microsatellite stable colorectal cancer |
| Esophagus |  | ESCC: Esophageal squamous cell carcinoma |
| HGIN: High-grade intraepithelial neoplasias |
| LGIN: Low-grade intraepithelial neoplasias |
| Oral Cavity | 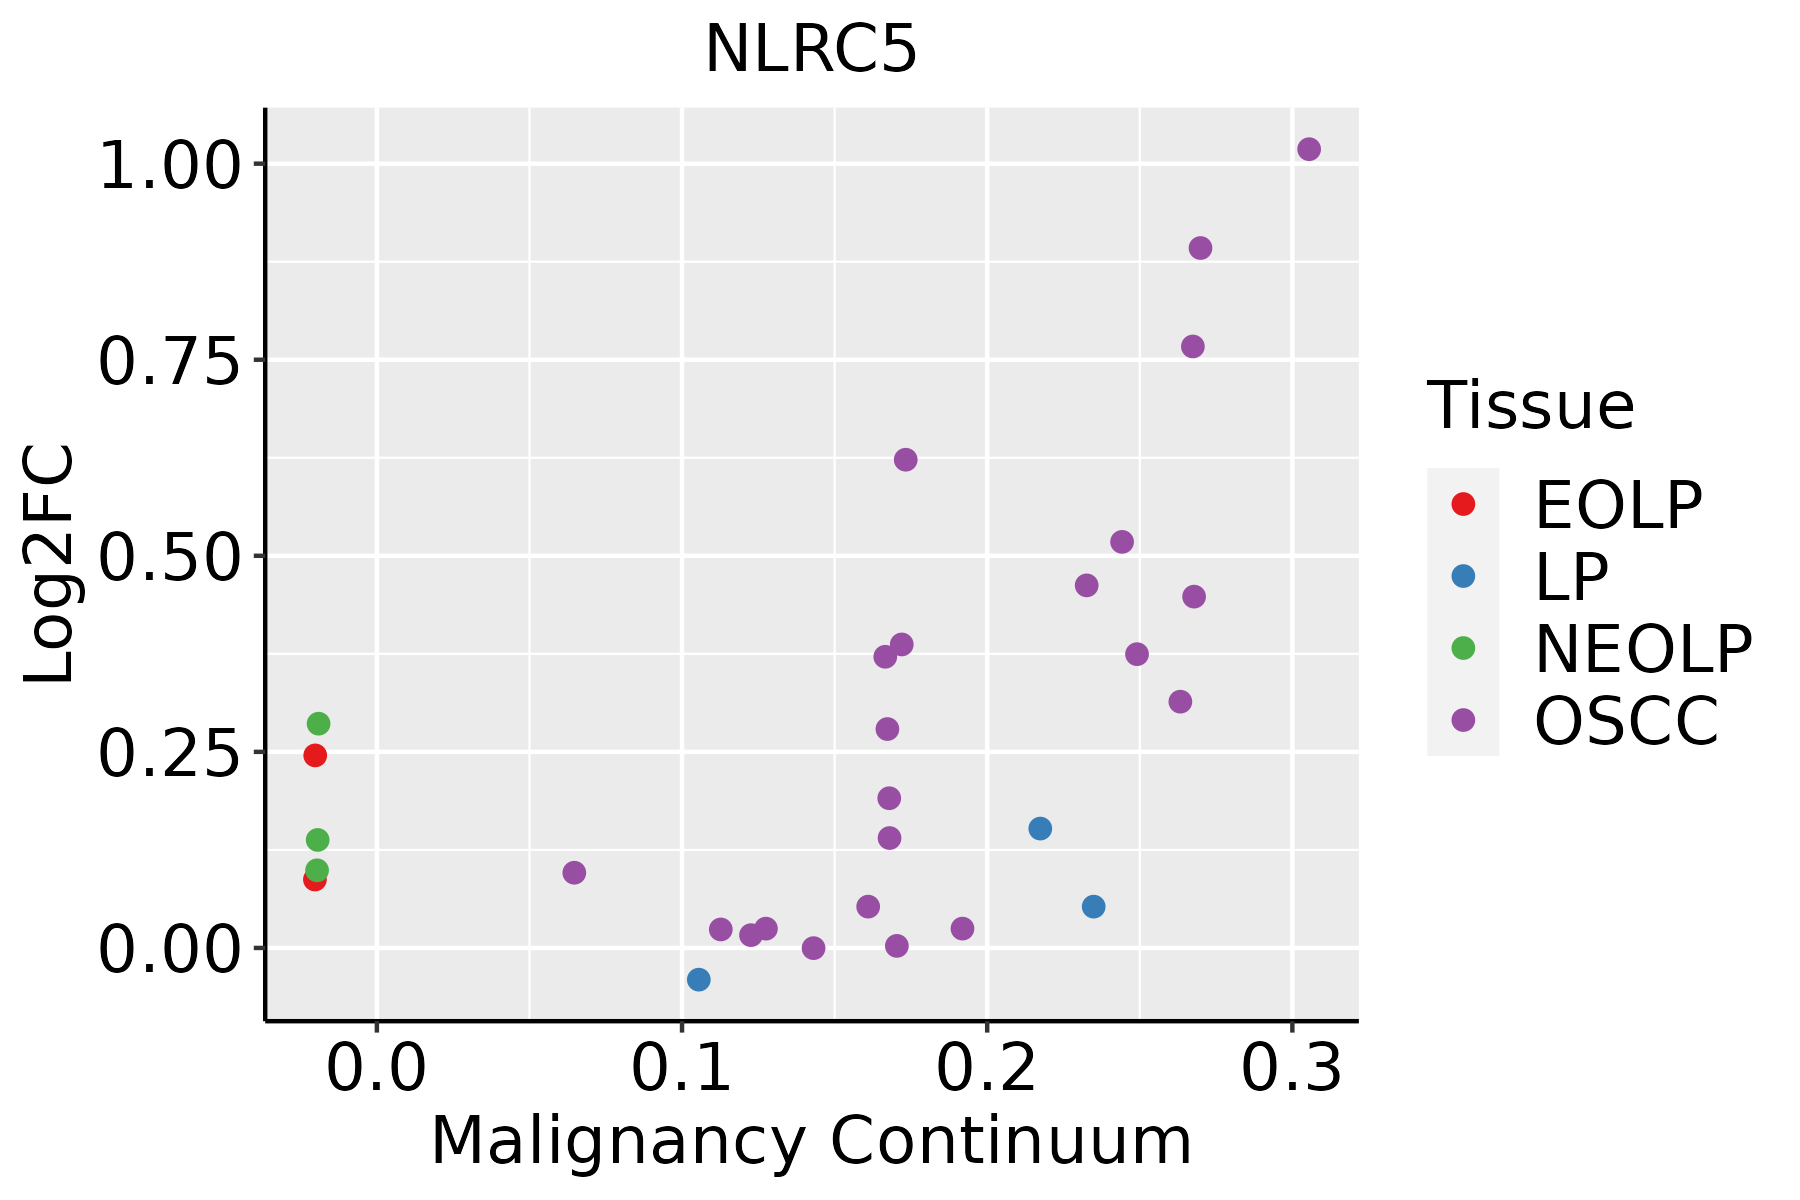 | EOLP: Erosive Oral lichen planus |
| LP: leukoplakia |
| NEOLP: Non-erosive oral lichen planus |
| OSCC: Oral squamous cell carcinoma |
| Thyroid | 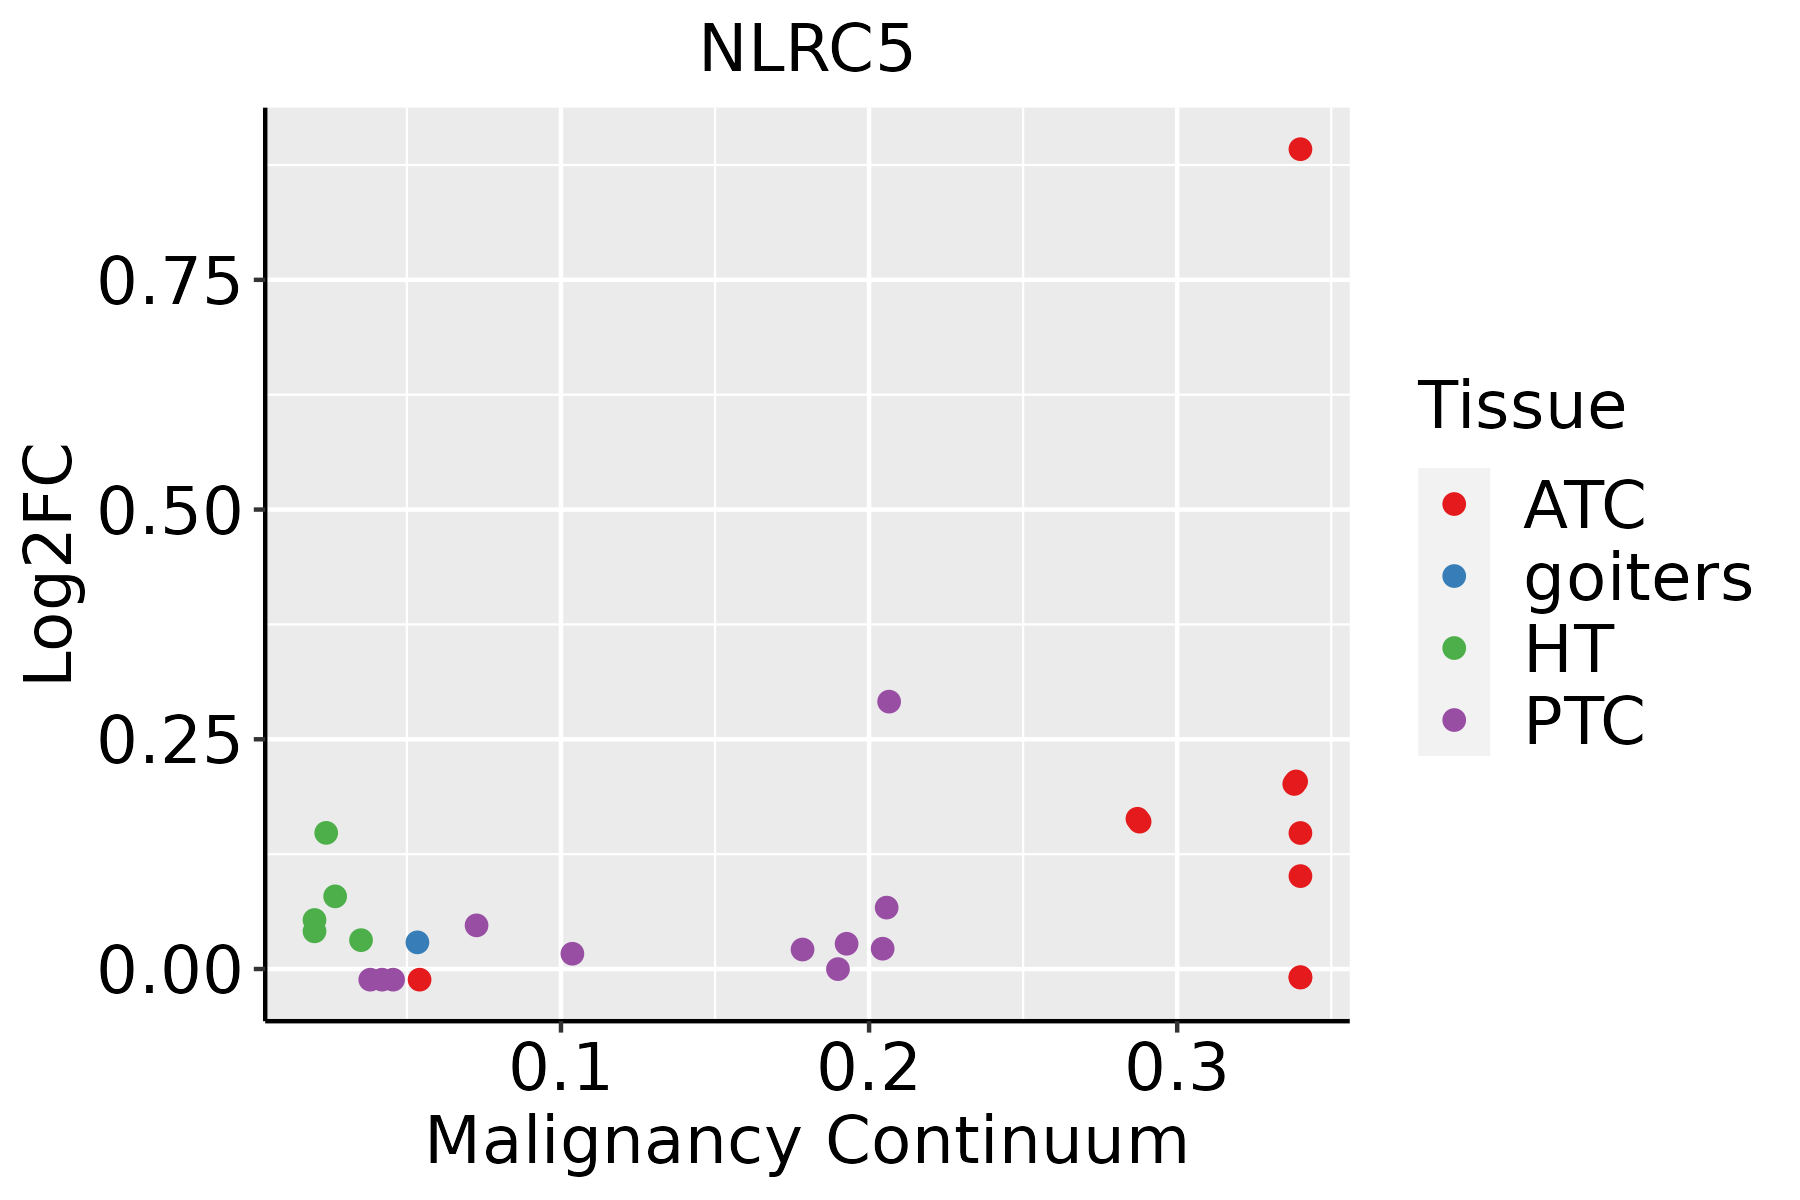 | ATC: Anaplastic thyroid cancer |
| HT: Hashimoto's thyroiditis |
| PTC: Papillary thyroid cancer |
| GO ID | Tissue | Disease Stage | Description | Gene Ratio | Bg Ratio | pvalue | p.adjust | Count |
| GO:00321035 | Cervix | CC | positive regulation of response to external stimulus | 95/2311 | 427/18723 | 5.44e-09 | 5.03e-07 | 95 |
| GO:00026837 | Cervix | CC | negative regulation of immune system process | 94/2311 | 434/18723 | 2.63e-08 | 1.87e-06 | 94 |
| GO:00510904 | Cervix | CC | regulation of DNA-binding transcription factor activity | 87/2311 | 440/18723 | 4.85e-06 | 1.22e-04 | 87 |
| GO:00313494 | Cervix | CC | positive regulation of defense response | 60/2311 | 278/18723 | 9.38e-06 | 2.11e-04 | 60 |
| GO:00028315 | Cervix | CC | regulation of response to biotic stimulus | 67/2311 | 327/18723 | 1.79e-05 | 3.36e-04 | 67 |
| GO:00096158 | Cervix | CC | response to virus | 73/2311 | 367/18723 | 2.22e-05 | 3.95e-04 | 73 |
| GO:00028322 | Cervix | CC | negative regulation of response to biotic stimulus | 27/2311 | 108/18723 | 2.27e-04 | 2.55e-03 | 27 |
| GO:00192213 | Cervix | CC | cytokine-mediated signaling pathway | 84/2311 | 472/18723 | 3.25e-04 | 3.44e-03 | 84 |
| GO:00507773 | Cervix | CC | negative regulation of immune response | 41/2311 | 194/18723 | 3.63e-04 | 3.76e-03 | 41 |
| GO:00321022 | Cervix | CC | negative regulation of response to external stimulus | 75/2311 | 420/18723 | 5.96e-04 | 5.61e-03 | 75 |
| GO:00450882 | Cervix | CC | regulation of innate immune response | 44/2311 | 218/18723 | 6.40e-04 | 5.97e-03 | 44 |
| GO:00028331 | Cervix | CC | positive regulation of response to biotic stimulus | 35/2311 | 168/18723 | 1.23e-03 | 9.87e-03 | 35 |
| GO:00343415 | Cervix | CC | response to interferon-gamma | 30/2311 | 141/18723 | 1.88e-03 | 1.39e-02 | 30 |
| GO:00458243 | Cervix | CC | negative regulation of innate immune response | 18/2311 | 71/18723 | 2.01e-03 | 1.47e-02 | 18 |
| GO:0031348 | Cervix | CC | negative regulation of defense response | 48/2311 | 258/18723 | 2.30e-03 | 1.65e-02 | 48 |
| GO:00603333 | Cervix | CC | interferon-gamma-mediated signaling pathway | 9/2311 | 27/18723 | 3.82e-03 | 2.41e-02 | 9 |
| GO:00713463 | Cervix | CC | cellular response to interferon-gamma | 25/2311 | 118/18723 | 4.54e-03 | 2.75e-02 | 25 |
| GO:00019612 | Cervix | CC | positive regulation of cytokine-mediated signaling pathway | 13/2311 | 50/18723 | 6.42e-03 | 3.58e-02 | 13 |
| GO:00607602 | Cervix | CC | positive regulation of response to cytokine stimulus | 14/2311 | 57/18723 | 8.17e-03 | 4.25e-02 | 14 |
| GO:0045089 | Cervix | CC | positive regulation of innate immune response | 26/2311 | 131/18723 | 9.33e-03 | 4.66e-02 | 26 |
| Hugo Symbol | Variant Class | Variant Classification | dbSNP RS | HGVSc | HGVSp | HGVSp Short | SWISSPROT | BIOTYPE | SIFT | PolyPhen | Tumor Sample Barcode | Tissue | Histology | Sex | Age | Stage | Therapy Types | Drugs | Outcome |
| NLRC5 | SNV | Missense_Mutation | | c.4628T>C | p.Met1543Thr | p.M1543T | Q86WI3 | protein_coding | tolerated(0.12) | benign(0.003) | TCGA-A8-A09A-01 | Breast | breast invasive carcinoma | Female | <65 | I/II | Hormone Therapy | tamoxiphen | SD |
| NLRC5 | SNV | Missense_Mutation | | c.4839N>C | p.Leu1613Phe | p.L1613F | Q86WI3 | protein_coding | tolerated(0.09) | probably_damaging(0.992) | TCGA-AC-A23H-01 | Breast | breast invasive carcinoma | Female | >=65 | I/II | Unknown | Unknown | PD |
| NLRC5 | SNV | Missense_Mutation | novel | c.2477G>T | p.Arg826Ile | p.R826I | Q86WI3 | protein_coding | deleterious(0.05) | benign(0.298) | TCGA-AC-A3QQ-01 | Breast | breast invasive carcinoma | Female | <65 | I/II | Unknown | Unknown | SD |
| NLRC5 | SNV | Missense_Mutation | | c.2015N>A | p.Cys672Tyr | p.C672Y | Q86WI3 | protein_coding | deleterious(0) | probably_damaging(0.98) | TCGA-BH-A0DX-01 | Breast | breast invasive carcinoma | Female | <65 | I/II | Chemotherapy | taxotere | CR |
| NLRC5 | SNV | Missense_Mutation | | c.5086N>T | p.Pro1696Ser | p.P1696S | Q86WI3 | protein_coding | tolerated(0.96) | benign(0.007) | TCGA-BH-A0HF-01 | Breast | breast invasive carcinoma | Female | >=65 | I/II | Hormone Therapy | arimidex | SD |
| NLRC5 | SNV | Missense_Mutation | | c.3506A>C | p.Gln1169Pro | p.Q1169P | Q86WI3 | protein_coding | deleterious(0.01) | possibly_damaging(0.642) | TCGA-BH-A18G-01 | Breast | breast invasive carcinoma | Female | >=65 | I/II | Unknown | Unknown | SD |
| NLRC5 | SNV | Missense_Mutation | rs755193749 | c.3028N>A | p.Asp1010Asn | p.D1010N | Q86WI3 | protein_coding | deleterious(0.03) | possibly_damaging(0.683) | TCGA-C8-A1HM-01 | Breast | breast invasive carcinoma | Female | >=65 | I/II | Chemotherapy | doxorubicin | CR |
| NLRC5 | SNV | Missense_Mutation | | c.185A>G | p.His62Arg | p.H62R | Q86WI3 | protein_coding | tolerated(0.34) | benign(0) | TCGA-D8-A1XK-01 | Breast | breast invasive carcinoma | Female | <65 | I/II | Chemotherapy | doxorubicine+cyclophosphamide | SD |
| NLRC5 | SNV | Missense_Mutation | | c.5270N>A | p.Ala1757Asp | p.A1757D | Q86WI3 | protein_coding | deleterious(0) | possibly_damaging(0.69) | TCGA-E9-A1R4-01 | Breast | breast invasive carcinoma | Female | >=65 | I/II | Chemotherapy | 5-fluorouracil | SD |
| NLRC5 | SNV | Missense_Mutation | | c.2403G>C | p.Arg801Ser | p.R801S | Q86WI3 | protein_coding | tolerated(0.07) | benign(0.011) | TCGA-GM-A2DD-01 | Breast | breast invasive carcinoma | Female | <65 | I/II | Chemotherapy | fluorouracil | CR |


