
|
|||||
|
 | |
| |
| |
| |
| |
| |
|
Gene: NLN |
Gene summary for NLN |
| Gene information | Species | Human | Gene symbol | NLN | Gene ID | 57486 |
| Gene name | neurolysin | |
| Gene Alias | AGTBP | |
| Cytomap | 5q12.3 | |
| Gene Type | protein-coding | GO ID | GO:0005975 | UniProtAcc | Q9BYT8 |
Top |
Malignant transformation analysis |
| Identification of the aberrant gene expression in precancerous and cancerous lesions by comparing the gene expression of stem-like cells in diseased tissues with normal stem cells |
| Entrez ID | Symbol | Replicates | Species | Organ | Tissue | Adj P-value | Log2FC | Malignancy |
| 57486 | NLN | LZE4T | Human | Esophagus | ESCC | 4.14e-12 | 3.79e-01 | 0.0811 |
| 57486 | NLN | LZE24T | Human | Esophagus | ESCC | 2.42e-05 | 2.03e-01 | 0.0596 |
| 57486 | NLN | P2T-E | Human | Esophagus | ESCC | 4.47e-24 | 4.14e-01 | 0.1177 |
| 57486 | NLN | P4T-E | Human | Esophagus | ESCC | 1.29e-13 | 3.68e-01 | 0.1323 |
| 57486 | NLN | P5T-E | Human | Esophagus | ESCC | 7.52e-23 | 3.51e-01 | 0.1327 |
| 57486 | NLN | P8T-E | Human | Esophagus | ESCC | 4.30e-10 | 1.37e-01 | 0.0889 |
| 57486 | NLN | P9T-E | Human | Esophagus | ESCC | 7.54e-19 | 4.48e-01 | 0.1131 |
| 57486 | NLN | P10T-E | Human | Esophagus | ESCC | 6.58e-16 | 2.78e-01 | 0.116 |
| 57486 | NLN | P11T-E | Human | Esophagus | ESCC | 3.75e-11 | 5.49e-01 | 0.1426 |
| 57486 | NLN | P12T-E | Human | Esophagus | ESCC | 4.16e-22 | 3.98e-01 | 0.1122 |
| 57486 | NLN | P15T-E | Human | Esophagus | ESCC | 1.58e-31 | 7.46e-01 | 0.1149 |
| 57486 | NLN | P16T-E | Human | Esophagus | ESCC | 4.36e-08 | 2.19e-01 | 0.1153 |
| 57486 | NLN | P17T-E | Human | Esophagus | ESCC | 2.39e-03 | 2.48e-01 | 0.1278 |
| 57486 | NLN | P19T-E | Human | Esophagus | ESCC | 4.88e-05 | 3.98e-01 | 0.1662 |
| 57486 | NLN | P20T-E | Human | Esophagus | ESCC | 2.63e-08 | 2.55e-01 | 0.1124 |
| 57486 | NLN | P21T-E | Human | Esophagus | ESCC | 4.55e-23 | 4.20e-01 | 0.1617 |
| 57486 | NLN | P22T-E | Human | Esophagus | ESCC | 1.85e-18 | 3.21e-01 | 0.1236 |
| 57486 | NLN | P23T-E | Human | Esophagus | ESCC | 4.11e-08 | 2.47e-01 | 0.108 |
| 57486 | NLN | P24T-E | Human | Esophagus | ESCC | 1.47e-14 | 2.78e-01 | 0.1287 |
| 57486 | NLN | P26T-E | Human | Esophagus | ESCC | 1.35e-23 | 3.96e-01 | 0.1276 |
| Page: 1 2 3 4 |
| Tissue | Expression Dynamics | Abbreviation |
| Esophagus | 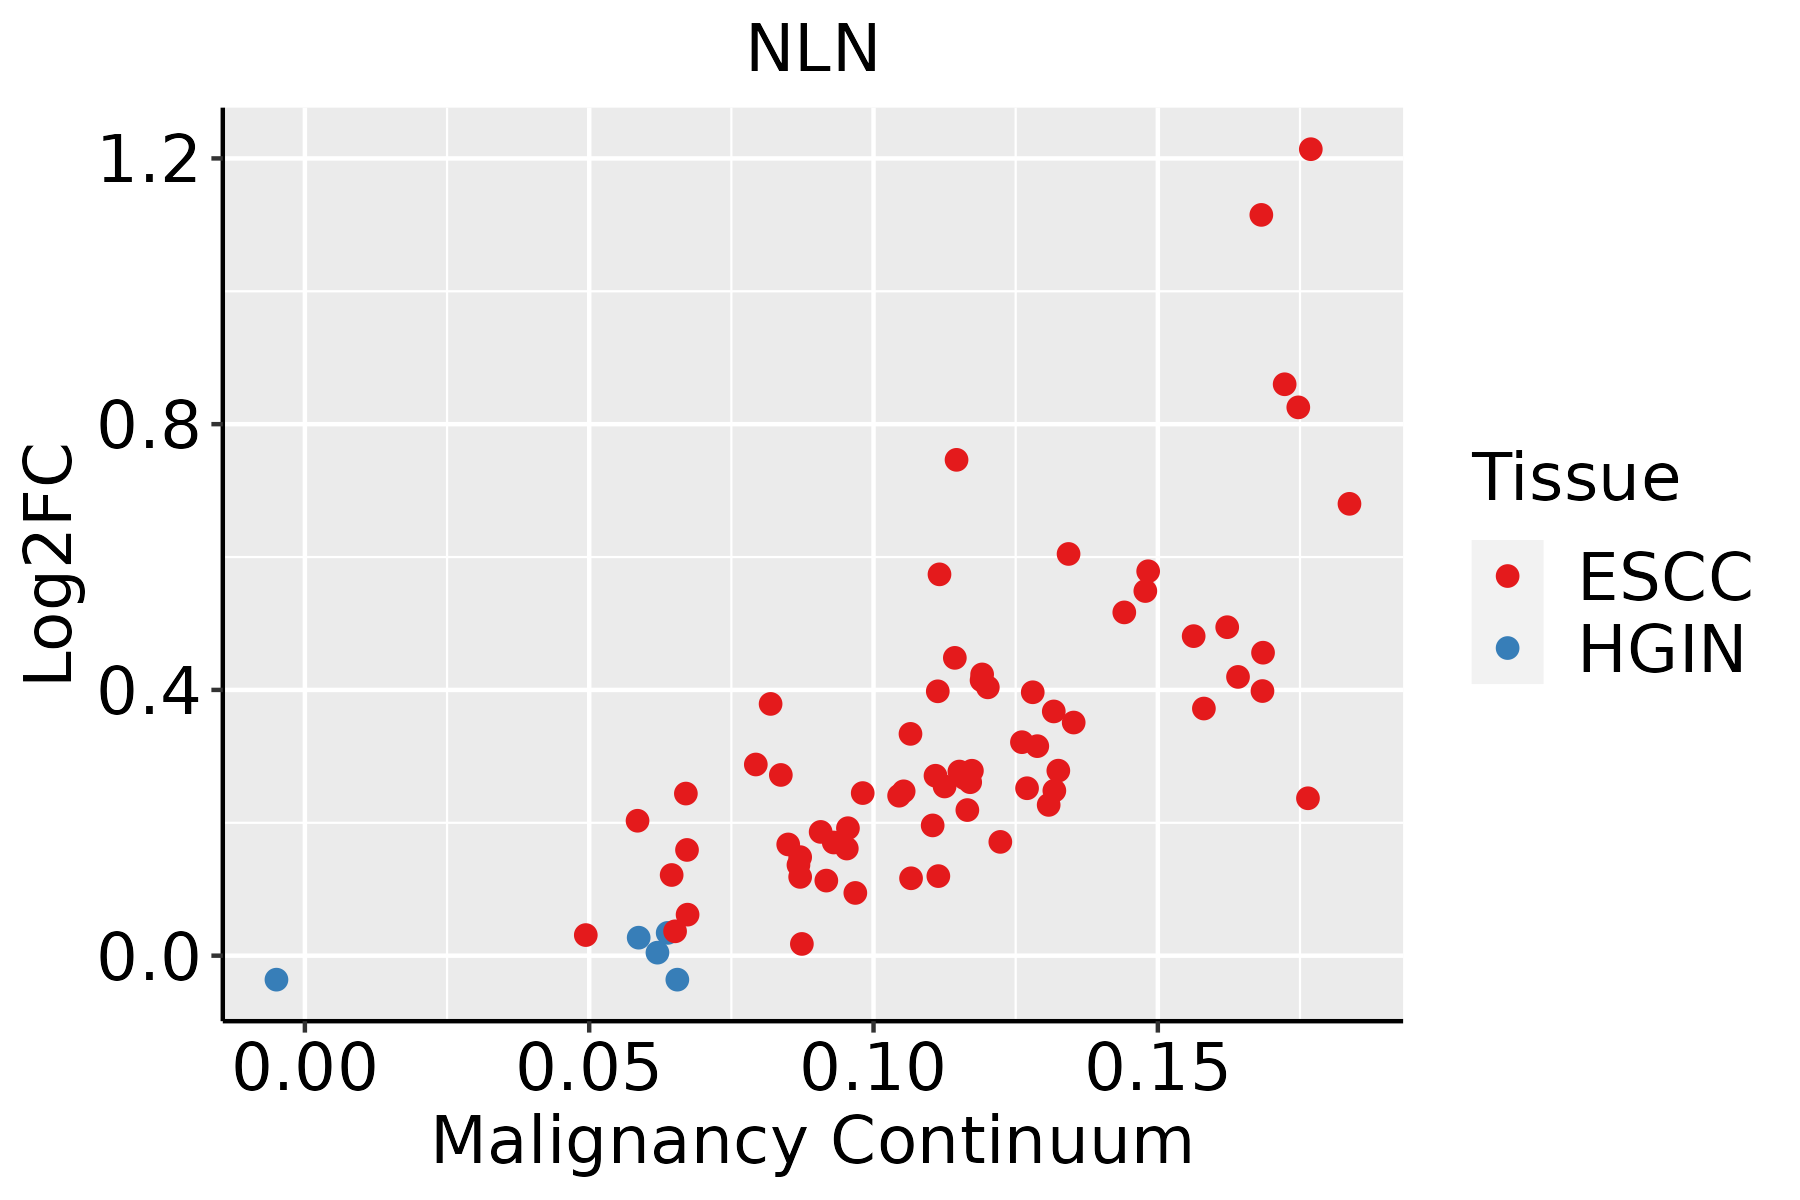 | ESCC: Esophageal squamous cell carcinoma |
| HGIN: High-grade intraepithelial neoplasias | ||
| LGIN: Low-grade intraepithelial neoplasias | ||
| Liver |  | HCC: Hepatocellular carcinoma |
| NAFLD: Non-alcoholic fatty liver disease |
| ∗log2FC in expression of this searched gene in stem-like cells from each diseased tissue sample relative to stem-like cells in normal samples in each tissue plotted against the malignancy continuum. Samples are colored based on if they are from different disease stage. |
Top |
Malignant transformation related pathway analysis |
| Find out the enriched GO biological processes and KEGG pathways involved in transition from healthy to precancer to cancer |
| Tissue | Disease Stage | Enriched GO biological Processes |
| Colorectum | AD |  |
| Colorectum | SER |  |
| Colorectum | MSS |  |
| Colorectum | MSI-H |  |
| Colorectum | FAP |  |
| ∗Top 15 enriched GO BP terms are showed in the bar plot of each disease state in each tissue. Each row represents a significant GO biological process which is colored according to the -log10(p.adjust). |
| Page: 1 2 3 4 5 6 7 8 9 |
| GO ID | Tissue | Disease Stage | Description | Gene Ratio | Bg Ratio | pvalue | p.adjust | Count |
| GO:014001414 | Esophagus | ESCC | mitotic nuclear division | 218/8552 | 287/18723 | 6.17e-26 | 1.78e-23 | 218 |
| GO:004477216 | Esophagus | ESCC | mitotic cell cycle phase transition | 281/8552 | 424/18723 | 4.63e-18 | 4.45e-16 | 281 |
| GO:000734615 | Esophagus | ESCC | regulation of mitotic cell cycle | 293/8552 | 457/18723 | 8.00e-16 | 5.64e-14 | 293 |
| GO:00482853 | Esophagus | ESCC | organelle fission | 301/8552 | 488/18723 | 4.64e-13 | 2.12e-11 | 301 |
| GO:00002802 | Esophagus | ESCC | nuclear division | 270/8552 | 439/18723 | 1.17e-11 | 4.24e-10 | 270 |
| GO:190198713 | Esophagus | ESCC | regulation of cell cycle phase transition | 242/8552 | 390/18723 | 3.86e-11 | 1.26e-09 | 242 |
| GO:190199013 | Esophagus | ESCC | regulation of mitotic cell cycle phase transition | 191/8552 | 299/18723 | 1.35e-10 | 3.94e-09 | 191 |
| GO:000028115 | Esophagus | ESCC | mitotic cytokinesis | 58/8552 | 71/18723 | 4.34e-10 | 1.15e-08 | 58 |
| GO:003250614 | Esophagus | ESCC | cytokinetic process | 35/8552 | 39/18723 | 9.38e-09 | 1.90e-07 | 35 |
| GO:000091016 | Esophagus | ESCC | cytokinesis | 115/8552 | 173/18723 | 2.48e-08 | 4.68e-07 | 115 |
| GO:006164015 | Esophagus | ESCC | cytoskeleton-dependent cytokinesis | 72/8552 | 100/18723 | 8.10e-08 | 1.39e-06 | 72 |
| GO:00059969 | Esophagus | ESCC | monosaccharide metabolic process | 159/8552 | 257/18723 | 1.11e-07 | 1.81e-06 | 159 |
| GO:00193189 | Esophagus | ESCC | hexose metabolic process | 147/8552 | 237/18723 | 2.63e-07 | 3.94e-06 | 147 |
| GO:003134616 | Esophagus | ESCC | positive regulation of cell projection organization | 201/8552 | 353/18723 | 1.19e-05 | 1.11e-04 | 201 |
| GO:00060069 | Esophagus | ESCC | glucose metabolic process | 119/8552 | 196/18723 | 1.51e-05 | 1.36e-04 | 119 |
| GO:003086517 | Esophagus | ESCC | cortical cytoskeleton organization | 44/8552 | 61/18723 | 2.50e-05 | 2.13e-04 | 44 |
| GO:00442626 | Esophagus | ESCC | cellular carbohydrate metabolic process | 160/8552 | 283/18723 | 1.43e-04 | 9.66e-04 | 160 |
| GO:006049118 | Esophagus | ESCC | regulation of cell projection assembly | 110/8552 | 188/18723 | 2.60e-04 | 1.58e-03 | 110 |
| GO:00160514 | Esophagus | ESCC | carbohydrate biosynthetic process | 117/8552 | 202/18723 | 2.96e-04 | 1.79e-03 | 117 |
| GO:00620129 | Esophagus | ESCC | regulation of small molecule metabolic process | 184/8552 | 334/18723 | 3.11e-04 | 1.85e-03 | 184 |
| Page: 1 2 3 4 5 6 7 |
| Pathway ID | Tissue | Disease Stage | Description | Gene Ratio | Bg Ratio | pvalue | p.adjust | qvalue | Count |
| Page: 1 |
Top |
Cell-cell communication analysis |
| Identification of potential cell-cell interactions between two cell types and their ligand-receptor pairs for different disease states |
| Ligand | Receptor | LRpair | Pathway | Tissue | Disease Stage |
| Page: 1 |
Top |
Single-cell gene regulatory network inference analysis |
| Find out the significant the regulons (TFs) and the target genes of each regulon across cell types for different disease states |
| TF | Cell Type | Tissue | Disease Stage | Target Gene | RSS | Regulon Activity |
| ∗The dot plots of a searched regulon are shown for all cell subpopulations in each disease state of each tissue based on the regulon specific score inferred using pySCENIC and by calculating the average expression. |
| Page: 1 |
Top |
Somatic mutation of malignant transformation related genes |
| Annotation of somatic variants for genes involved in malignant transformation |
| Hugo Symbol | Variant Class | Variant Classification | dbSNP RS | HGVSc | HGVSp | HGVSp Short | SWISSPROT | BIOTYPE | SIFT | PolyPhen | Tumor Sample Barcode | Tissue | Histology | Sex | Age | Stage | Therapy Types | Drugs | Outcome |
| NLN | SNV | Missense_Mutation | novel | c.304N>A | p.Glu102Lys | p.E102K | Q9BYT8 | protein_coding | tolerated(0.27) | benign(0.051) | TCGA-3C-AALI-01 | Breast | breast invasive carcinoma | Female | <65 | I/II | Unspecific | Poly E | Complete Response |
| NLN | SNV | Missense_Mutation | c.1734N>C | p.Gln578His | p.Q578H | Q9BYT8 | protein_coding | deleterious(0) | probably_damaging(0.995) | TCGA-A2-A0YK-01 | Breast | breast invasive carcinoma | Female | <65 | I/II | Chemotherapy | cytoxan | SD | |
| NLN | SNV | Missense_Mutation | novel | c.812N>T | p.Arg271Met | p.R271M | Q9BYT8 | protein_coding | deleterious(0) | probably_damaging(1) | TCGA-AC-A3TM-01 | Breast | breast invasive carcinoma | Female | <65 | III/IV | Chemotherapy | cytoxan | CR |
| NLN | SNV | Missense_Mutation | novel | c.1816G>A | p.Glu606Lys | p.E606K | Q9BYT8 | protein_coding | tolerated(0.22) | benign(0.041) | TCGA-BH-A2L8-01 | Breast | breast invasive carcinoma | Female | <65 | I/II | Chemotherapy | cytoxan | CR |
| NLN | SNV | Missense_Mutation | c.1101N>C | p.Gln367His | p.Q367H | Q9BYT8 | protein_coding | deleterious(0.03) | possibly_damaging(0.908) | TCGA-EW-A1IW-01 | Breast | breast invasive carcinoma | Female | >=65 | I/II | Hormone Therapy | aromasin | SD | |
| NLN | SNV | Missense_Mutation | novel | c.289N>A | p.Val97Ile | p.V97I | Q9BYT8 | protein_coding | deleterious(0.05) | benign(0.121) | TCGA-EW-A6SA-01 | Breast | breast invasive carcinoma | Male | <65 | I/II | Unknown | Unknown | SD |
| NLN | SNV | Missense_Mutation | novel | c.395T>G | p.Phe132Cys | p.F132C | Q9BYT8 | protein_coding | deleterious(0) | probably_damaging(0.995) | TCGA-2W-A8YY-01 | Cervix | cervical & endocervical cancer | Female | <65 | I/II | Chemotherapy | cisplatin | CR |
| NLN | SNV | Missense_Mutation | novel | c.1743N>C | p.Leu581Phe | p.L581F | Q9BYT8 | protein_coding | tolerated(0.15) | probably_damaging(0.943) | TCGA-C5-A1MH-01 | Cervix | cervical & endocervical cancer | Female | >=65 | III/IV | Chemotherapy | cisplatin | PD |
| NLN | SNV | Missense_Mutation | novel | c.430N>C | p.Glu144Gln | p.E144Q | Q9BYT8 | protein_coding | tolerated(1) | benign(0) | TCGA-C5-A2LZ-01 | Cervix | cervical & endocervical cancer | Female | >=65 | III/IV | Unknown | Unknown | PD |
| NLN | SNV | Missense_Mutation | novel | c.1051N>C | p.Glu351Gln | p.E351Q | Q9BYT8 | protein_coding | tolerated(0.35) | benign(0.042) | TCGA-JW-A5VL-01 | Cervix | cervical & endocervical cancer | Female | <65 | I/II | Unknown | Unknown | SD |
| Page: 1 2 3 4 5 6 |
Top |
Related drugs of malignant transformation related genes |
| Identification of chemicals and drugs interact with genes involved in malignant transfromation |
| (DGIdb 4.0) |
| Entrez ID | Symbol | Category | Interaction Types | Drug Claim Name | Drug Name | PMIDs |
| Page: 1 |

Copyright 2023-Present -The University of Texas Health Science Center at Houston |