
|
|||||
|
 | |
| |
| |
| |
| |
| |
|
Gene: NLK |
Gene summary for NLK |
| Gene information | Species | Human | Gene symbol | NLK | Gene ID | 51701 |
| Gene name | nemo like kinase | |
| Gene Alias | NLK | |
| Cytomap | 17q11.2 | |
| Gene Type | protein-coding | GO ID | GO:0000165 | UniProtAcc | A0A024QZ12 |
Top |
Malignant transformation analysis |
| Identification of the aberrant gene expression in precancerous and cancerous lesions by comparing the gene expression of stem-like cells in diseased tissues with normal stem cells |
| Entrez ID | Symbol | Replicates | Species | Organ | Tissue | Adj P-value | Log2FC | Malignancy |
| 51701 | NLK | HTA11_3410_2000001011 | Human | Colorectum | AD | 1.46e-05 | -4.57e-01 | 0.0155 |
| 51701 | NLK | HTA11_2487_2000001011 | Human | Colorectum | SER | 2.31e-04 | -5.03e-01 | -0.1808 |
| 51701 | NLK | HTA11_3361_2000001011 | Human | Colorectum | AD | 1.46e-04 | -5.68e-01 | -0.1207 |
| 51701 | NLK | HTA11_696_2000001011 | Human | Colorectum | AD | 4.58e-03 | -2.86e-01 | -0.1464 |
| 51701 | NLK | HTA11_866_3004761011 | Human | Colorectum | AD | 2.51e-06 | -4.99e-01 | 0.096 |
| 51701 | NLK | HTA11_7696_3000711011 | Human | Colorectum | AD | 6.85e-19 | -5.41e-01 | 0.0674 |
| 51701 | NLK | HTA11_99999970781_79442 | Human | Colorectum | MSS | 1.06e-06 | -4.25e-01 | 0.294 |
| 51701 | NLK | HTA11_99999971662_82457 | Human | Colorectum | MSS | 3.21e-10 | -4.44e-01 | 0.3859 |
| 51701 | NLK | HTA11_99999973899_84307 | Human | Colorectum | MSS | 1.27e-04 | -6.62e-01 | 0.2585 |
| 51701 | NLK | HTA11_99999974143_84620 | Human | Colorectum | MSS | 1.15e-16 | -5.21e-01 | 0.3005 |
| 51701 | NLK | A015-C-203 | Human | Colorectum | FAP | 2.61e-35 | -6.16e-01 | -0.1294 |
| 51701 | NLK | A015-C-204 | Human | Colorectum | FAP | 7.22e-08 | -4.93e-01 | -0.0228 |
| 51701 | NLK | A014-C-040 | Human | Colorectum | FAP | 6.03e-04 | -5.40e-01 | -0.1184 |
| 51701 | NLK | A002-C-201 | Human | Colorectum | FAP | 3.94e-16 | -4.56e-01 | 0.0324 |
| 51701 | NLK | A002-C-203 | Human | Colorectum | FAP | 2.28e-06 | -2.81e-01 | 0.2786 |
| 51701 | NLK | A001-C-119 | Human | Colorectum | FAP | 3.24e-09 | -5.50e-01 | -0.1557 |
| 51701 | NLK | A001-C-108 | Human | Colorectum | FAP | 1.13e-29 | -5.42e-01 | -0.0272 |
| 51701 | NLK | A002-C-205 | Human | Colorectum | FAP | 4.46e-22 | -5.90e-01 | -0.1236 |
| 51701 | NLK | A001-C-104 | Human | Colorectum | FAP | 4.81e-09 | -4.01e-01 | 0.0184 |
| 51701 | NLK | A015-C-005 | Human | Colorectum | FAP | 3.03e-06 | -4.68e-01 | -0.0336 |
| Page: 1 2 3 |
| Tissue | Expression Dynamics | Abbreviation |
| Colorectum (GSE201348) |  | FAP: Familial adenomatous polyposis |
| CRC: Colorectal cancer | ||
| Colorectum (HTA11) |  | AD: Adenomas |
| SER: Sessile serrated lesions | ||
| MSI-H: Microsatellite-high colorectal cancer | ||
| MSS: Microsatellite stable colorectal cancer | ||
| Lung | 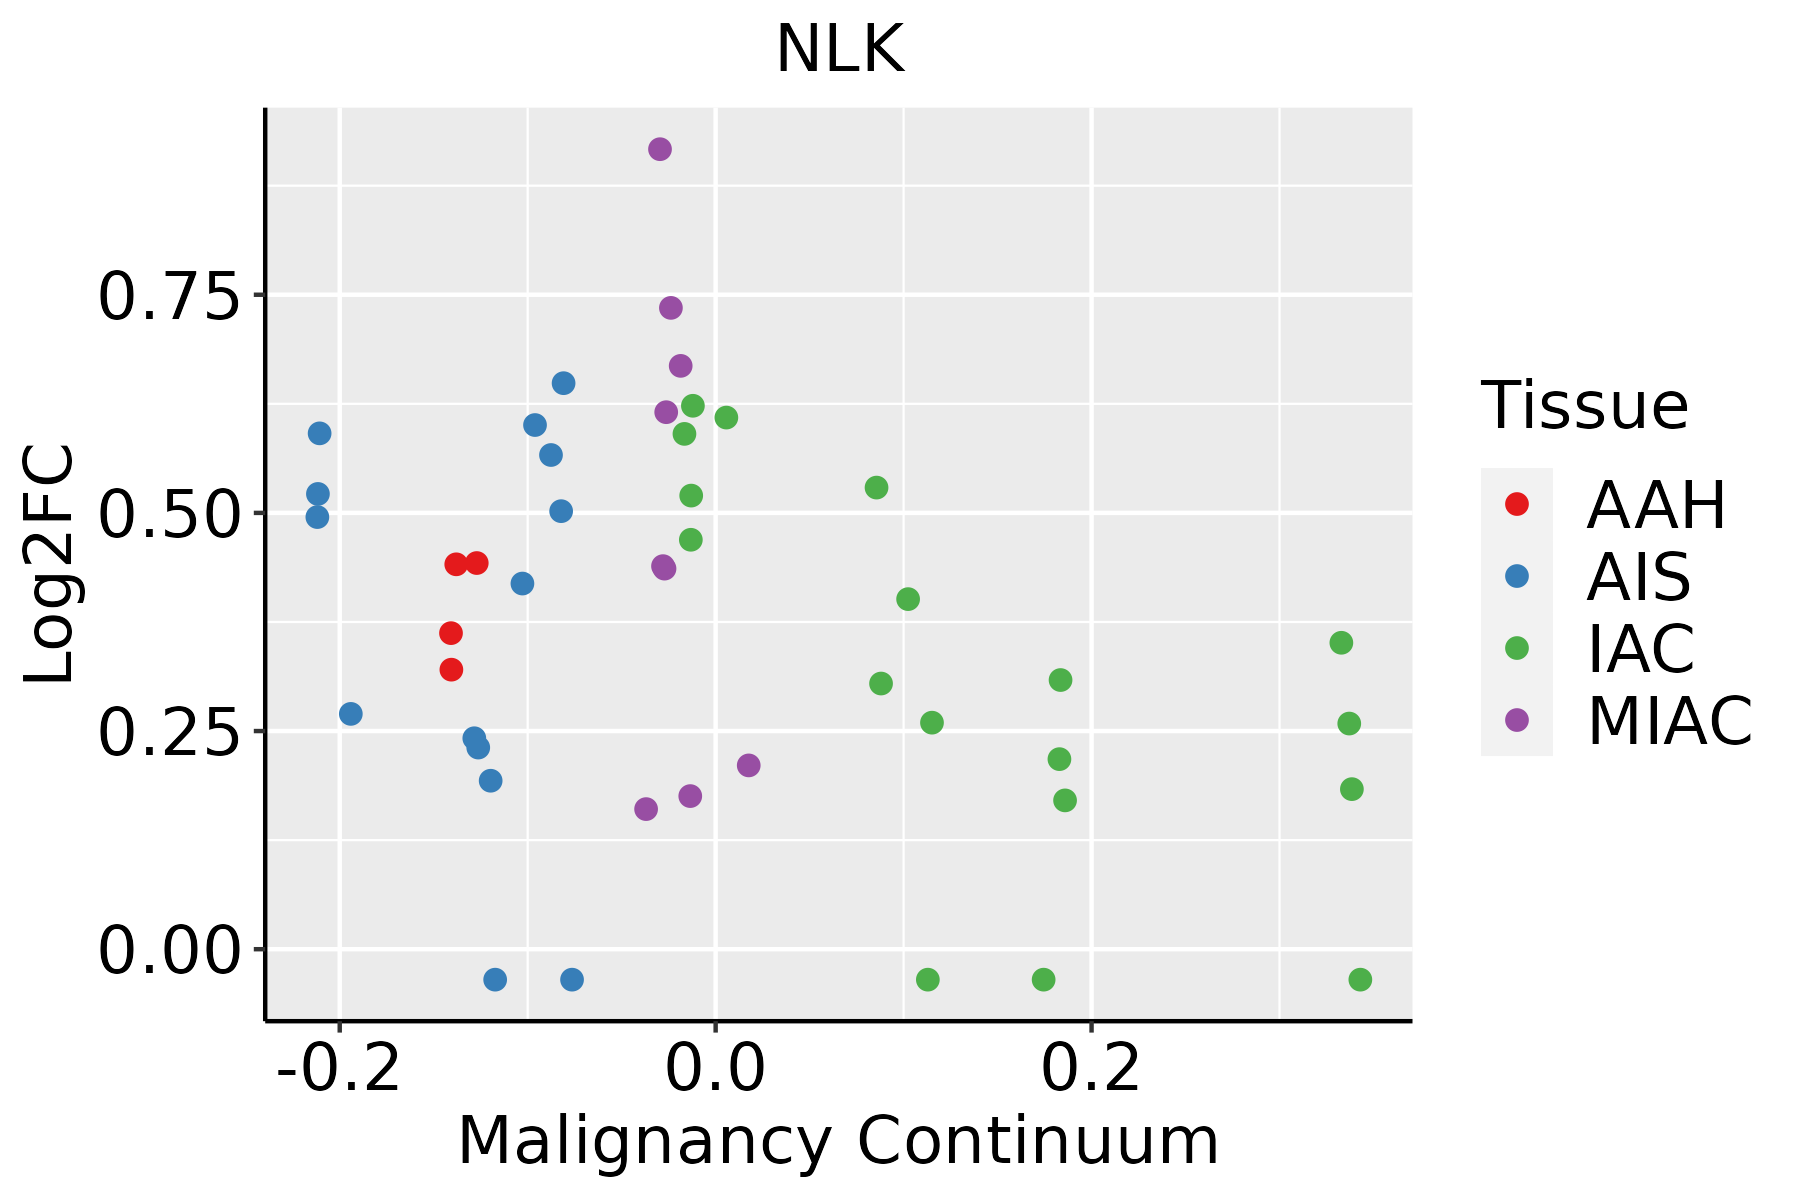 | AAH: Atypical adenomatous hyperplasia |
| AIS: Adenocarcinoma in situ | ||
| IAC: Invasive lung adenocarcinoma | ||
| MIA: Minimally invasive adenocarcinoma | ||
| Prostate | 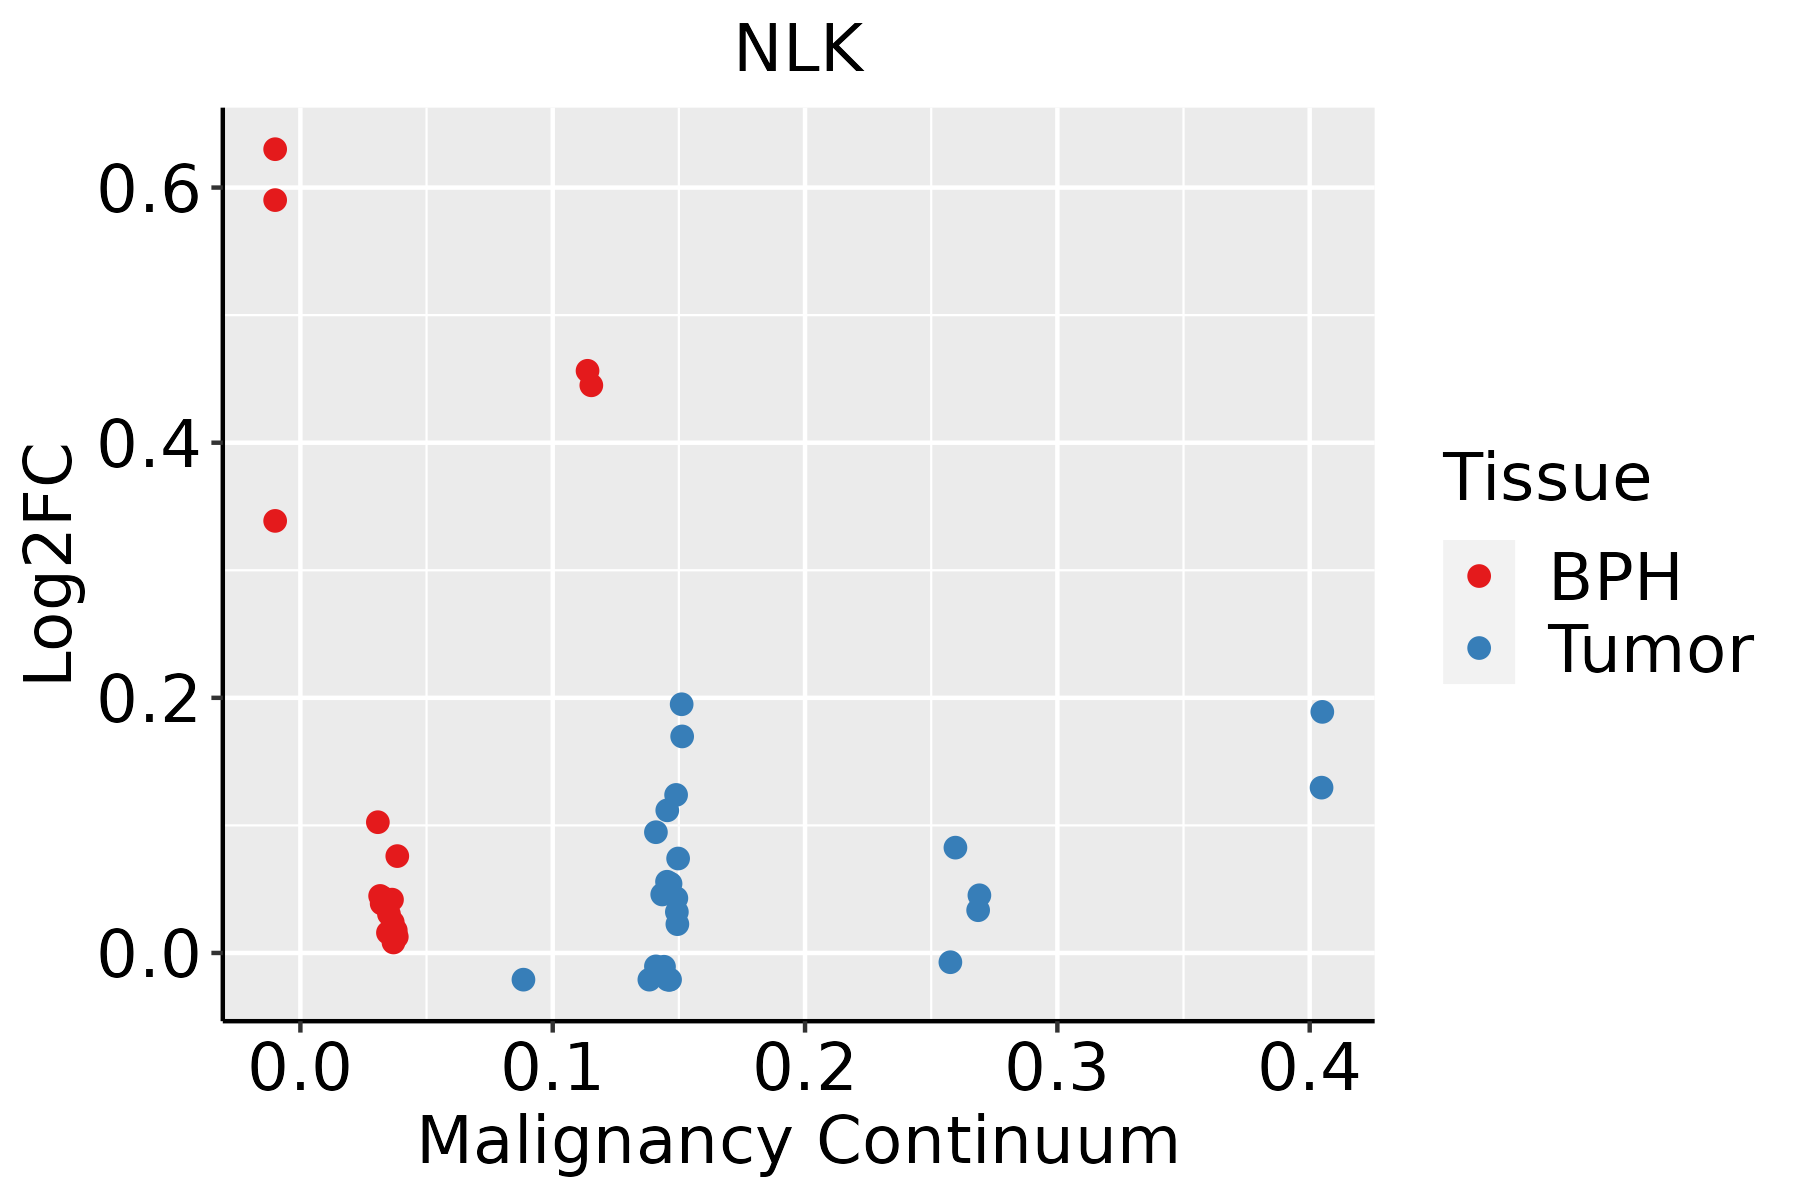 | BPH: Benign Prostatic Hyperplasia |
| ∗log2FC in expression of this searched gene in stem-like cells from each diseased tissue sample relative to stem-like cells in normal samples in each tissue plotted against the malignancy continuum. Samples are colored based on if they are from different disease stage. |
Top |
Malignant transformation related pathway analysis |
| Find out the enriched GO biological processes and KEGG pathways involved in transition from healthy to precancer to cancer |
| Tissue | Disease Stage | Enriched GO biological Processes |
| Colorectum | AD |  |
| Colorectum | SER |  |
| Colorectum | MSS |  |
| Colorectum | MSI-H |  |
| Colorectum | FAP |  |
| ∗Top 15 enriched GO BP terms are showed in the bar plot of each disease state in each tissue. Each row represents a significant GO biological process which is colored according to the -log10(p.adjust). |
| Page: 1 2 3 4 5 6 7 8 9 |
| GO ID | Tissue | Disease Stage | Description | Gene Ratio | Bg Ratio | pvalue | p.adjust | Count |
| GO:0031647 | Colorectum | AD | regulation of protein stability | 108/3918 | 298/18723 | 6.33e-10 | 5.08e-08 | 108 |
| GO:0050821 | Colorectum | AD | protein stabilization | 73/3918 | 191/18723 | 3.02e-08 | 1.64e-06 | 73 |
| GO:0030111 | Colorectum | AD | regulation of Wnt signaling pathway | 102/3918 | 328/18723 | 8.51e-06 | 2.03e-04 | 102 |
| GO:0016055 | Colorectum | AD | Wnt signaling pathway | 130/3918 | 444/18723 | 1.60e-05 | 3.37e-04 | 130 |
| GO:0198738 | Colorectum | AD | cell-cell signaling by wnt | 130/3918 | 446/18723 | 2.02e-05 | 4.10e-04 | 130 |
| GO:0046777 | Colorectum | AD | protein autophosphorylation | 74/3918 | 227/18723 | 2.48e-05 | 4.76e-04 | 74 |
| GO:0007178 | Colorectum | AD | transmembrane receptor protein serine/threonine kinase signaling pathway | 99/3918 | 355/18723 | 9.92e-04 | 9.28e-03 | 99 |
| GO:0071559 | Colorectum | AD | response to transforming growth factor beta | 74/3918 | 256/18723 | 1.45e-03 | 1.23e-02 | 74 |
| GO:0018105 | Colorectum | AD | peptidyl-serine phosphorylation | 88/3918 | 315/18723 | 1.73e-03 | 1.43e-02 | 88 |
| GO:0071560 | Colorectum | AD | cellular response to transforming growth factor beta stimulus | 72/3918 | 250/18723 | 1.85e-03 | 1.52e-02 | 72 |
| GO:0007179 | Colorectum | AD | transforming growth factor beta receptor signaling pathway | 59/3918 | 198/18723 | 1.94e-03 | 1.58e-02 | 59 |
| GO:0018210 | Colorectum | AD | peptidyl-threonine modification | 40/3918 | 125/18723 | 2.44e-03 | 1.88e-02 | 40 |
| GO:0018209 | Colorectum | AD | peptidyl-serine modification | 92/3918 | 338/18723 | 3.19e-03 | 2.36e-02 | 92 |
| GO:0018107 | Colorectum | AD | peptidyl-threonine phosphorylation | 37/3918 | 116/18723 | 3.68e-03 | 2.61e-02 | 37 |
| GO:00316471 | Colorectum | SER | regulation of protein stability | 86/2897 | 298/18723 | 2.56e-09 | 2.42e-07 | 86 |
| GO:00508211 | Colorectum | SER | protein stabilization | 58/2897 | 191/18723 | 1.46e-07 | 8.59e-06 | 58 |
| GO:00467771 | Colorectum | SER | protein autophosphorylation | 60/2897 | 227/18723 | 1.36e-05 | 4.25e-04 | 60 |
| GO:00160551 | Colorectum | SER | Wnt signaling pathway | 97/2897 | 444/18723 | 2.02e-04 | 3.68e-03 | 97 |
| GO:01987381 | Colorectum | SER | cell-cell signaling by wnt | 97/2897 | 446/18723 | 2.39e-04 | 4.11e-03 | 97 |
| GO:00301111 | Colorectum | SER | regulation of Wnt signaling pathway | 75/2897 | 328/18723 | 2.47e-04 | 4.20e-03 | 75 |
| Page: 1 2 3 4 5 6 7 |
| Pathway ID | Tissue | Disease Stage | Description | Gene Ratio | Bg Ratio | pvalue | p.adjust | qvalue | Count |
| hsa04520 | Colorectum | AD | Adherens junction | 50/2092 | 93/8465 | 1.52e-09 | 2.83e-08 | 1.81e-08 | 50 |
| hsa04310 | Colorectum | AD | Wnt signaling pathway | 56/2092 | 171/8465 | 1.03e-02 | 3.93e-02 | 2.51e-02 | 56 |
| hsa045201 | Colorectum | AD | Adherens junction | 50/2092 | 93/8465 | 1.52e-09 | 2.83e-08 | 1.81e-08 | 50 |
| hsa043101 | Colorectum | AD | Wnt signaling pathway | 56/2092 | 171/8465 | 1.03e-02 | 3.93e-02 | 2.51e-02 | 56 |
| hsa045202 | Colorectum | SER | Adherens junction | 37/1580 | 93/8465 | 1.54e-06 | 2.35e-05 | 1.71e-05 | 37 |
| hsa045203 | Colorectum | SER | Adherens junction | 37/1580 | 93/8465 | 1.54e-06 | 2.35e-05 | 1.71e-05 | 37 |
| hsa045204 | Colorectum | MSS | Adherens junction | 42/1875 | 93/8465 | 6.18e-07 | 9.01e-06 | 5.52e-06 | 42 |
| hsa043102 | Colorectum | MSS | Wnt signaling pathway | 53/1875 | 171/8465 | 4.24e-03 | 1.86e-02 | 1.14e-02 | 53 |
| hsa045205 | Colorectum | MSS | Adherens junction | 42/1875 | 93/8465 | 6.18e-07 | 9.01e-06 | 5.52e-06 | 42 |
| hsa043103 | Colorectum | MSS | Wnt signaling pathway | 53/1875 | 171/8465 | 4.24e-03 | 1.86e-02 | 1.14e-02 | 53 |
| hsa045208 | Colorectum | FAP | Adherens junction | 45/1404 | 93/8465 | 8.66e-13 | 2.89e-10 | 1.76e-10 | 45 |
| hsa043104 | Colorectum | FAP | Wnt signaling pathway | 46/1404 | 171/8465 | 3.94e-04 | 3.06e-03 | 1.86e-03 | 46 |
| hsa04010 | Colorectum | FAP | MAPK signaling pathway | 68/1404 | 302/8465 | 4.00e-03 | 1.67e-02 | 1.02e-02 | 68 |
| hsa045209 | Colorectum | FAP | Adherens junction | 45/1404 | 93/8465 | 8.66e-13 | 2.89e-10 | 1.76e-10 | 45 |
| hsa043105 | Colorectum | FAP | Wnt signaling pathway | 46/1404 | 171/8465 | 3.94e-04 | 3.06e-03 | 1.86e-03 | 46 |
| hsa040101 | Colorectum | FAP | MAPK signaling pathway | 68/1404 | 302/8465 | 4.00e-03 | 1.67e-02 | 1.02e-02 | 68 |
| hsa0452010 | Colorectum | CRC | Adherens junction | 37/1091 | 93/8465 | 5.72e-11 | 6.37e-09 | 4.32e-09 | 37 |
| hsa043106 | Colorectum | CRC | Wnt signaling pathway | 40/1091 | 171/8465 | 1.01e-04 | 1.57e-03 | 1.07e-03 | 40 |
| hsa040102 | Colorectum | CRC | MAPK signaling pathway | 56/1091 | 302/8465 | 2.76e-03 | 1.77e-02 | 1.20e-02 | 56 |
| hsa0452011 | Colorectum | CRC | Adherens junction | 37/1091 | 93/8465 | 5.72e-11 | 6.37e-09 | 4.32e-09 | 37 |
| Page: 1 2 3 |
Top |
Cell-cell communication analysis |
| Identification of potential cell-cell interactions between two cell types and their ligand-receptor pairs for different disease states |
| Ligand | Receptor | LRpair | Pathway | Tissue | Disease Stage |
| Page: 1 |
Top |
Single-cell gene regulatory network inference analysis |
| Find out the significant the regulons (TFs) and the target genes of each regulon across cell types for different disease states |
| TF | Cell Type | Tissue | Disease Stage | Target Gene | RSS | Regulon Activity |
| ∗The dot plots of a searched regulon are shown for all cell subpopulations in each disease state of each tissue based on the regulon specific score inferred using pySCENIC and by calculating the average expression. |
| Page: 1 |
Top |
Somatic mutation of malignant transformation related genes |
| Annotation of somatic variants for genes involved in malignant transformation |
| Hugo Symbol | Variant Class | Variant Classification | dbSNP RS | HGVSc | HGVSp | HGVSp Short | SWISSPROT | BIOTYPE | SIFT | PolyPhen | Tumor Sample Barcode | Tissue | Histology | Sex | Age | Stage | Therapy Types | Drugs | Outcome |
| NLK | SNV | Missense_Mutation | novel | c.1052N>G | p.Asp351Gly | p.D351G | Q9UBE8 | protein_coding | tolerated(0.06) | possibly_damaging(0.675) | TCGA-AO-A1KT-01 | Breast | breast invasive carcinoma | Female | >=65 | I/II | Chemotherapy | fluorouracil | SD |
| NLK | SNV | Missense_Mutation | c.979G>A | p.Val327Met | p.V327M | Q9UBE8 | protein_coding | deleterious(0) | probably_damaging(0.996) | TCGA-B6-A0IE-01 | Breast | breast invasive carcinoma | Female | <65 | III/IV | Unknown | Unknown | PD | |
| NLK | insertion | Nonsense_Mutation | novel | c.1093_1094insGAGCCTCGCTCTGTTGTCCAGGCTGGAGTGCAGTGGTGTGATC | p.Met365ArgfsTer14 | p.M365Rfs*14 | Q9UBE8 | protein_coding | TCGA-3C-AALJ-01 | Breast | breast invasive carcinoma | Female | <65 | I/II | Chemotherapy | doxorubicin | SD | ||
| NLK | insertion | Frame_Shift_Ins | novel | c.1519_1520insTAAAGAAAAATAGAAGGAAAGGGAAGCCAAGG | p.Ser507IlefsTer37 | p.S507Ifs*37 | Q9UBE8 | protein_coding | TCGA-AN-A046-01 | Breast | breast invasive carcinoma | Female | >=65 | I/II | Unknown | Unknown | SD | ||
| NLK | deletion | In_Frame_Del | rs780017549 | c.225_242delCGCAGCAGCGGCTGCAGC | p.Ala78_Ala83del | p.A78_A83del | Q9UBE8 | protein_coding | TCGA-AR-A24Z-01 | Breast | breast invasive carcinoma | Female | <65 | I/II | Chemotherapy | doxorubicin | SD | ||
| NLK | SNV | Missense_Mutation | novel | c.601N>A | p.Leu201Ile | p.L201I | Q9UBE8 | protein_coding | tolerated(0.26) | benign(0.194) | TCGA-2W-A8YY-01 | Cervix | cervical & endocervical cancer | Female | <65 | I/II | Chemotherapy | cisplatin | CR |
| NLK | SNV | Missense_Mutation | novel | c.1244G>C | p.Arg415Thr | p.R415T | Q9UBE8 | protein_coding | deleterious(0) | probably_damaging(0.988) | TCGA-C5-A1MH-01 | Cervix | cervical & endocervical cancer | Female | >=65 | III/IV | Chemotherapy | cisplatin | PD |
| NLK | SNV | Missense_Mutation | c.986G>A | p.Cys329Tyr | p.C329Y | Q9UBE8 | protein_coding | deleterious(0) | probably_damaging(1) | TCGA-A6-5661-01 | Colorectum | colon adenocarcinoma | Female | >=65 | I/II | Unknown | Unknown | SD | |
| NLK | SNV | Missense_Mutation | c.472N>T | p.Pro158Ser | p.P158S | Q9UBE8 | protein_coding | tolerated(0.28) | probably_damaging(1) | TCGA-AZ-4615-01 | Colorectum | colon adenocarcinoma | Male | >=65 | III/IV | Chemotherapy | xeloda | PD | |
| NLK | SNV | Missense_Mutation | c.847N>G | p.Phe283Val | p.F283V | Q9UBE8 | protein_coding | deleterious(0) | probably_damaging(0.995) | TCGA-F4-6805-01 | Colorectum | colon adenocarcinoma | Female | <65 | I/II | Chemotherapy | xeloda | CR |
| Page: 1 2 3 4 5 6 |
Top |
Related drugs of malignant transformation related genes |
| Identification of chemicals and drugs interact with genes involved in malignant transfromation |
| (DGIdb 4.0) |
| Entrez ID | Symbol | Category | Interaction Types | Drug Claim Name | Drug Name | PMIDs |
| 51701 | NLK | SERINE THREONINE KINASE, KINASE, DRUGGABLE GENOME, TRANSCRIPTION FACTOR, ENZYME | inhibitor | 249565802 |
| Page: 1 |

Copyright 2023-Present -The University of Texas Health Science Center at Houston |