
|
|||||
|
 | |
| |
| |
| |
| |
| |
|
Gene: NLGN4Y |
Gene summary for NLGN4Y |
| Gene information | Species | Human | Gene symbol | NLGN4Y | Gene ID | 22829 |
| Gene name | neuroligin 4 Y-linked | |
| Gene Alias | HNL4Y | |
| Cytomap | Yq11.221 | |
| Gene Type | protein-coding | GO ID | GO:0001941 | UniProtAcc | Q8NFZ3 |
Top |
Malignant transformation analysis |
| Identification of the aberrant gene expression in precancerous and cancerous lesions by comparing the gene expression of stem-like cells in diseased tissues with normal stem cells |
| Entrez ID | Symbol | Replicates | Species | Organ | Tissue | Adj P-value | Log2FC | Malignancy |
| 22829 | NLGN4Y | LZE4T | Human | Esophagus | ESCC | 1.61e-11 | 4.00e-01 | 0.0811 |
| 22829 | NLGN4Y | P5T-E | Human | Esophagus | ESCC | 4.09e-08 | 7.35e-02 | 0.1327 |
| 22829 | NLGN4Y | P10T-E | Human | Esophagus | ESCC | 2.45e-12 | 2.33e-01 | 0.116 |
| 22829 | NLGN4Y | P12T-E | Human | Esophagus | ESCC | 2.56e-21 | 3.94e-01 | 0.1122 |
| 22829 | NLGN4Y | P21T-E | Human | Esophagus | ESCC | 3.40e-03 | 2.96e-02 | 0.1617 |
| 22829 | NLGN4Y | P22T-E | Human | Esophagus | ESCC | 5.41e-41 | 6.67e-01 | 0.1236 |
| 22829 | NLGN4Y | P23T-E | Human | Esophagus | ESCC | 3.85e-03 | 1.38e-01 | 0.108 |
| 22829 | NLGN4Y | P26T-E | Human | Esophagus | ESCC | 8.45e-12 | 1.30e-01 | 0.1276 |
| 22829 | NLGN4Y | P27T-E | Human | Esophagus | ESCC | 4.17e-03 | 3.35e-02 | 0.1055 |
| 22829 | NLGN4Y | P28T-E | Human | Esophagus | ESCC | 1.12e-08 | 1.84e-01 | 0.1149 |
| 22829 | NLGN4Y | P47T-E | Human | Esophagus | ESCC | 2.96e-12 | 1.31e-01 | 0.1067 |
| 22829 | NLGN4Y | P52T-E | Human | Esophagus | ESCC | 1.33e-12 | 2.41e-01 | 0.1555 |
| 22829 | NLGN4Y | P56T-E | Human | Esophagus | ESCC | 2.40e-11 | 1.16e+00 | 0.1613 |
| 22829 | NLGN4Y | P57T-E | Human | Esophagus | ESCC | 7.29e-08 | 5.59e-02 | 0.0926 |
| 22829 | NLGN4Y | P79T-E | Human | Esophagus | ESCC | 1.75e-08 | 1.89e-01 | 0.1154 |
| 22829 | NLGN4Y | P127T-E | Human | Esophagus | ESCC | 1.58e-12 | 2.49e-01 | 0.0826 |
| 22829 | NLGN4Y | HTA12-25-1 | Human | Pancreas | PDAC | 3.52e-06 | 4.99e-01 | 0.313 |
| 22829 | NLGN4Y | HTA12-29-1 | Human | Pancreas | PDAC | 4.14e-35 | 7.71e-01 | 0.3722 |
| 22829 | NLGN4Y | HTA12-30-1 | Human | Pancreas | PDAC | 1.14e-02 | 7.78e-01 | 0.3671 |
| 22829 | NLGN4Y | 048752_1579-all-cells | Human | Prostate | BPH | 2.56e-24 | 6.23e-01 | 0.1008 |
| Page: 1 2 |
| Tissue | Expression Dynamics | Abbreviation |
| Esophagus |  | ESCC: Esophageal squamous cell carcinoma |
| HGIN: High-grade intraepithelial neoplasias | ||
| LGIN: Low-grade intraepithelial neoplasias | ||
| Prostate | 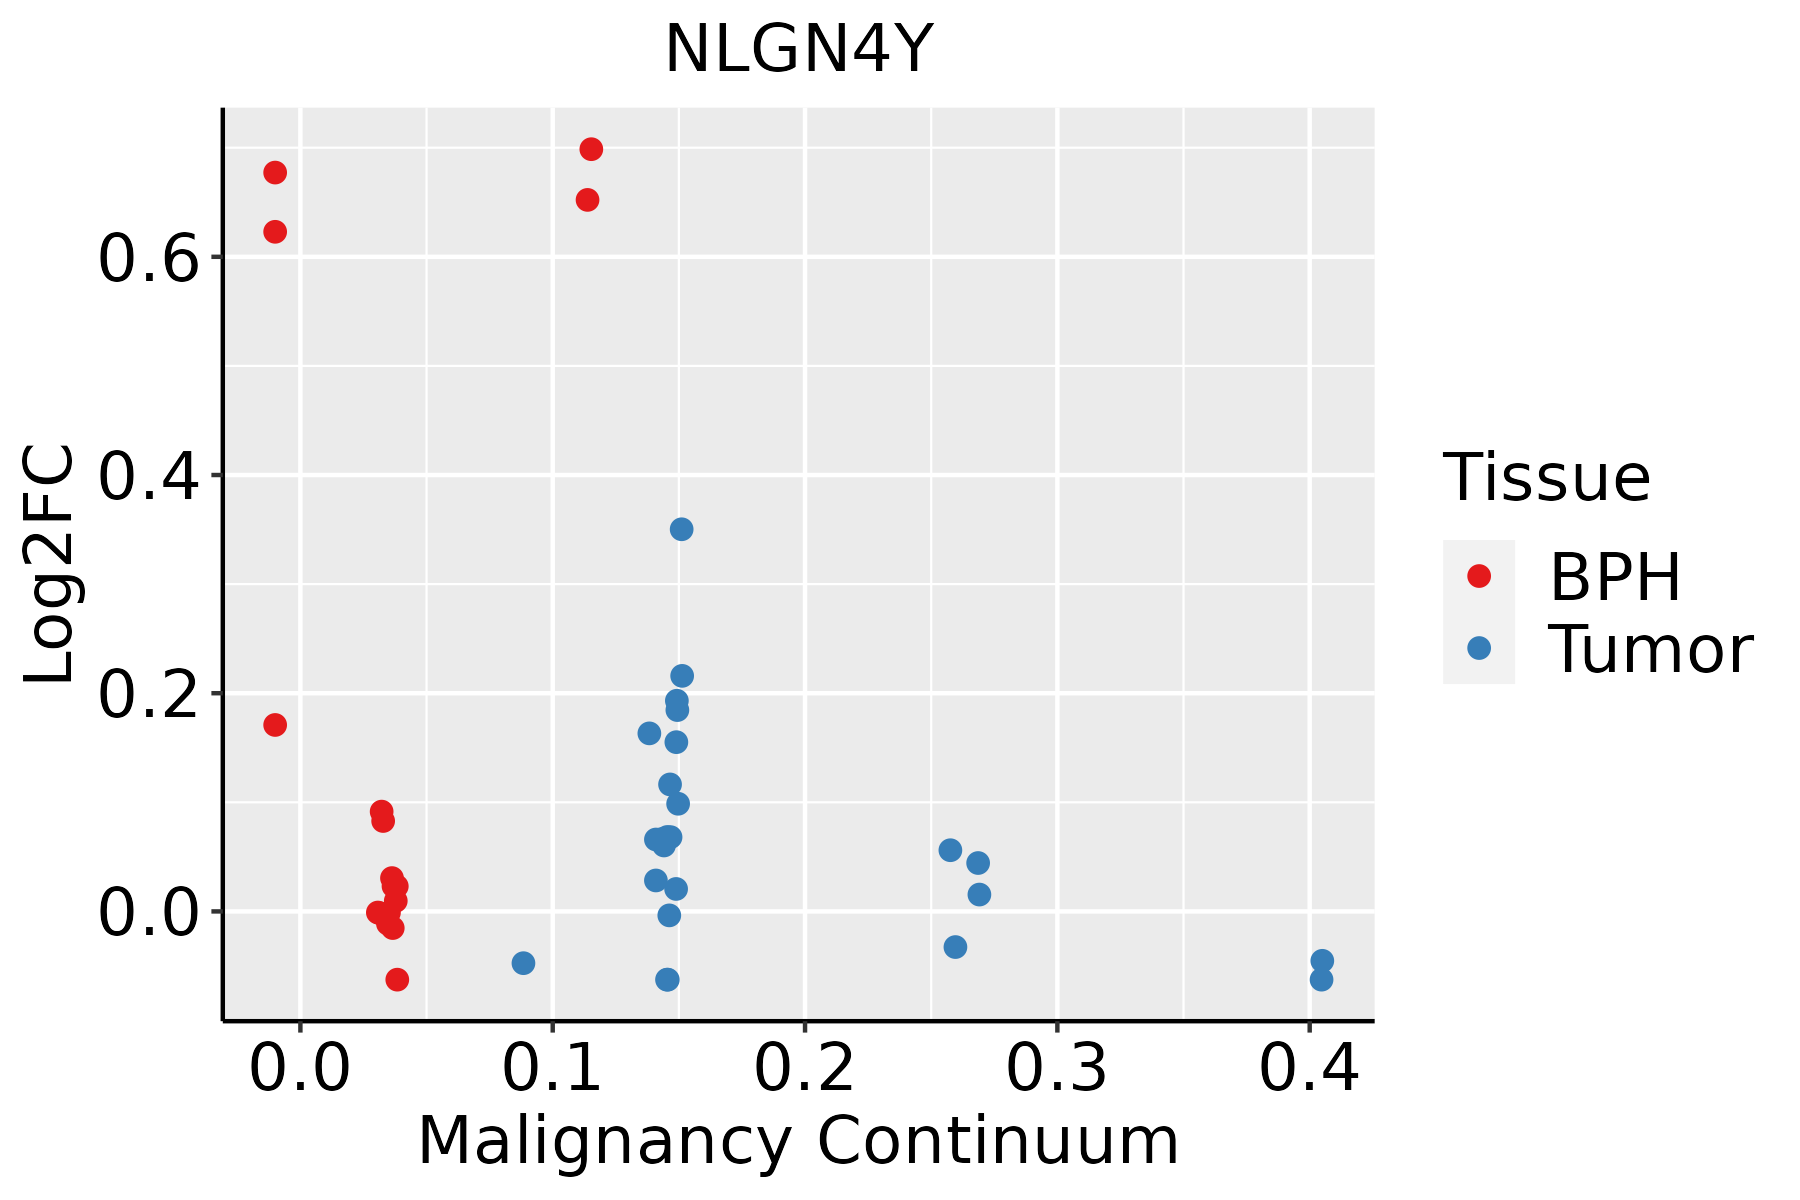 | BPH: Benign Prostatic Hyperplasia |
| ∗log2FC in expression of this searched gene in stem-like cells from each diseased tissue sample relative to stem-like cells in normal samples in each tissue plotted against the malignancy continuum. Samples are colored based on if they are from different disease stage. |
Top |
Malignant transformation related pathway analysis |
| Find out the enriched GO biological processes and KEGG pathways involved in transition from healthy to precancer to cancer |
| Tissue | Disease Stage | Enriched GO biological Processes |
| Colorectum | AD |  |
| Colorectum | SER |  |
| Colorectum | MSS |  |
| Colorectum | MSI-H |  |
| Colorectum | FAP |  |
| ∗Top 15 enriched GO BP terms are showed in the bar plot of each disease state in each tissue. Each row represents a significant GO biological process which is colored according to the -log10(p.adjust). |
| Page: 1 2 3 4 5 6 7 8 9 |
| GO ID | Tissue | Disease Stage | Description | Gene Ratio | Bg Ratio | pvalue | p.adjust | Count |
| GO:003432918 | Esophagus | ESCC | cell junction assembly | 227/8552 | 420/18723 | 3.06e-04 | 1.83e-03 | 227 |
| GO:00440918 | Esophagus | ESCC | membrane biogenesis | 38/8552 | 55/18723 | 3.78e-04 | 2.19e-03 | 38 |
| GO:00717099 | Esophagus | ESCC | membrane assembly | 35/8552 | 50/18723 | 4.33e-04 | 2.44e-03 | 35 |
| GO:003432910 | Prostate | BPH | cell junction assembly | 114/3107 | 420/18723 | 2.52e-08 | 7.49e-07 | 114 |
| GO:00508087 | Prostate | BPH | synapse organization | 103/3107 | 426/18723 | 3.19e-05 | 3.61e-04 | 103 |
| GO:00991736 | Prostate | BPH | postsynapse organization | 49/3107 | 168/18723 | 3.20e-05 | 3.61e-04 | 49 |
| GO:00717097 | Prostate | BPH | membrane assembly | 20/3107 | 50/18723 | 6.88e-05 | 6.78e-04 | 20 |
| GO:00440916 | Prostate | BPH | membrane biogenesis | 21/3107 | 55/18723 | 1.02e-04 | 9.39e-04 | 21 |
| GO:0050890 | Prostate | BPH | cognition | 69/3107 | 296/18723 | 1.68e-03 | 9.69e-03 | 69 |
| GO:0007611 | Prostate | BPH | learning or memory | 59/3107 | 255/18723 | 4.12e-03 | 2.04e-02 | 59 |
| Page: 1 |
| Pathway ID | Tissue | Disease Stage | Description | Gene Ratio | Bg Ratio | pvalue | p.adjust | qvalue | Count |
| Page: 1 |
Top |
Cell-cell communication analysis |
| Identification of potential cell-cell interactions between two cell types and their ligand-receptor pairs for different disease states |
| Ligand | Receptor | LRpair | Pathway | Tissue | Disease Stage |
| Page: 1 |
Top |
Single-cell gene regulatory network inference analysis |
| Find out the significant the regulons (TFs) and the target genes of each regulon across cell types for different disease states |
| TF | Cell Type | Tissue | Disease Stage | Target Gene | RSS | Regulon Activity |
| ∗The dot plots of a searched regulon are shown for all cell subpopulations in each disease state of each tissue based on the regulon specific score inferred using pySCENIC and by calculating the average expression. |
| Page: 1 |
Top |
Somatic mutation of malignant transformation related genes |
| Annotation of somatic variants for genes involved in malignant transformation |
| Hugo Symbol | Variant Class | Variant Classification | dbSNP RS | HGVSc | HGVSp | HGVSp Short | SWISSPROT | BIOTYPE | SIFT | PolyPhen | Tumor Sample Barcode | Tissue | Histology | Sex | Age | Stage | Therapy Types | Drugs | Outcome |
| NLGN4Y | SNV | Missense_Mutation | novel | c.1949N>T | p.Ser650Phe | p.S650F | Q8NFZ3 | protein_coding | deleterious(0.03) | benign(0.125) | TCGA-D8-A1JC-01 | Breast | breast invasive carcinoma | Female | <65 | III/IV | Chemotherapy | adriamycin | SD |
| NLGN4Y | SNV | Missense_Mutation | c.1285G>A | p.Asp429Asn | p.D429N | Q8NFZ3 | protein_coding | tolerated(0.11) | benign(0.346) | TCGA-A6-6138-01 | Colorectum | colon adenocarcinoma | Male | <65 | I/II | Unknown | Unknown | SD | |
| NLGN4Y | SNV | Missense_Mutation | novel | c.1222G>A | p.Gly408Ser | p.G408S | Q8NFZ3 | protein_coding | deleterious(0.02) | benign(0.233) | TCGA-A6-6780-01 | Colorectum | colon adenocarcinoma | Male | >=65 | I/II | Unknown | Unknown | SD |
| NLGN4Y | SNV | Missense_Mutation | c.2288N>T | p.Thr763Met | p.T763M | Q8NFZ3 | protein_coding | deleterious_low_confidence(0) | possibly_damaging(0.84) | TCGA-AA-3506-01 | Colorectum | colon adenocarcinoma | Male | >=65 | I/II | Unknown | Unknown | SD | |
| NLGN4Y | SNV | Missense_Mutation | c.355N>G | p.Leu119Val | p.L119V | Q8NFZ3 | protein_coding | tolerated(0.59) | benign(0.074) | TCGA-AA-3663-01 | Colorectum | colon adenocarcinoma | Male | <65 | I/II | Unknown | Unknown | SD | |
| NLGN4Y | SNV | Missense_Mutation | c.1913N>A | p.Arg638His | p.R638H | Q8NFZ3 | protein_coding | tolerated(0.15) | possibly_damaging(0.836) | TCGA-AA-3663-01 | Colorectum | colon adenocarcinoma | Male | <65 | I/II | Unknown | Unknown | SD | |
| NLGN4Y | SNV | Missense_Mutation | c.1111N>A | p.Val371Ile | p.V371I | Q8NFZ3 | protein_coding | tolerated(0.1) | benign(0.366) | TCGA-AA-3842-01 | Colorectum | colon adenocarcinoma | Male | <65 | III/IV | Chemotherapy | folinic | PD | |
| NLGN4Y | SNV | Missense_Mutation | c.611G>A | p.Arg204His | p.R204H | Q8NFZ3 | protein_coding | deleterious(0) | probably_damaging(0.999) | TCGA-AD-5900-01 | Colorectum | colon adenocarcinoma | Male | >=65 | I/II | Unknown | Unknown | SD | |
| NLGN4Y | SNV | Missense_Mutation | novel | c.147N>G | p.Asn49Lys | p.N49K | Q8NFZ3 | protein_coding | tolerated(0.16) | benign(0.343) | TCGA-CA-6717-01 | Colorectum | colon adenocarcinoma | Male | <65 | I/II | Chemotherapy | oxaliplatin | CR |
| NLGN4Y | SNV | Missense_Mutation | c.1435N>A | p.Glu479Lys | p.E479K | Q8NFZ3 | protein_coding | tolerated(0.27) | benign(0.296) | TCGA-CA-6718-01 | Colorectum | colon adenocarcinoma | Male | <65 | I/II | Unknown | Unknown | PD |
| Page: 1 2 3 4 5 |
Top |
Related drugs of malignant transformation related genes |
| Identification of chemicals and drugs interact with genes involved in malignant transfromation |
| (DGIdb 4.0) |
| Entrez ID | Symbol | Category | Interaction Types | Drug Claim Name | Drug Name | PMIDs |
| Page: 1 |

Copyright 2023-Present -The University of Texas Health Science Center at Houston |