
|
|||||
|
 | |
| |
| |
| |
| |
| |
|
Gene: NLE1 |
Gene summary for NLE1 |
| Gene information | Species | Human | Gene symbol | NLE1 | Gene ID | 54475 |
| Gene name | notchless homolog 1 | |
| Gene Alias | NLE | |
| Cytomap | 17q12 | |
| Gene Type | protein-coding | GO ID | GO:0000027 | UniProtAcc | Q9NVX2 |
Top |
Malignant transformation analysis |
| Identification of the aberrant gene expression in precancerous and cancerous lesions by comparing the gene expression of stem-like cells in diseased tissues with normal stem cells |
| Entrez ID | Symbol | Replicates | Species | Organ | Tissue | Adj P-value | Log2FC | Malignancy |
| 54475 | NLE1 | LZE4T | Human | Esophagus | ESCC | 4.95e-06 | 8.81e-02 | 0.0811 |
| 54475 | NLE1 | LZE7T | Human | Esophagus | ESCC | 1.99e-02 | 1.23e-01 | 0.0667 |
| 54475 | NLE1 | LZE24T | Human | Esophagus | ESCC | 2.91e-08 | 1.31e-01 | 0.0596 |
| 54475 | NLE1 | P1T-E | Human | Esophagus | ESCC | 1.55e-02 | 9.19e-02 | 0.0875 |
| 54475 | NLE1 | P2T-E | Human | Esophagus | ESCC | 2.20e-07 | 2.26e-01 | 0.1177 |
| 54475 | NLE1 | P4T-E | Human | Esophagus | ESCC | 7.47e-09 | 2.62e-01 | 0.1323 |
| 54475 | NLE1 | P5T-E | Human | Esophagus | ESCC | 1.35e-18 | 3.79e-01 | 0.1327 |
| 54475 | NLE1 | P8T-E | Human | Esophagus | ESCC | 2.30e-02 | 4.11e-02 | 0.0889 |
| 54475 | NLE1 | P9T-E | Human | Esophagus | ESCC | 1.43e-21 | 1.68e-01 | 0.1131 |
| 54475 | NLE1 | P10T-E | Human | Esophagus | ESCC | 5.04e-03 | 2.92e-02 | 0.116 |
| 54475 | NLE1 | P11T-E | Human | Esophagus | ESCC | 2.65e-03 | 1.39e-01 | 0.1426 |
| 54475 | NLE1 | P12T-E | Human | Esophagus | ESCC | 9.39e-18 | 3.54e-01 | 0.1122 |
| 54475 | NLE1 | P15T-E | Human | Esophagus | ESCC | 2.04e-16 | 3.52e-01 | 0.1149 |
| 54475 | NLE1 | P16T-E | Human | Esophagus | ESCC | 4.11e-16 | 2.97e-01 | 0.1153 |
| 54475 | NLE1 | P19T-E | Human | Esophagus | ESCC | 3.59e-07 | 4.09e-01 | 0.1662 |
| 54475 | NLE1 | P20T-E | Human | Esophagus | ESCC | 3.50e-13 | 2.93e-01 | 0.1124 |
| 54475 | NLE1 | P21T-E | Human | Esophagus | ESCC | 1.26e-13 | 3.64e-01 | 0.1617 |
| 54475 | NLE1 | P22T-E | Human | Esophagus | ESCC | 4.84e-17 | 2.82e-01 | 0.1236 |
| 54475 | NLE1 | P23T-E | Human | Esophagus | ESCC | 1.10e-06 | 1.17e-01 | 0.108 |
| 54475 | NLE1 | P24T-E | Human | Esophagus | ESCC | 3.32e-12 | 4.09e-01 | 0.1287 |
| Page: 1 2 3 4 |
| Tissue | Expression Dynamics | Abbreviation |
| Esophagus | 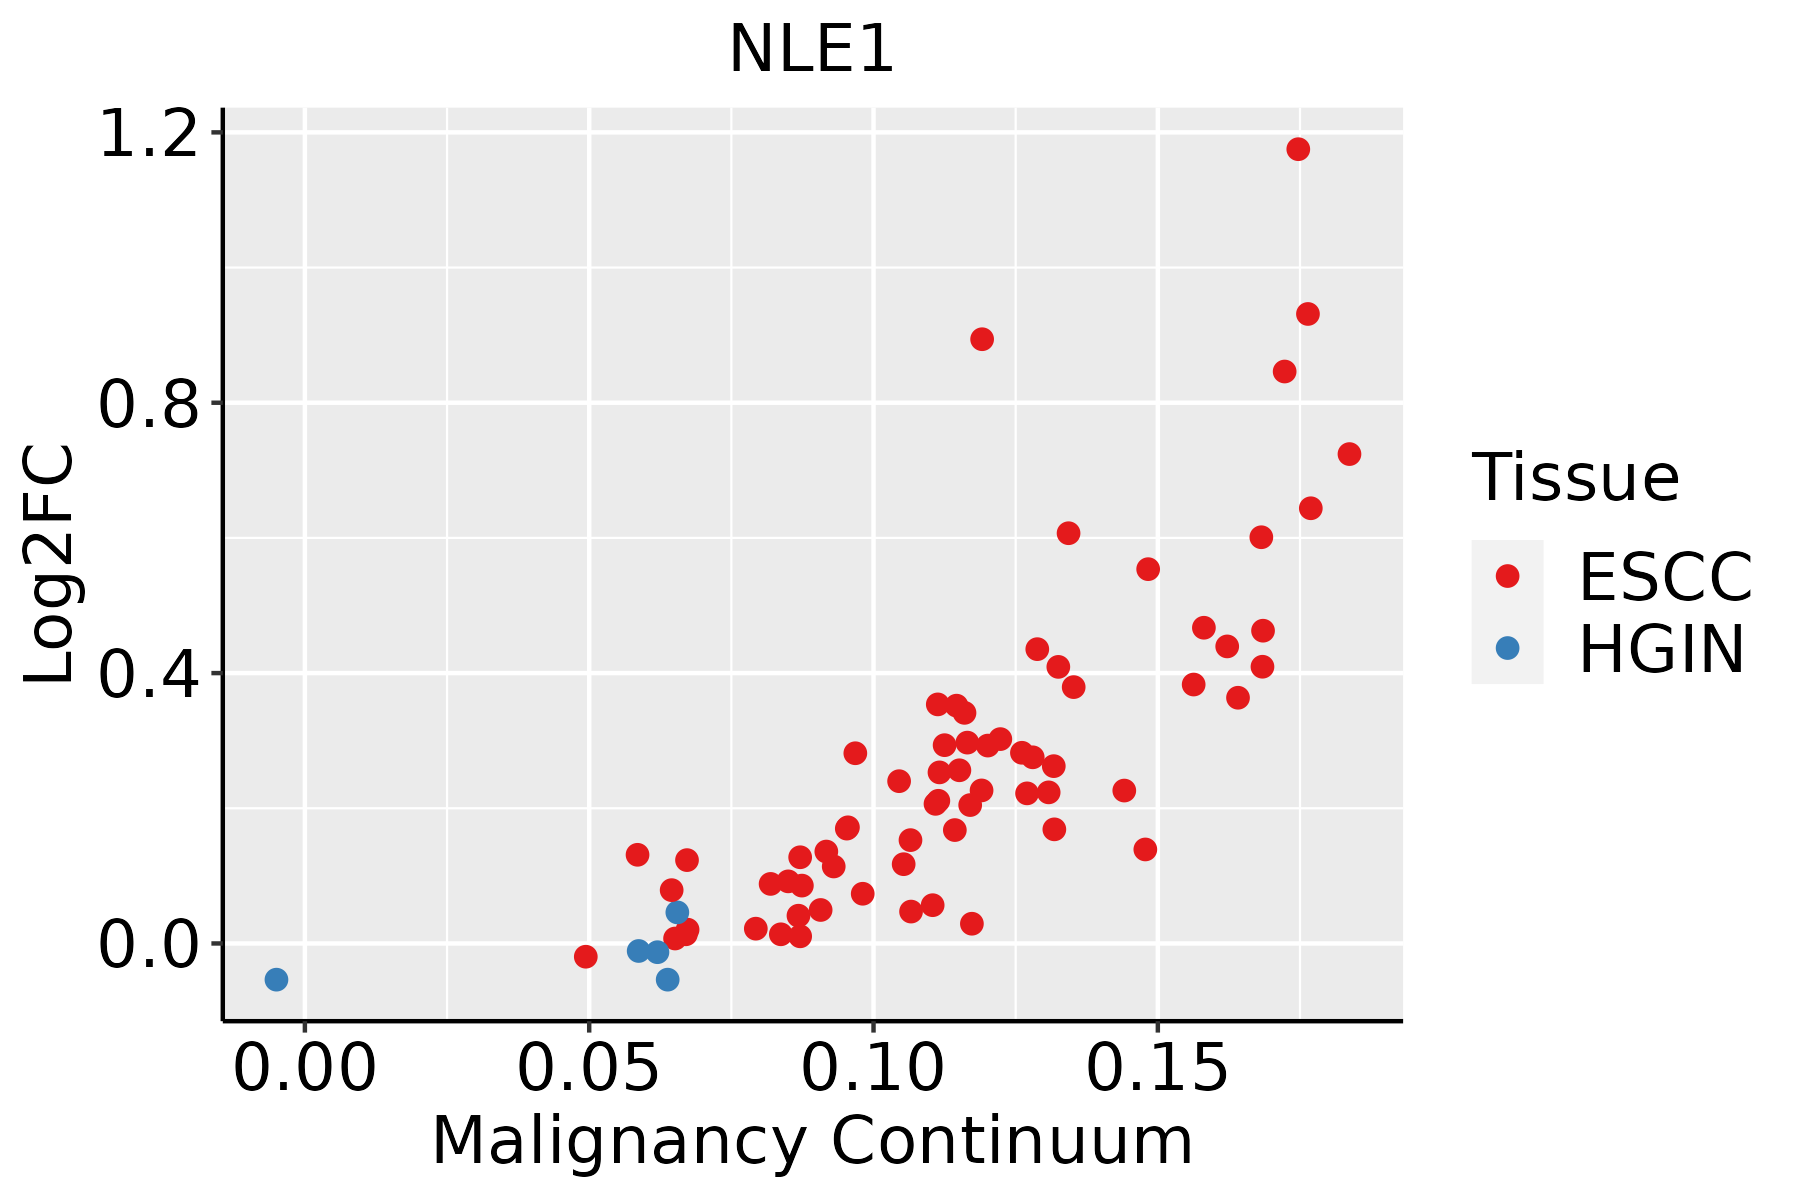 | ESCC: Esophageal squamous cell carcinoma |
| HGIN: High-grade intraepithelial neoplasias | ||
| LGIN: Low-grade intraepithelial neoplasias | ||
| Liver |  | HCC: Hepatocellular carcinoma |
| NAFLD: Non-alcoholic fatty liver disease | ||
| Oral Cavity | 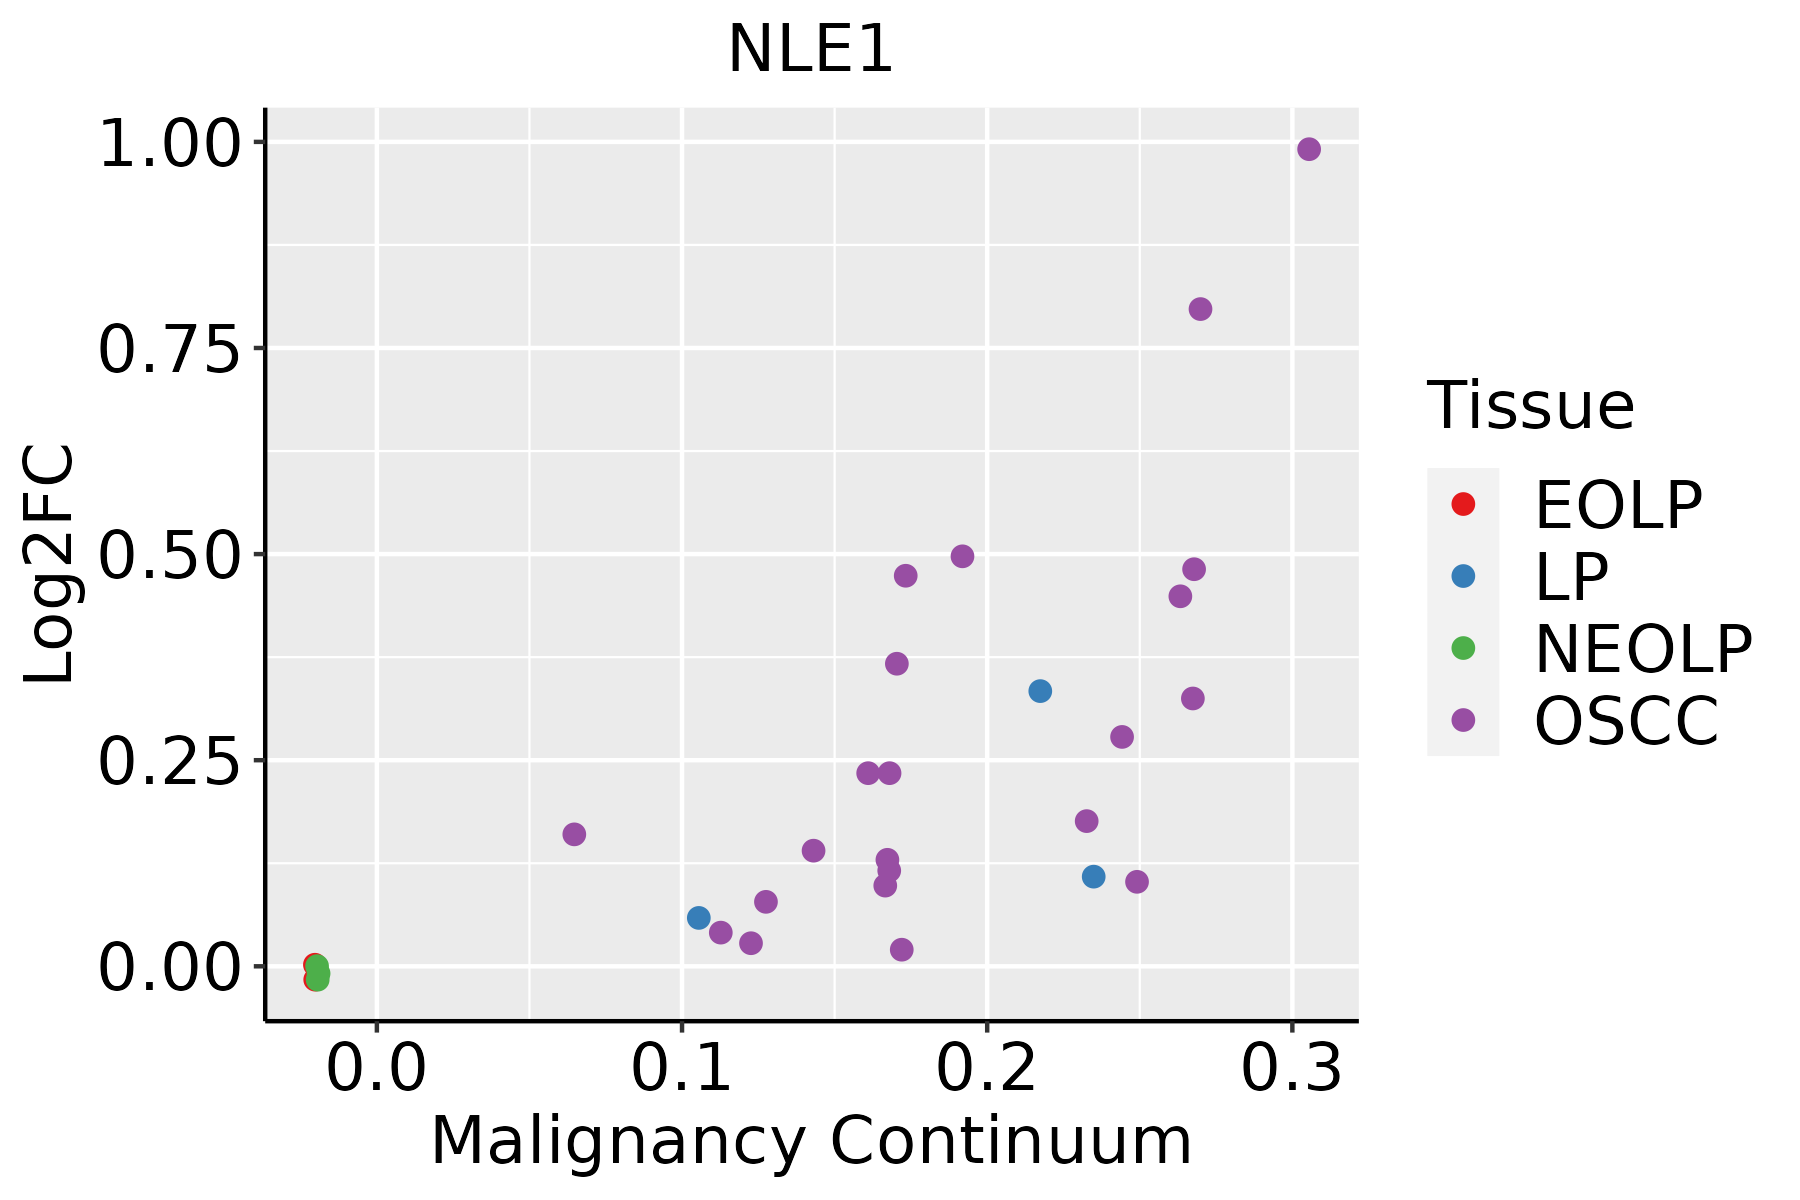 | EOLP: Erosive Oral lichen planus |
| LP: leukoplakia | ||
| NEOLP: Non-erosive oral lichen planus | ||
| OSCC: Oral squamous cell carcinoma |
| ∗log2FC in expression of this searched gene in stem-like cells from each diseased tissue sample relative to stem-like cells in normal samples in each tissue plotted against the malignancy continuum. Samples are colored based on if they are from different disease stage. |
Top |
Malignant transformation related pathway analysis |
| Find out the enriched GO biological processes and KEGG pathways involved in transition from healthy to precancer to cancer |
| Tissue | Disease Stage | Enriched GO biological Processes |
| Colorectum | AD |  |
| Colorectum | SER |  |
| Colorectum | MSS |  |
| Colorectum | MSI-H |  |
| Colorectum | FAP |  |
| ∗Top 15 enriched GO BP terms are showed in the bar plot of each disease state in each tissue. Each row represents a significant GO biological process which is colored according to the -log10(p.adjust). |
| Page: 1 2 3 4 5 6 7 8 9 |
| GO ID | Tissue | Disease Stage | Description | Gene Ratio | Bg Ratio | pvalue | p.adjust | Count |
| GO:0022613111 | Esophagus | ESCC | ribonucleoprotein complex biogenesis | 365/8552 | 463/18723 | 1.74e-49 | 1.11e-45 | 365 |
| GO:0042254111 | Esophagus | ESCC | ribosome biogenesis | 252/8552 | 299/18723 | 3.27e-44 | 1.04e-40 | 252 |
| GO:2001233111 | Esophagus | ESCC | regulation of apoptotic signaling pathway | 256/8552 | 356/18723 | 4.11e-24 | 1.04e-21 | 256 |
| GO:0071826111 | Esophagus | ESCC | ribonucleoprotein complex subunit organization | 166/8552 | 227/18723 | 2.94e-17 | 2.42e-15 | 166 |
| GO:000734615 | Esophagus | ESCC | regulation of mitotic cell cycle | 293/8552 | 457/18723 | 8.00e-16 | 5.64e-14 | 293 |
| GO:0022618111 | Esophagus | ESCC | ribonucleoprotein complex assembly | 159/8552 | 220/18723 | 8.19e-16 | 5.71e-14 | 159 |
| GO:000170119 | Esophagus | ESCC | in utero embryonic development | 243/8552 | 367/18723 | 1.00e-15 | 6.86e-14 | 243 |
| GO:2001234111 | Esophagus | ESCC | negative regulation of apoptotic signaling pathway | 161/8552 | 224/18723 | 1.24e-15 | 8.09e-14 | 161 |
| GO:0042273111 | Esophagus | ESCC | ribosomal large subunit biogenesis | 65/8552 | 72/18723 | 1.53e-15 | 9.82e-14 | 65 |
| GO:2000116111 | Esophagus | ESCC | regulation of cysteine-type endopeptidase activity | 158/8552 | 235/18723 | 1.67e-11 | 5.90e-10 | 158 |
| GO:0043281111 | Esophagus | ESCC | regulation of cysteine-type endopeptidase activity involved in apoptotic process | 143/8552 | 209/18723 | 2.12e-11 | 7.31e-10 | 143 |
| GO:001605517 | Esophagus | ESCC | Wnt signaling pathway | 268/8552 | 444/18723 | 2.32e-10 | 6.58e-09 | 268 |
| GO:019873817 | Esophagus | ESCC | cell-cell signaling by wnt | 269/8552 | 446/18723 | 2.41e-10 | 6.79e-09 | 269 |
| GO:00457865 | Esophagus | ESCC | negative regulation of cell cycle | 236/8552 | 385/18723 | 3.62e-10 | 9.93e-09 | 236 |
| GO:0052547111 | Esophagus | ESCC | regulation of peptidase activity | 275/8552 | 461/18723 | 7.54e-10 | 1.88e-08 | 275 |
| GO:0042255111 | Esophagus | ESCC | ribosome assembly | 50/8552 | 61/18723 | 5.66e-09 | 1.17e-07 | 50 |
| GO:0052548111 | Esophagus | ESCC | regulation of endopeptidase activity | 253/8552 | 432/18723 | 3.68e-08 | 6.78e-07 | 253 |
| GO:2000117110 | Esophagus | ESCC | negative regulation of cysteine-type endopeptidase activity | 63/8552 | 86/18723 | 1.84e-07 | 2.88e-06 | 63 |
| GO:0043154110 | Esophagus | ESCC | negative regulation of cysteine-type endopeptidase activity involved in apoptotic process | 58/8552 | 78/18723 | 2.38e-07 | 3.61e-06 | 58 |
| GO:003011117 | Esophagus | ESCC | regulation of Wnt signaling pathway | 194/8552 | 328/18723 | 5.39e-07 | 7.14e-06 | 194 |
| Page: 1 2 3 4 5 6 |
| Pathway ID | Tissue | Disease Stage | Description | Gene Ratio | Bg Ratio | pvalue | p.adjust | qvalue | Count |
| Page: 1 |
Top |
Cell-cell communication analysis |
| Identification of potential cell-cell interactions between two cell types and their ligand-receptor pairs for different disease states |
| Ligand | Receptor | LRpair | Pathway | Tissue | Disease Stage |
| Page: 1 |
Top |
Single-cell gene regulatory network inference analysis |
| Find out the significant the regulons (TFs) and the target genes of each regulon across cell types for different disease states |
| TF | Cell Type | Tissue | Disease Stage | Target Gene | RSS | Regulon Activity |
| ∗The dot plots of a searched regulon are shown for all cell subpopulations in each disease state of each tissue based on the regulon specific score inferred using pySCENIC and by calculating the average expression. |
| Page: 1 |
Top |
Somatic mutation of malignant transformation related genes |
| Annotation of somatic variants for genes involved in malignant transformation |
| Hugo Symbol | Variant Class | Variant Classification | dbSNP RS | HGVSc | HGVSp | HGVSp Short | SWISSPROT | BIOTYPE | SIFT | PolyPhen | Tumor Sample Barcode | Tissue | Histology | Sex | Age | Stage | Therapy Types | Drugs | Outcome |
| NLE1 | SNV | Missense_Mutation | c.919N>C | p.Glu307Gln | p.E307Q | Q9NVX2 | protein_coding | tolerated(0.05) | possibly_damaging(0.583) | TCGA-A8-A08L-01 | Breast | breast invasive carcinoma | Female | >=65 | III/IV | Unknown | Unknown | SD | |
| NLE1 | insertion | Frame_Shift_Ins | novel | c.784_785insGGGATGGGGA | p.Ser262TrpfsTer18 | p.S262Wfs*18 | Q9NVX2 | protein_coding | TCGA-BH-A0B1-01 | Breast | breast invasive carcinoma | Female | >=65 | I/II | Chemotherapy | adriamycin | SD | ||
| NLE1 | insertion | Nonsense_Mutation | novel | c.782_783insTTGTAATGACTGGTAATGATTAAAAATGGT | p.Tyr261_Ser262insCysAsnAspTrpTerTerLeuLysMetVal | p.Y261_S262insCNDW**LKMV | Q9NVX2 | protein_coding | TCGA-BH-A0B1-01 | Breast | breast invasive carcinoma | Female | >=65 | I/II | Chemotherapy | adriamycin | SD | ||
| NLE1 | SNV | Missense_Mutation | rs372790802 | c.718N>T | p.Arg240Cys | p.R240C | Q9NVX2 | protein_coding | tolerated(0.15) | possibly_damaging(0.761) | TCGA-A6-6653-01 | Colorectum | colon adenocarcinoma | Male | >=65 | I/II | Unknown | Unknown | SD |
| NLE1 | SNV | Missense_Mutation | c.905N>A | p.Arg302His | p.R302H | Q9NVX2 | protein_coding | deleterious(0) | probably_damaging(0.999) | TCGA-AA-3672-01 | Colorectum | colon adenocarcinoma | Female | >=65 | III/IV | Unknown | Unknown | SD | |
| NLE1 | SNV | Missense_Mutation | c.356N>A | p.Ser119Tyr | p.S119Y | Q9NVX2 | protein_coding | deleterious(0.02) | probably_damaging(0.999) | TCGA-AA-3977-01 | Colorectum | colon adenocarcinoma | Male | >=65 | I/II | Unknown | Unknown | SD | |
| NLE1 | SNV | Missense_Mutation | novel | c.1264N>G | p.Trp422Gly | p.W422G | Q9NVX2 | protein_coding | deleterious(0) | probably_damaging(0.998) | TCGA-AD-6895-01 | Colorectum | colon adenocarcinoma | Male | >=65 | III/IV | Unknown | Unknown | SD |
| NLE1 | SNV | Missense_Mutation | rs200560049 | c.1154G>A | p.Arg385His | p.R385H | Q9NVX2 | protein_coding | deleterious(0.01) | probably_damaging(0.999) | TCGA-AM-5821-01 | Colorectum | colon adenocarcinoma | Female | >=65 | I/II | Unknown | Unknown | SD |
| NLE1 | SNV | Missense_Mutation | c.771C>G | p.Asp257Glu | p.D257E | Q9NVX2 | protein_coding | tolerated(1) | benign(0.073) | TCGA-G4-6588-01 | Colorectum | colon adenocarcinoma | Female | <65 | I/II | Unknown | Unknown | SD | |
| NLE1 | SNV | Missense_Mutation | rs750583113 | c.1366N>A | p.Ala456Thr | p.A456T | Q9NVX2 | protein_coding | deleterious(0.05) | probably_damaging(0.999) | TCGA-AG-A02N-01 | Colorectum | rectum adenocarcinoma | Male | >=65 | I/II | Chemotherapy | folinic | CR |
| Page: 1 2 3 4 5 |
Top |
Related drugs of malignant transformation related genes |
| Identification of chemicals and drugs interact with genes involved in malignant transfromation |
| (DGIdb 4.0) |
| Entrez ID | Symbol | Category | Interaction Types | Drug Claim Name | Drug Name | PMIDs |
| Page: 1 |

Copyright 2023-Present -The University of Texas Health Science Center at Houston |