
|
|||||
|
 | |
| |
| |
| |
| |
| |
|
Gene: NKX2-8 |
Gene summary for NKX2-8 |
| Gene information | Species | Human | Gene symbol | NKX2-8 | Gene ID | 26257 |
| Gene name | NK2 homeobox 8 | |
| Gene Alias | NKX2.8 | |
| Cytomap | 14q13.3 | |
| Gene Type | protein-coding | GO ID | GO:0000902 | UniProtAcc | O15522 |
Top |
Malignant transformation analysis |
| Identification of the aberrant gene expression in precancerous and cancerous lesions by comparing the gene expression of stem-like cells in diseased tissues with normal stem cells |
| Entrez ID | Symbol | Replicates | Species | Organ | Tissue | Adj P-value | Log2FC | Malignancy |
| 26257 | NKX2-8 | P1T-E | Human | Esophagus | ESCC | 3.09e-04 | 3.87e-01 | 0.0875 |
| 26257 | NKX2-8 | P5T-E | Human | Esophagus | ESCC | 2.23e-05 | 1.25e-01 | 0.1327 |
| 26257 | NKX2-8 | P8T-E | Human | Esophagus | ESCC | 1.33e-15 | 2.88e-01 | 0.0889 |
| 26257 | NKX2-8 | P9T-E | Human | Esophagus | ESCC | 2.37e-03 | 9.66e-02 | 0.1131 |
| 26257 | NKX2-8 | P10T-E | Human | Esophagus | ESCC | 1.73e-08 | 1.01e-01 | 0.116 |
| 26257 | NKX2-8 | P15T-E | Human | Esophagus | ESCC | 4.97e-08 | 2.46e-01 | 0.1149 |
| 26257 | NKX2-8 | P22T-E | Human | Esophagus | ESCC | 5.70e-09 | 1.90e-01 | 0.1236 |
| 26257 | NKX2-8 | P26T-E | Human | Esophagus | ESCC | 1.46e-04 | 1.06e-01 | 0.1276 |
| 26257 | NKX2-8 | P28T-E | Human | Esophagus | ESCC | 1.02e-05 | 1.60e-01 | 0.1149 |
| 26257 | NKX2-8 | P30T-E | Human | Esophagus | ESCC | 4.41e-02 | 1.50e-01 | 0.137 |
| 26257 | NKX2-8 | P32T-E | Human | Esophagus | ESCC | 1.44e-02 | 3.91e-02 | 0.1666 |
| 26257 | NKX2-8 | P37T-E | Human | Esophagus | ESCC | 1.30e-06 | 2.02e-01 | 0.1371 |
| 26257 | NKX2-8 | P39T-E | Human | Esophagus | ESCC | 3.28e-11 | 4.19e-01 | 0.0894 |
| 26257 | NKX2-8 | P47T-E | Human | Esophagus | ESCC | 2.40e-02 | 1.25e-01 | 0.1067 |
| 26257 | NKX2-8 | P48T-E | Human | Esophagus | ESCC | 9.77e-09 | 1.02e-01 | 0.0959 |
| 26257 | NKX2-8 | P49T-E | Human | Esophagus | ESCC | 3.91e-06 | 6.12e-01 | 0.1768 |
| 26257 | NKX2-8 | P52T-E | Human | Esophagus | ESCC | 3.42e-09 | 3.26e-01 | 0.1555 |
| 26257 | NKX2-8 | P54T-E | Human | Esophagus | ESCC | 1.93e-25 | 7.20e-01 | 0.0975 |
| 26257 | NKX2-8 | P57T-E | Human | Esophagus | ESCC | 1.05e-03 | 4.14e-02 | 0.0926 |
| 26257 | NKX2-8 | P61T-E | Human | Esophagus | ESCC | 2.17e-35 | 8.49e-01 | 0.099 |
| Page: 1 2 |
| Tissue | Expression Dynamics | Abbreviation |
| Esophagus | 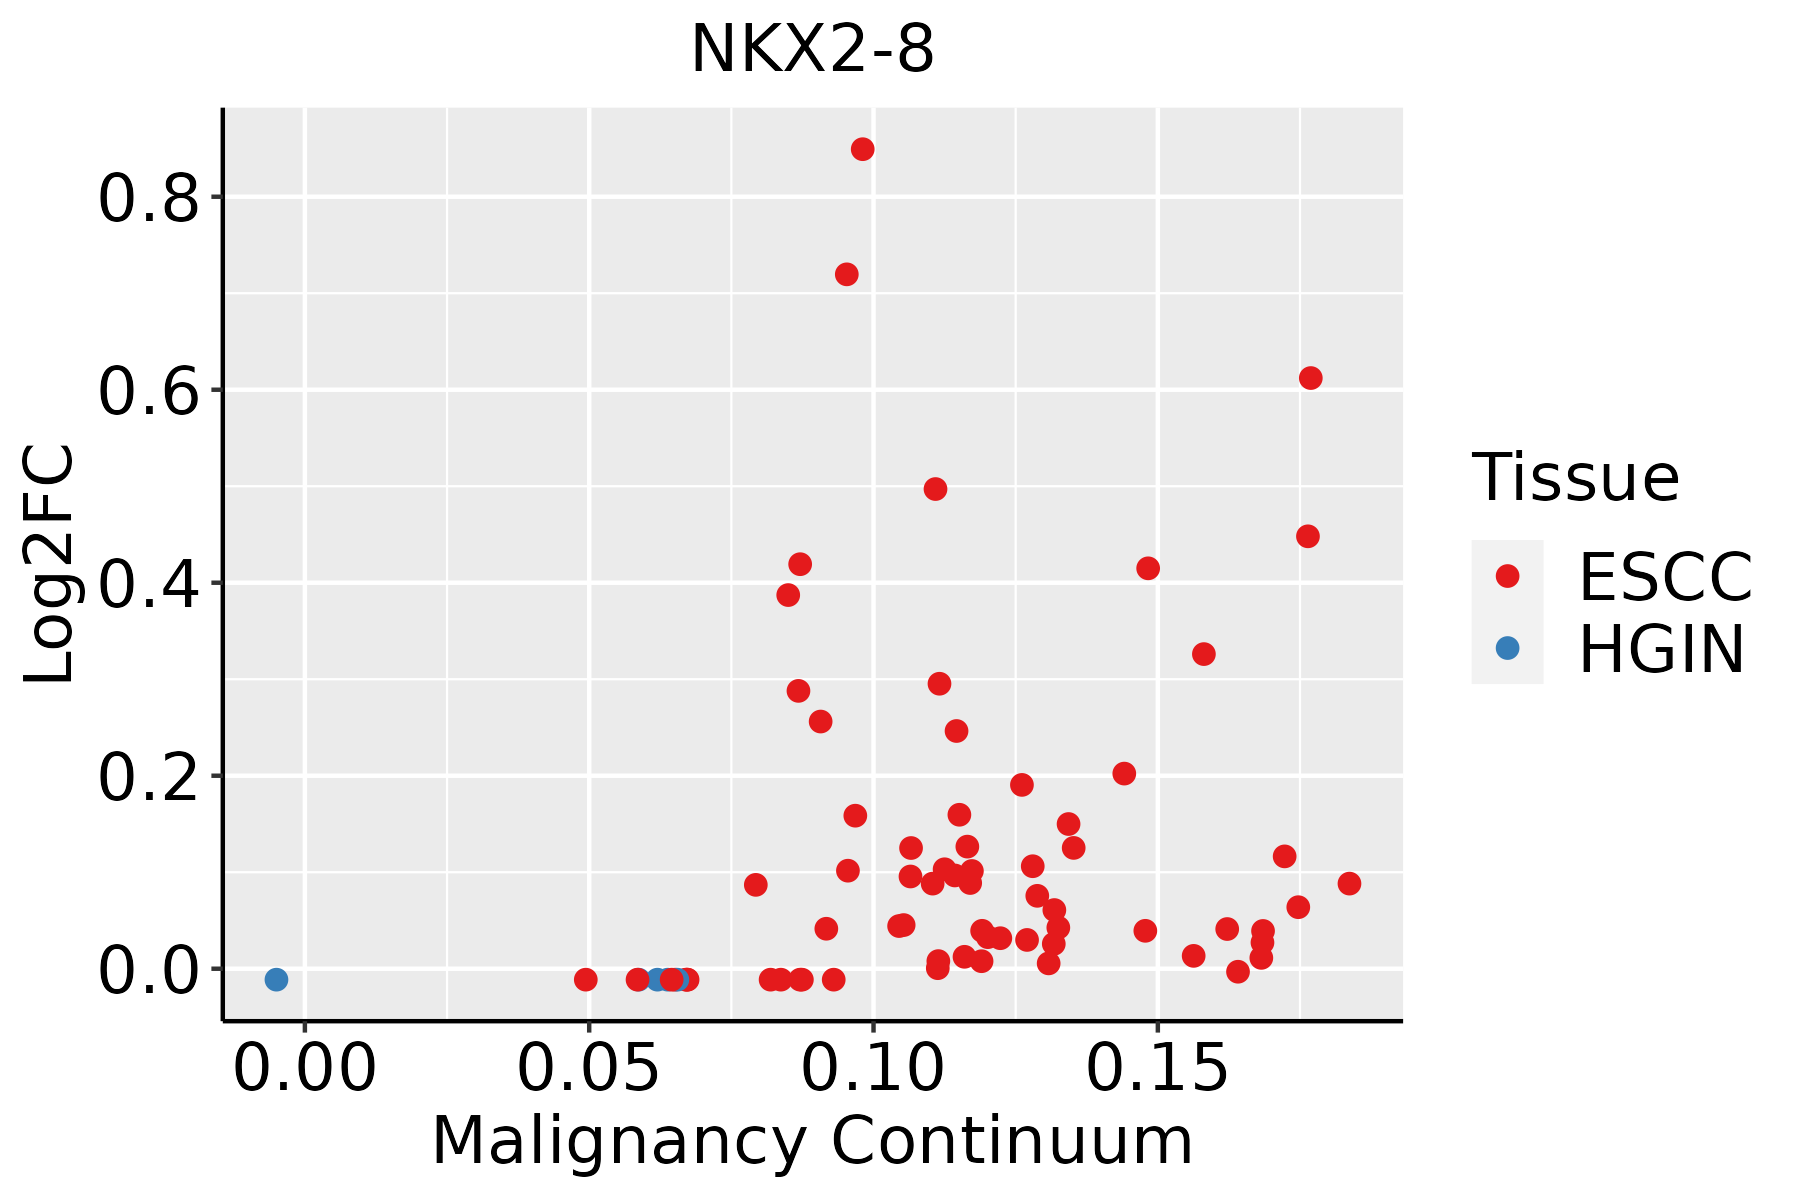 | ESCC: Esophageal squamous cell carcinoma |
| HGIN: High-grade intraepithelial neoplasias | ||
| LGIN: Low-grade intraepithelial neoplasias | ||
| Oral Cavity | 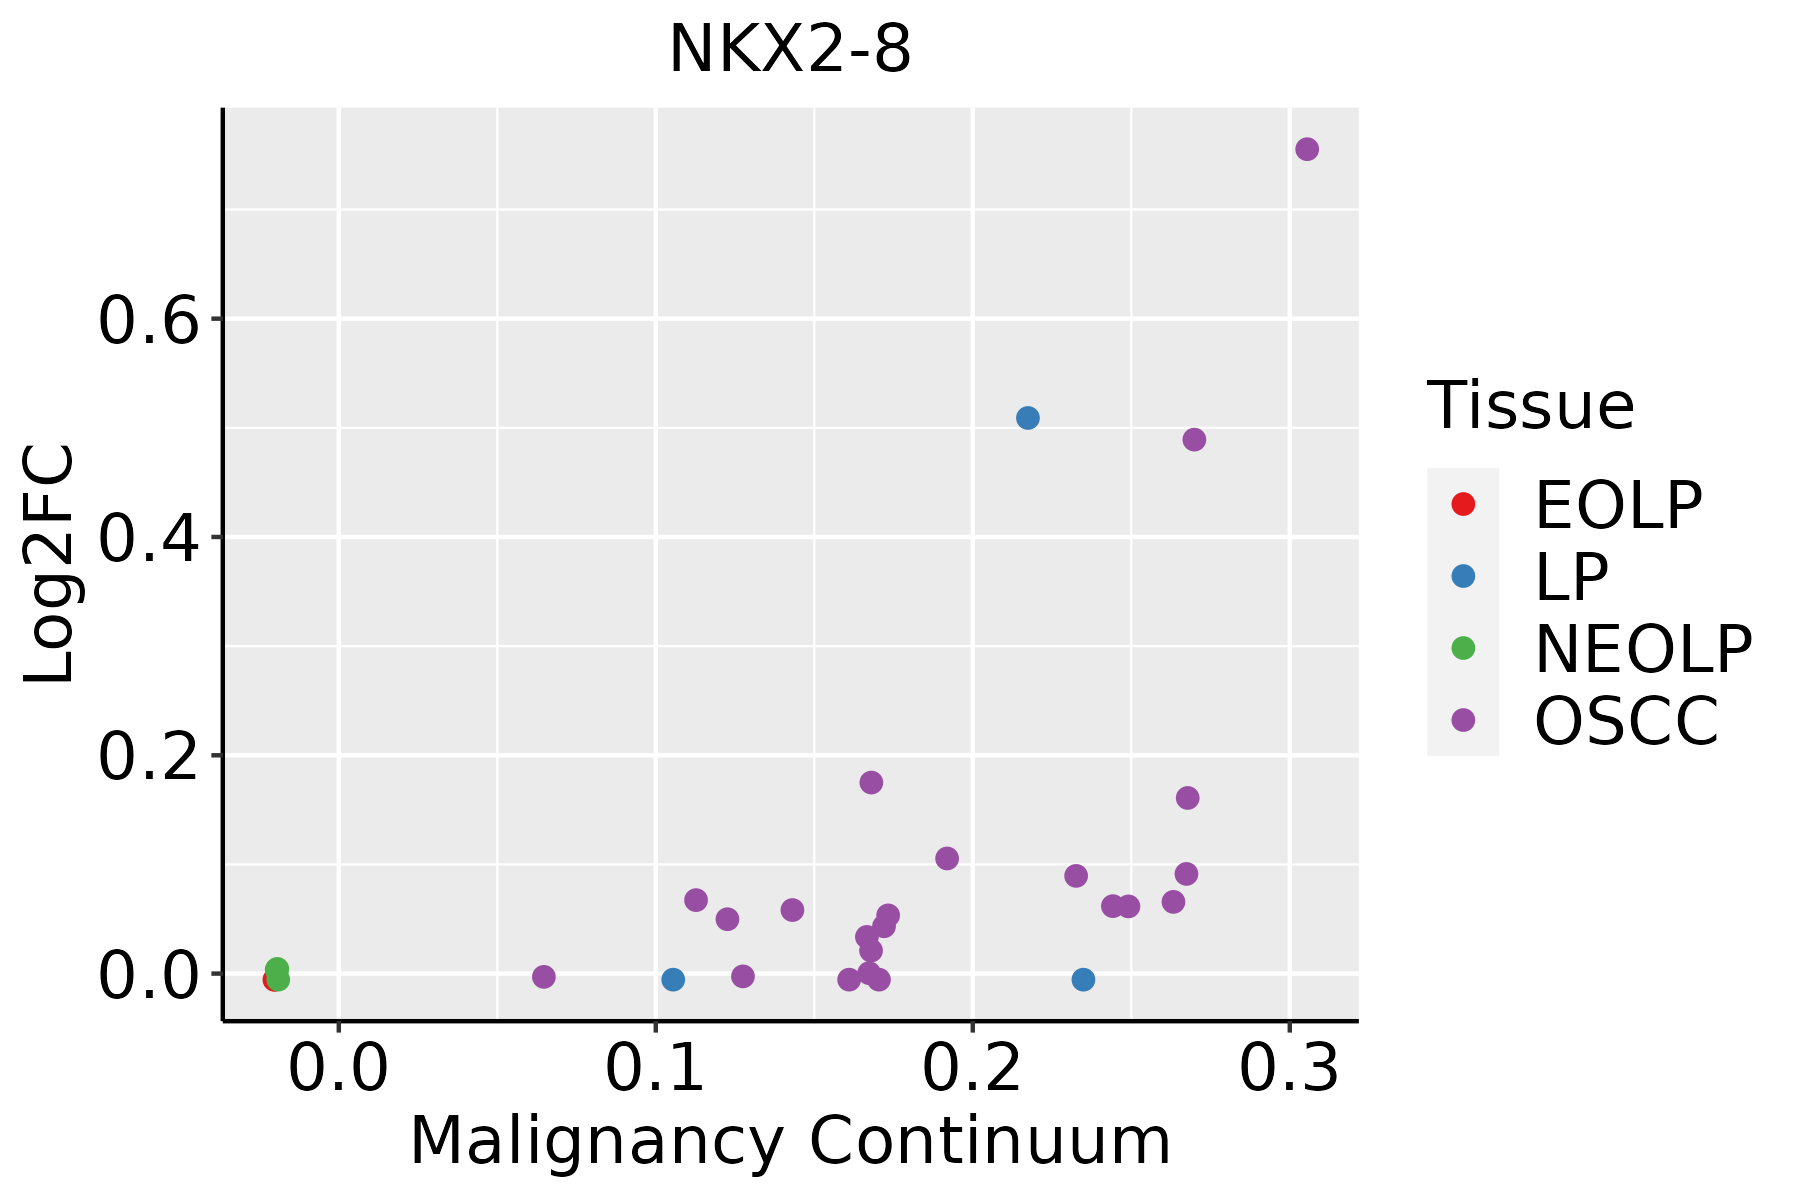 | EOLP: Erosive Oral lichen planus |
| LP: leukoplakia | ||
| NEOLP: Non-erosive oral lichen planus | ||
| OSCC: Oral squamous cell carcinoma |
| ∗log2FC in expression of this searched gene in stem-like cells from each diseased tissue sample relative to stem-like cells in normal samples in each tissue plotted against the malignancy continuum. Samples are colored based on if they are from different disease stage. |
Top |
Malignant transformation related pathway analysis |
| Find out the enriched GO biological processes and KEGG pathways involved in transition from healthy to precancer to cancer |
| Tissue | Disease Stage | Enriched GO biological Processes |
| Colorectum | AD |  |
| Colorectum | SER |  |
| Colorectum | MSS |  |
| Colorectum | MSI-H |  |
| Colorectum | FAP |  |
| ∗Top 15 enriched GO BP terms are showed in the bar plot of each disease state in each tissue. Each row represents a significant GO biological process which is colored according to the -log10(p.adjust). |
| Page: 1 2 3 4 5 6 7 8 9 |
| GO ID | Tissue | Disease Stage | Description | Gene Ratio | Bg Ratio | pvalue | p.adjust | Count |
| GO:0048732111 | Esophagus | ESCC | gland development | 269/8552 | 436/18723 | 7.81e-12 | 2.95e-10 | 269 |
| GO:0061008110 | Esophagus | ESCC | hepaticobiliary system development | 98/8552 | 150/18723 | 8.91e-07 | 1.15e-05 | 98 |
| GO:0001889110 | Esophagus | ESCC | liver development | 96/8552 | 147/18723 | 1.18e-06 | 1.47e-05 | 96 |
| GO:00303239 | Esophagus | ESCC | respiratory tube development | 112/8552 | 181/18723 | 7.82e-06 | 7.69e-05 | 112 |
| GO:00605417 | Esophagus | ESCC | respiratory system development | 123/8552 | 203/18723 | 1.26e-05 | 1.15e-04 | 123 |
| GO:00303249 | Esophagus | ESCC | lung development | 109/8552 | 177/18723 | 1.40e-05 | 1.27e-04 | 109 |
| GO:005067318 | Esophagus | ESCC | epithelial cell proliferation | 238/8552 | 437/18723 | 1.19e-04 | 8.20e-04 | 238 |
| GO:006156415 | Esophagus | ESCC | axon development | 251/8552 | 467/18723 | 2.41e-04 | 1.49e-03 | 251 |
| GO:005067817 | Esophagus | ESCC | regulation of epithelial cell proliferation | 206/8552 | 381/18723 | 5.51e-04 | 3.02e-03 | 206 |
| GO:000740915 | Esophagus | ESCC | axonogenesis | 219/8552 | 418/18723 | 3.14e-03 | 1.31e-02 | 219 |
| GO:004873220 | Oral cavity | OSCC | gland development | 226/7305 | 436/18723 | 2.78e-08 | 5.39e-07 | 226 |
| GO:000188918 | Oral cavity | OSCC | liver development | 87/7305 | 147/18723 | 5.54e-07 | 8.08e-06 | 87 |
| GO:006100818 | Oral cavity | OSCC | hepaticobiliary system development | 88/7305 | 150/18723 | 8.13e-07 | 1.12e-05 | 88 |
| GO:005067310 | Oral cavity | OSCC | epithelial cell proliferation | 212/7305 | 437/18723 | 2.82e-05 | 2.61e-04 | 212 |
| GO:00303238 | Oral cavity | OSCC | respiratory tube development | 95/7305 | 181/18723 | 1.53e-04 | 1.07e-03 | 95 |
| GO:00303248 | Oral cavity | OSCC | lung development | 91/7305 | 177/18723 | 5.18e-04 | 3.01e-03 | 91 |
| GO:005067810 | Oral cavity | OSCC | regulation of epithelial cell proliferation | 180/7305 | 381/18723 | 5.88e-04 | 3.35e-03 | 180 |
| GO:00605416 | Oral cavity | OSCC | respiratory system development | 100/7305 | 203/18723 | 1.83e-03 | 8.60e-03 | 100 |
| GO:006156410 | Oral cavity | OSCC | axon development | 207/7305 | 467/18723 | 1.01e-02 | 3.51e-02 | 207 |
| GO:000188919 | Oral cavity | LP | liver development | 62/4623 | 147/18723 | 2.32e-06 | 5.14e-05 | 62 |
| Page: 1 2 |
| Pathway ID | Tissue | Disease Stage | Description | Gene Ratio | Bg Ratio | pvalue | p.adjust | qvalue | Count |
| Page: 1 |
Top |
Cell-cell communication analysis |
| Identification of potential cell-cell interactions between two cell types and their ligand-receptor pairs for different disease states |
| Ligand | Receptor | LRpair | Pathway | Tissue | Disease Stage |
| Page: 1 |
Top |
Single-cell gene regulatory network inference analysis |
| Find out the significant the regulons (TFs) and the target genes of each regulon across cell types for different disease states |
| TF | Cell Type | Tissue | Disease Stage | Target Gene | RSS | Regulon Activity |
| NKX2-8 | STM | Lung | AAH | CYP2J2,AL592295.3,AC079630.1, etc. | 6.24e-02 |  |
| NKX2-8 | CLUB | Lung | AIS | CYP2J2,AL592295.3,AC079630.1, etc. | 5.00e-02 |  |
| NKX2-8 | BAS | Oral cavity | NEOLP | POPDC3,HOXA10-AS,TAX1BP3, etc. | -2.22e-16 |  |
| NKX2-8 | BAS | Oral cavity | OSCC | POPDC3,HOXA10-AS,TAX1BP3, etc. | 6.44e-02 |  |
| ∗The dot plots of a searched regulon are shown for all cell subpopulations in each disease state of each tissue based on the regulon specific score inferred using pySCENIC and by calculating the average expression. |
| Page: 1 |
Top |
Somatic mutation of malignant transformation related genes |
| Annotation of somatic variants for genes involved in malignant transformation |
| Hugo Symbol | Variant Class | Variant Classification | dbSNP RS | HGVSc | HGVSp | HGVSp Short | SWISSPROT | BIOTYPE | SIFT | PolyPhen | Tumor Sample Barcode | Tissue | Histology | Sex | Age | Stage | Therapy Types | Drugs | Outcome |
| NKX2-8 | SNV | Missense_Mutation | rs199946070 | c.356N>T | p.Ser119Ile | p.S119I | O15522 | protein_coding | deleterious(0) | benign(0.26) | TCGA-D8-A1J9-01 | Breast | breast invasive carcinoma | Female | <65 | I/II | Unknown | Unknown | SD |
| NKX2-8 | SNV | Missense_Mutation | rs199946070 | c.356N>T | p.Ser119Ile | p.S119I | O15522 | protein_coding | deleterious(0) | benign(0.26) | TCGA-D8-A4Z1-01 | Breast | breast invasive carcinoma | Female | >=65 | I/II | Hormone Therapy | tamoxiphen | SD |
| NKX2-8 | SNV | Missense_Mutation | novel | c.161N>T | p.Ser54Leu | p.S54L | O15522 | protein_coding | deleterious(0.02) | possibly_damaging(0.715) | TCGA-MA-AA41-01 | Cervix | cervical & endocervical cancer | Female | <65 | I/II | Unknown | Unknown | SD |
| NKX2-8 | SNV | Missense_Mutation | novel | c.364N>A | p.Arg122Ser | p.R122S | O15522 | protein_coding | tolerated(0.58) | benign(0.089) | TCGA-R2-A69V-01 | Cervix | cervical & endocervical cancer | Female | <65 | I/II | Chemotherapy | cisplatin | SD |
| NKX2-8 | SNV | Missense_Mutation | c.65C>T | p.Ala22Val | p.A22V | O15522 | protein_coding | tolerated(0.09) | benign(0.015) | TCGA-A6-6653-01 | Colorectum | colon adenocarcinoma | Male | >=65 | I/II | Unknown | Unknown | SD | |
| NKX2-8 | SNV | Missense_Mutation | novel | c.404N>T | p.His135Leu | p.H135L | O15522 | protein_coding | deleterious(0) | probably_damaging(0.993) | TCGA-AZ-4315-01 | Colorectum | colon adenocarcinoma | Male | <65 | I/II | Unknown | Unknown | SD |
| NKX2-8 | SNV | Missense_Mutation | c.416T>C | p.Leu139Pro | p.L139P | O15522 | protein_coding | deleterious(0) | possibly_damaging(0.638) | TCGA-CK-5913-01 | Colorectum | colon adenocarcinoma | Female | <65 | I/II | Unknown | Unknown | SD | |
| NKX2-8 | SNV | Missense_Mutation | novel | c.142N>T | p.Arg48Cys | p.R48C | O15522 | protein_coding | deleterious(0.02) | benign(0.011) | TCGA-AJ-A3EL-01 | Endometrium | uterine corpus endometrioid carcinoma | Female | <65 | I/II | Unknown | Unknown | SD |
| NKX2-8 | SNV | Missense_Mutation | c.65N>T | p.Ala22Val | p.A22V | O15522 | protein_coding | tolerated(0.09) | benign(0.015) | TCGA-AP-A1DV-01 | Endometrium | uterine corpus endometrioid carcinoma | Female | <65 | I/II | Unknown | Unknown | SD | |
| NKX2-8 | SNV | Missense_Mutation | c.16N>T | p.Arg6Cys | p.R6C | O15522 | protein_coding | deleterious(0) | probably_damaging(0.939) | TCGA-BS-A0UV-01 | Endometrium | uterine corpus endometrioid carcinoma | Female | <65 | III/IV | Unknown | Unknown | SD |
| Page: 1 2 |
Top |
Related drugs of malignant transformation related genes |
| Identification of chemicals and drugs interact with genes involved in malignant transfromation |
| (DGIdb 4.0) |
| Entrez ID | Symbol | Category | Interaction Types | Drug Claim Name | Drug Name | PMIDs |
| Page: 1 |

Copyright 2023-Present -The University of Texas Health Science Center at Houston |