
|
|||||
|
 | |
| |
| |
| |
| |
| |
|
Gene: NKX2-5 |
Gene summary for NKX2-5 |
| Gene information | Species | Human | Gene symbol | NKX2-5 | Gene ID | 1482 |
| Gene name | NK2 homeobox 5 | |
| Gene Alias | CHNG5 | |
| Cytomap | 5q35.1 | |
| Gene Type | protein-coding | GO ID | GO:0000122 | UniProtAcc | A0A0S2Z3K2 |
Top |
Malignant transformation analysis |
| Identification of the aberrant gene expression in precancerous and cancerous lesions by comparing the gene expression of stem-like cells in diseased tissues with normal stem cells |
| Entrez ID | Symbol | Replicates | Species | Organ | Tissue | Adj P-value | Log2FC | Malignancy |
| 1482 | NKX2-5 | LZE7T | Human | Esophagus | ESCC | 1.40e-08 | 4.31e-01 | 0.0667 |
| 1482 | NKX2-5 | P4T-E | Human | Esophagus | ESCC | 4.48e-22 | 5.08e-01 | 0.1323 |
| 1482 | NKX2-5 | P5T-E | Human | Esophagus | ESCC | 4.30e-10 | 2.10e-01 | 0.1327 |
| 1482 | NKX2-5 | P8T-E | Human | Esophagus | ESCC | 8.40e-04 | 9.69e-02 | 0.0889 |
| 1482 | NKX2-5 | P10T-E | Human | Esophagus | ESCC | 9.53e-09 | 1.66e-01 | 0.116 |
| 1482 | NKX2-5 | P12T-E | Human | Esophagus | ESCC | 9.78e-30 | 5.79e-01 | 0.1122 |
| 1482 | NKX2-5 | P16T-E | Human | Esophagus | ESCC | 2.51e-33 | 5.98e-01 | 0.1153 |
| 1482 | NKX2-5 | P21T-E | Human | Esophagus | ESCC | 3.75e-03 | 1.14e-01 | 0.1617 |
| 1482 | NKX2-5 | P22T-E | Human | Esophagus | ESCC | 5.03e-64 | 1.07e+00 | 0.1236 |
| 1482 | NKX2-5 | P26T-E | Human | Esophagus | ESCC | 3.52e-19 | 3.87e-01 | 0.1276 |
| 1482 | NKX2-5 | P28T-E | Human | Esophagus | ESCC | 1.47e-14 | 2.57e-01 | 0.1149 |
| 1482 | NKX2-5 | P42T-E | Human | Esophagus | ESCC | 3.05e-02 | 1.35e-01 | 0.1175 |
| 1482 | NKX2-5 | P47T-E | Human | Esophagus | ESCC | 4.44e-08 | 2.00e-01 | 0.1067 |
| 1482 | NKX2-5 | P49T-E | Human | Esophagus | ESCC | 6.53e-04 | 3.14e-01 | 0.1768 |
| 1482 | NKX2-5 | P52T-E | Human | Esophagus | ESCC | 4.40e-09 | 2.09e-01 | 0.1555 |
| 1482 | NKX2-5 | P62T-E | Human | Esophagus | ESCC | 1.20e-02 | 1.42e-01 | 0.1302 |
| 1482 | NKX2-5 | P74T-E | Human | Esophagus | ESCC | 5.82e-23 | 5.55e-01 | 0.1479 |
| 1482 | NKX2-5 | P76T-E | Human | Esophagus | ESCC | 5.03e-37 | 7.24e-01 | 0.1207 |
| 1482 | NKX2-5 | P79T-E | Human | Esophagus | ESCC | 4.41e-07 | 1.42e-01 | 0.1154 |
| 1482 | NKX2-5 | P89T-E | Human | Esophagus | ESCC | 5.72e-07 | 4.81e-01 | 0.1752 |
| Page: 1 2 |
| Tissue | Expression Dynamics | Abbreviation |
| Esophagus | 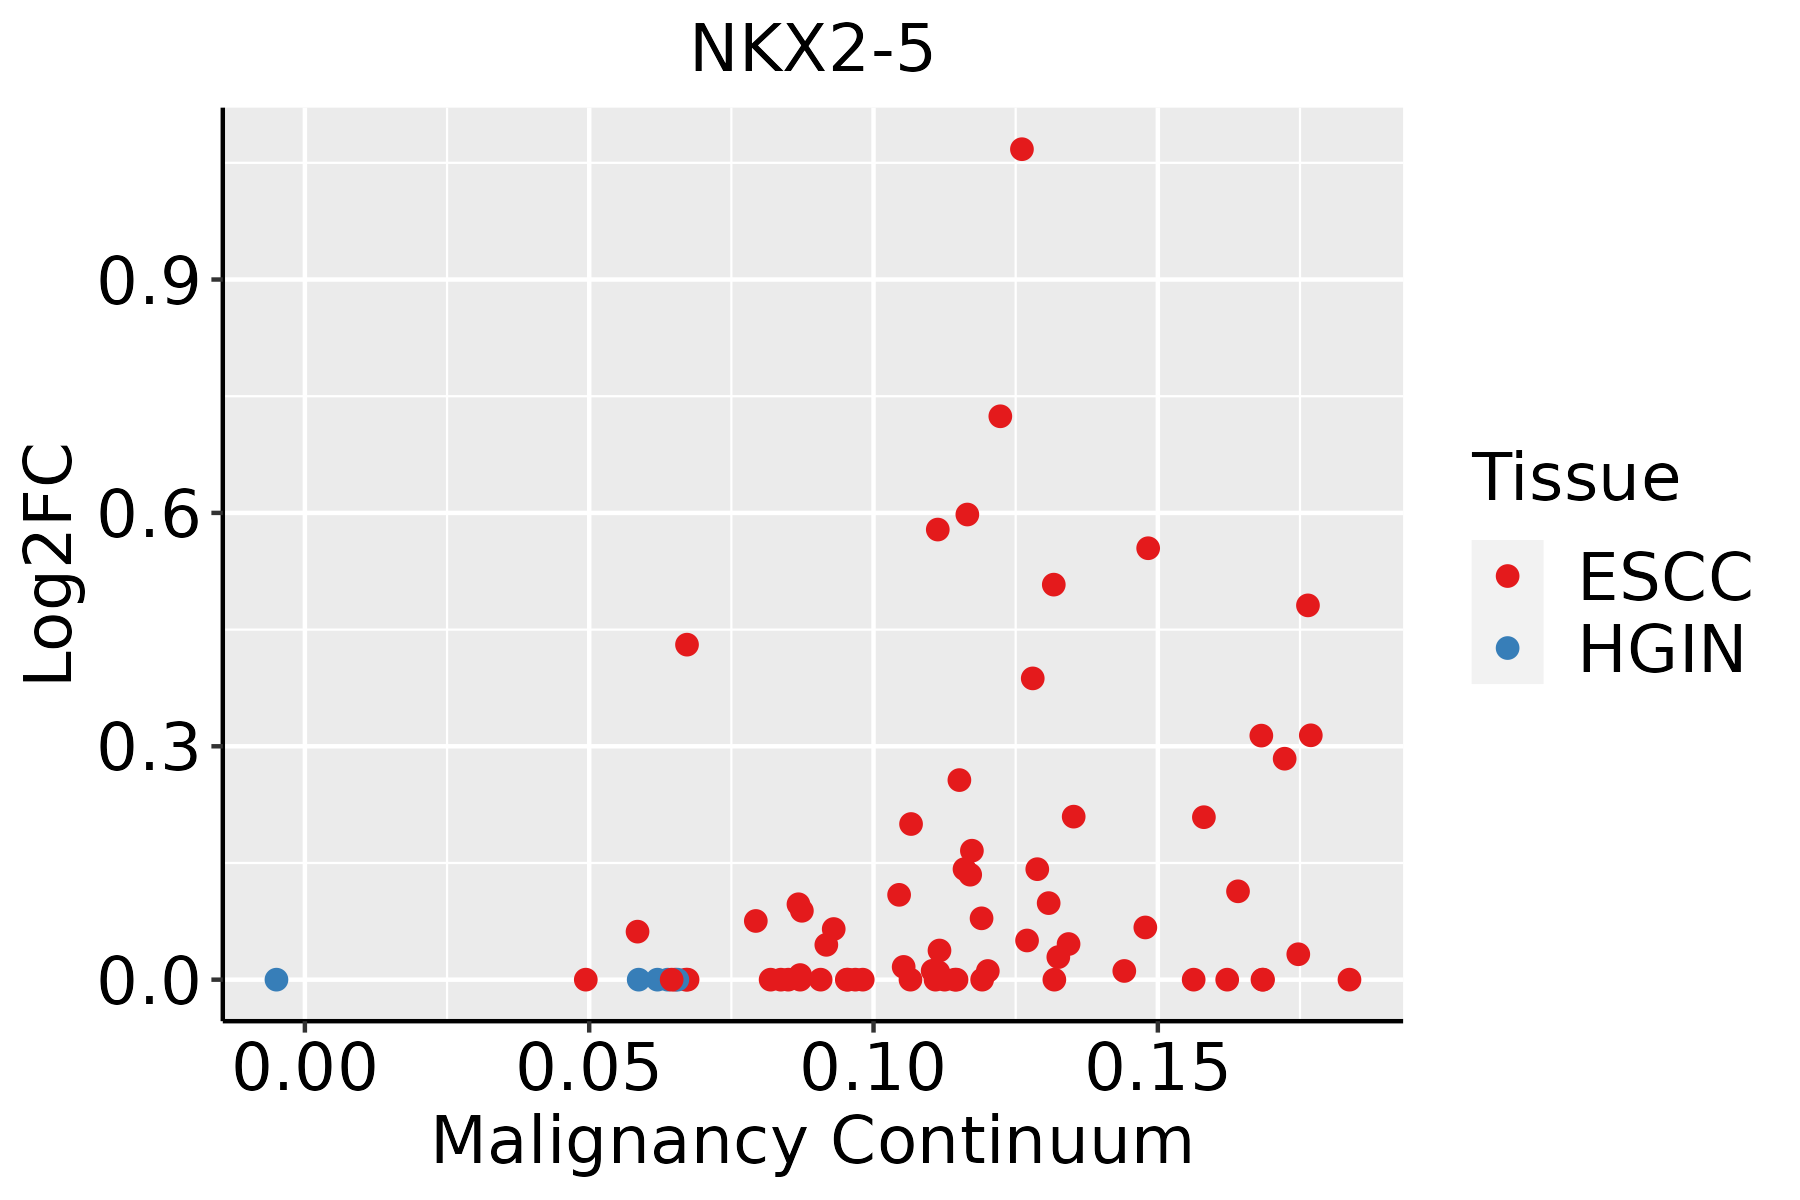 | ESCC: Esophageal squamous cell carcinoma |
| HGIN: High-grade intraepithelial neoplasias | ||
| LGIN: Low-grade intraepithelial neoplasias |
| ∗log2FC in expression of this searched gene in stem-like cells from each diseased tissue sample relative to stem-like cells in normal samples in each tissue plotted against the malignancy continuum. Samples are colored based on if they are from different disease stage. |
Top |
Malignant transformation related pathway analysis |
| Find out the enriched GO biological processes and KEGG pathways involved in transition from healthy to precancer to cancer |
| Tissue | Disease Stage | Enriched GO biological Processes |
| Colorectum | AD |  |
| Colorectum | SER |  |
| Colorectum | MSS |  |
| Colorectum | MSI-H |  |
| Colorectum | FAP |  |
| ∗Top 15 enriched GO BP terms are showed in the bar plot of each disease state in each tissue. Each row represents a significant GO biological process which is colored according to the -log10(p.adjust). |
| Page: 1 2 3 4 5 6 7 8 9 |
| GO ID | Tissue | Disease Stage | Description | Gene Ratio | Bg Ratio | pvalue | p.adjust | Count |
| GO:0048732111 | Esophagus | ESCC | gland development | 269/8552 | 436/18723 | 7.81e-12 | 2.95e-10 | 269 |
| GO:001605517 | Esophagus | ESCC | Wnt signaling pathway | 268/8552 | 444/18723 | 2.32e-10 | 6.58e-09 | 268 |
| GO:019873817 | Esophagus | ESCC | cell-cell signaling by wnt | 269/8552 | 446/18723 | 2.41e-10 | 6.79e-09 | 269 |
| GO:003011117 | Esophagus | ESCC | regulation of Wnt signaling pathway | 194/8552 | 328/18723 | 5.39e-07 | 7.14e-06 | 194 |
| GO:006007016 | Esophagus | ESCC | canonical Wnt signaling pathway | 180/8552 | 303/18723 | 9.15e-07 | 1.17e-05 | 180 |
| GO:00063673 | Esophagus | ESCC | transcription initiation from RNA polymerase II promoter | 56/8552 | 77/18723 | 1.30e-06 | 1.59e-05 | 56 |
| GO:006082817 | Esophagus | ESCC | regulation of canonical Wnt signaling pathway | 153/8552 | 253/18723 | 1.38e-06 | 1.67e-05 | 153 |
| GO:000635211 | Esophagus | ESCC | DNA-templated transcription, initiation | 86/8552 | 130/18723 | 1.88e-06 | 2.19e-05 | 86 |
| GO:006056210 | Esophagus | ESCC | epithelial tube morphogenesis | 187/8552 | 325/18723 | 9.95e-06 | 9.44e-05 | 187 |
| GO:00488638 | Esophagus | ESCC | stem cell differentiation | 122/8552 | 206/18723 | 5.95e-05 | 4.59e-04 | 122 |
| GO:00602603 | Esophagus | ESCC | regulation of transcription initiation from RNA polymerase II promoter | 25/8552 | 33/18723 | 4.30e-04 | 2.43e-03 | 25 |
| GO:200014212 | Esophagus | ESCC | regulation of DNA-templated transcription, initiation | 29/8552 | 40/18723 | 5.32e-04 | 2.93e-03 | 29 |
| GO:00485687 | Esophagus | ESCC | embryonic organ development | 228/8552 | 427/18723 | 7.28e-04 | 3.79e-03 | 228 |
| GO:200073614 | Esophagus | ESCC | regulation of stem cell differentiation | 39/8552 | 58/18723 | 7.43e-04 | 3.86e-03 | 39 |
| GO:00301788 | Esophagus | ESCC | negative regulation of Wnt signaling pathway | 97/8552 | 170/18723 | 1.81e-03 | 8.31e-03 | 97 |
| GO:006053716 | Esophagus | ESCC | muscle tissue development | 211/8552 | 403/18723 | 3.84e-03 | 1.56e-02 | 211 |
| GO:00900905 | Esophagus | ESCC | negative regulation of canonical Wnt signaling pathway | 78/8552 | 137/18723 | 5.17e-03 | 1.95e-02 | 78 |
| GO:00350512 | Esophagus | ESCC | cardiocyte differentiation | 86/8552 | 156/18723 | 1.09e-02 | 3.68e-02 | 86 |
| GO:20001443 | Esophagus | ESCC | positive regulation of DNA-templated transcription, initiation | 21/8552 | 31/18723 | 1.10e-02 | 3.70e-02 | 21 |
| GO:00031793 | Esophagus | ESCC | heart valve morphogenesis | 34/8552 | 55/18723 | 1.16e-02 | 3.90e-02 | 34 |
| Page: 1 2 |
| Pathway ID | Tissue | Disease Stage | Description | Gene Ratio | Bg Ratio | pvalue | p.adjust | qvalue | Count |
| Page: 1 |
Top |
Cell-cell communication analysis |
| Identification of potential cell-cell interactions between two cell types and their ligand-receptor pairs for different disease states |
| Ligand | Receptor | LRpair | Pathway | Tissue | Disease Stage |
| Page: 1 |
Top |
Single-cell gene regulatory network inference analysis |
| Find out the significant the regulons (TFs) and the target genes of each regulon across cell types for different disease states |
| TF | Cell Type | Tissue | Disease Stage | Target Gene | RSS | Regulon Activity |
| ∗The dot plots of a searched regulon are shown for all cell subpopulations in each disease state of each tissue based on the regulon specific score inferred using pySCENIC and by calculating the average expression. |
| Page: 1 |
Top |
Somatic mutation of malignant transformation related genes |
| Annotation of somatic variants for genes involved in malignant transformation |
| Hugo Symbol | Variant Class | Variant Classification | dbSNP RS | HGVSc | HGVSp | HGVSp Short | SWISSPROT | BIOTYPE | SIFT | PolyPhen | Tumor Sample Barcode | Tissue | Histology | Sex | Age | Stage | Therapy Types | Drugs | Outcome |
| NKX2-5 | SNV | Missense_Mutation | c.481N>T | p.Arg161Trp | p.R161W | P52952 | protein_coding | deleterious(0) | probably_damaging(0.967) | TCGA-A6-6780-01 | Colorectum | colon adenocarcinoma | Male | >=65 | I/II | Unknown | Unknown | SD | |
| NKX2-5 | SNV | Missense_Mutation | c.485A>G | p.Tyr162Cys | p.Y162C | P52952 | protein_coding | deleterious(0) | probably_damaging(1) | TCGA-AA-3864-01 | Colorectum | colon adenocarcinoma | Male | >=65 | I/II | Unknown | Unknown | SD | |
| NKX2-5 | SNV | Missense_Mutation | c.584G>A | p.Arg195Gln | p.R195Q | P52952 | protein_coding | deleterious(0) | probably_damaging(0.995) | TCGA-AD-5900-01 | Colorectum | colon adenocarcinoma | Male | >=65 | I/II | Unknown | Unknown | SD | |
| NKX2-5 | SNV | Missense_Mutation | c.467N>A | p.Arg156His | p.R156H | P52952 | protein_coding | deleterious(0) | probably_damaging(1) | TCGA-AM-5821-01 | Colorectum | colon adenocarcinoma | Female | >=65 | I/II | Unknown | Unknown | SD | |
| NKX2-5 | SNV | Missense_Mutation | c.485N>G | p.Tyr162Cys | p.Y162C | P52952 | protein_coding | deleterious(0) | probably_damaging(1) | TCGA-AY-6197-01 | Colorectum | colon adenocarcinoma | Male | <65 | I/II | Unknown | Unknown | SD | |
| NKX2-5 | SNV | Missense_Mutation | c.460G>C | p.Glu154Gln | p.E154Q | P52952 | protein_coding | deleterious(0) | possibly_damaging(0.838) | TCGA-CK-4951-01 | Colorectum | colon adenocarcinoma | Female | >=65 | I/II | Unknown | Unknown | PD | |
| NKX2-5 | SNV | Missense_Mutation | c.88N>T | p.Ala30Ser | p.A30S | P52952 | protein_coding | tolerated(0.64) | benign(0.001) | TCGA-CK-4952-01 | Colorectum | colon adenocarcinoma | Female | <65 | III/IV | Unknown | Unknown | SD | |
| NKX2-5 | SNV | Missense_Mutation | c.224G>A | p.Arg75His | p.R75H | P52952 | protein_coding | tolerated(0.13) | benign(0) | TCGA-CM-4743-01 | Colorectum | colon adenocarcinoma | Male | >=65 | I/II | Chemotherapy | capecitabine | SD | |
| NKX2-5 | SNV | Missense_Mutation | c.899T>C | p.Leu300Ser | p.L300S | P52952 | protein_coding | deleterious(0) | probably_damaging(0.996) | TCGA-AP-A056-01 | Endometrium | uterine corpus endometrioid carcinoma | Female | <65 | I/II | Unknown | Unknown | SD | |
| NKX2-5 | SNV | Missense_Mutation | novel | c.806G>T | p.Ser269Ile | p.S269I | P52952 | protein_coding | deleterious(0.01) | benign(0.276) | TCGA-DF-A2KU-01 | Endometrium | uterine corpus endometrioid carcinoma | Female | Unknown | I/II | Unknown | Unknown | SD |
| Page: 1 2 3 4 |
Top |
Related drugs of malignant transformation related genes |
| Identification of chemicals and drugs interact with genes involved in malignant transfromation |
| (DGIdb 4.0) |
| Entrez ID | Symbol | Category | Interaction Types | Drug Claim Name | Drug Name | PMIDs |
| Page: 1 |

Copyright 2023-Present -The University of Texas Health Science Center at Houston |