Schematic overview of the cellular and molecular mechanisms involved in the cancer progression, including the proposed cellular and molecular mechanisms in cancer cells trajectory. AT1: alveolar type 1 cells; AT2: alveolar type 2 cells; AAH: atypical adenomatous hyperplasia; AIS: adenocarcinoma in situ; MIA: minimally invasive adenocarcinoma; IA: invasive adenocarcinoma; EMT: epithelial-mesenchymal transition

Home

Download

Statistics

Help

Contact

Center for Computational Systems Medicine
leaf

Gene summary

leaf

Malignant transformation analysis

leaf

Malignant transformation related pathway analysis

leaf

Cell-cell communication analysis

leaf

Single-cell gene regulatory network inference analysis

leaf

Somatic mutation of malignant transformation related genes

leaf

Related drugs of malignant transformation related genes

Gene: NKTR

Gene summary for NKTR

check button Gene summary.

Gene informationSpeciesHuman
Gene symbol

NKTR

Gene ID

4820

Gene namenatural killer cell triggering receptor
Gene Aliasp104
Cytomap3p22.1
Gene Typeprotein-coding
GO ID

GO:0000413

UniProtAcc

A0A024R2N6


Top

Malignant transformation analysis

check button Identification of the aberrant gene expression in precancerous and cancerous lesions by comparing the gene expression of stem-like cells in diseased tissues with normal stem cells
check button Malignant transformation involving gene list.
Entrez IDSymbolReplicatesSpeciesOrganTissueAdj P-valueLog2FCMalignancy
4820NKTRGSM4909281HumanBreastIDC7.16e-093.92e-010.21
4820NKTRGSM4909292HumanBreastIDC4.81e-036.62e-010.1236
4820NKTRGSM4909294HumanBreastIDC3.90e-02-2.55e-010.2022
4820NKTRGSM4909296HumanBreastIDC1.26e-12-3.20e-010.1524
4820NKTRGSM4909297HumanBreastIDC3.83e-08-2.38e-010.1517
4820NKTRGSM4909309HumanBreastIDC3.74e-02-1.56e-010.0483
4820NKTRGSM4909311HumanBreastIDC1.03e-23-3.11e-010.1534
4820NKTRGSM4909312HumanBreastIDC6.48e-08-1.82e-010.1552
4820NKTRGSM4909319HumanBreastIDC1.12e-23-3.94e-010.1563
4820NKTRGSM4909320HumanBreastIDC3.22e-08-3.43e-010.1575
4820NKTRGSM4909321HumanBreastIDC9.68e-13-2.70e-010.1559
4820NKTRM1HumanBreastIDC2.23e-065.13e-010.1577
4820NKTRNCCBC14HumanBreastDCIS3.20e-09-2.07e-010.2021
4820NKTRNCCBC5HumanBreastDCIS6.36e-12-3.21e-010.2046
4820NKTRP1HumanBreastIDC1.99e-212.88e-010.1527
4820NKTRP2HumanBreastIDC1.35e-02-2.82e-010.21
4820NKTRDCIS2HumanBreastDCIS4.85e-534.10e-010.0085
4820NKTRHTA11_3410_2000001011HumanColorectumAD5.08e-38-9.77e-010.0155
4820NKTRHTA11_2487_2000001011HumanColorectumSER1.88e-21-9.09e-01-0.1808
4820NKTRHTA11_2951_2000001011HumanColorectumAD2.73e-08-1.08e+000.0216
Page: 1 2 3 4 5 6 7 8 9 10 11 12 13 

check button Transcriptomic changes along malignancy continuum.
TissueExpression DynamicsAbbreviation
BreastThe image shows the transcriptomic changes along malignancy continuum.log2FC in expression of this searched gene in stem-like cells from each diseased tissue sample relative to stem-like cells in normal samples in each tissue plotted against the malignancy continuum. Samples are colored based on if they are from different disease stage.
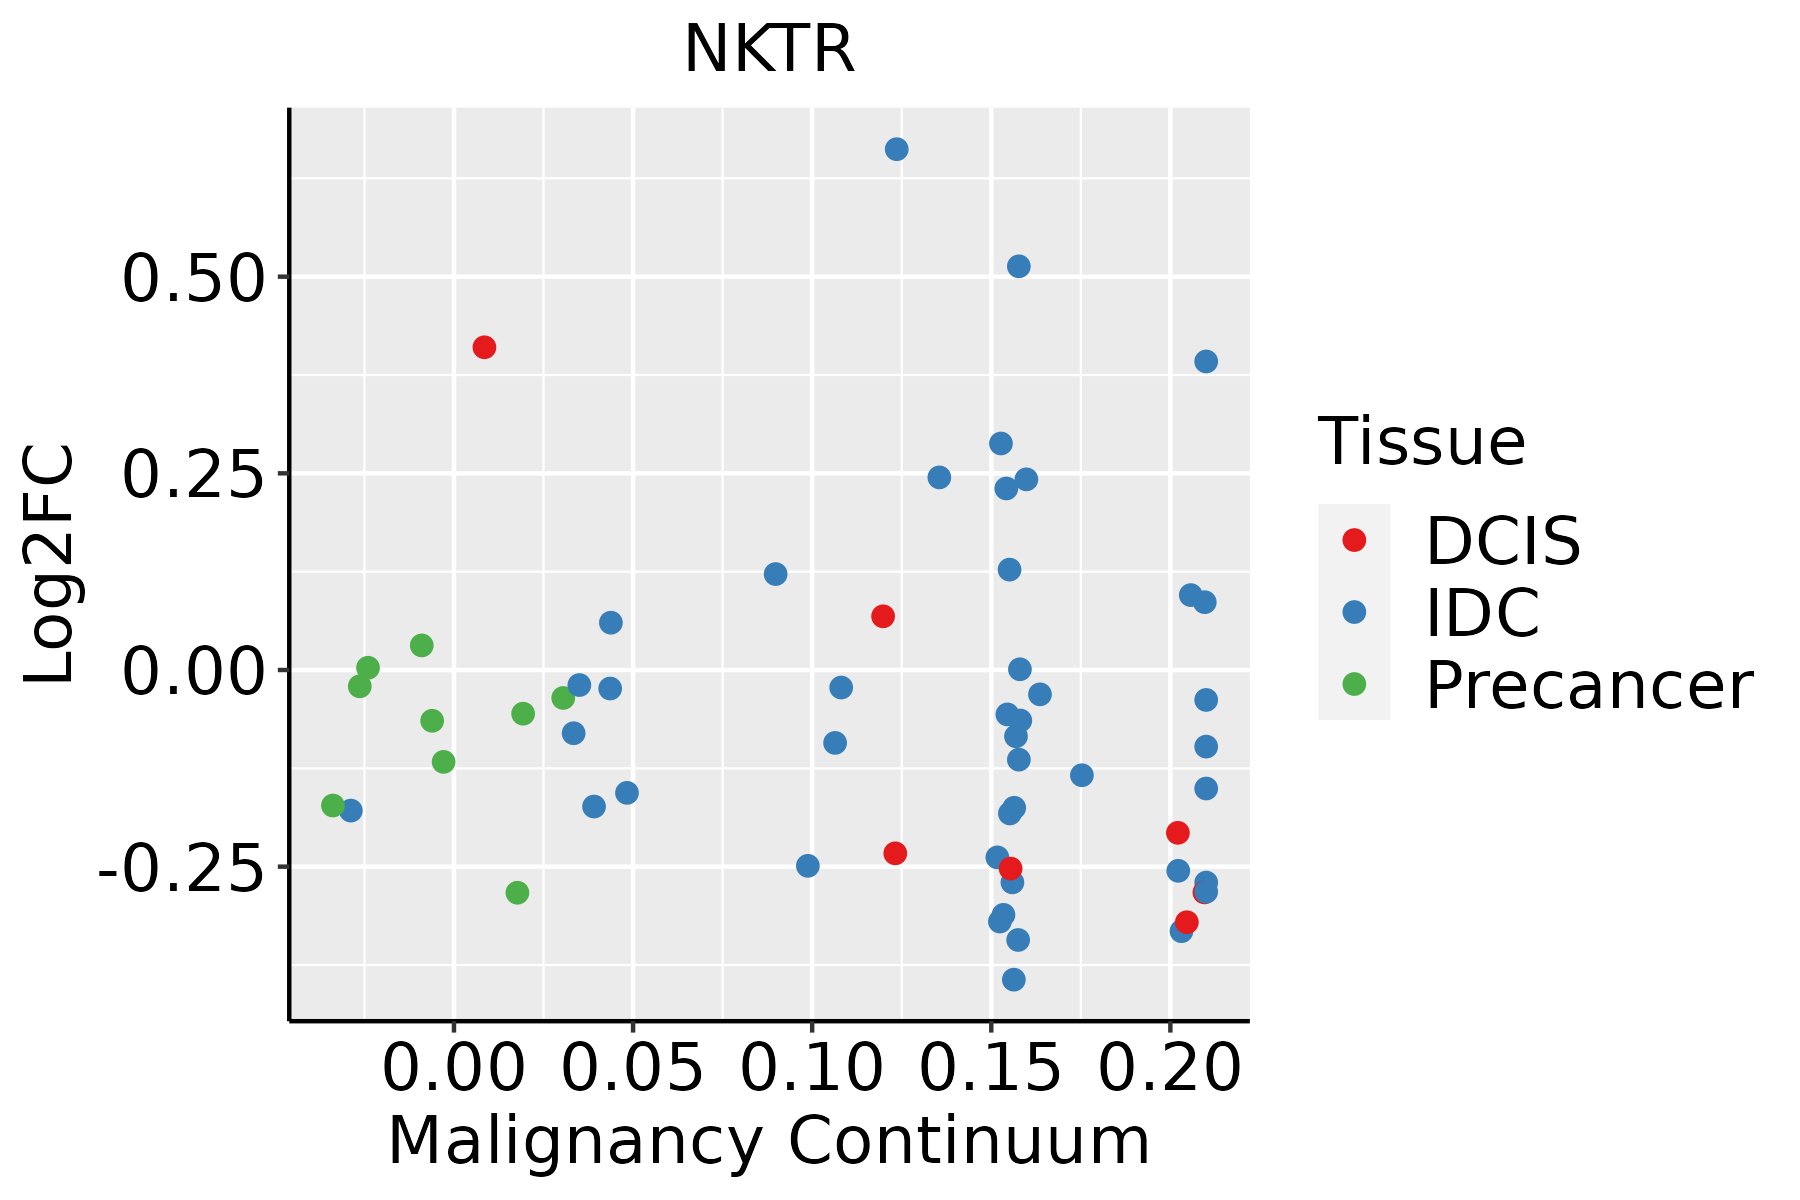
IDC: Invasive ductal carcinoma
DCIS: Ductal carcinoma in situ
Precancer(BRCA1-mut): Precancerous lesion from BRCA1 mutation carriers
Colorectum (GSE201348)The image shows the transcriptomic changes along malignancy continuum.log2FC in expression of this searched gene in stem-like cells from each diseased tissue sample relative to stem-like cells in normal samples in each tissue plotted against the malignancy continuum. Samples are colored based on if they are from different disease stage.FAP: Familial adenomatous polyposis
CRC: Colorectal cancer
Colorectum (HTA11)The image shows the transcriptomic changes along malignancy continuum.log2FC in expression of this searched gene in stem-like cells from each diseased tissue sample relative to stem-like cells in normal samples in each tissue plotted against the malignancy continuum. Samples are colored based on if they are from different disease stage.AD: Adenomas
SER: Sessile serrated lesions
MSI-H: Microsatellite-high colorectal cancer
MSS: Microsatellite stable colorectal cancer
EndometriumThe image shows the transcriptomic changes along malignancy continuum.log2FC in expression of this searched gene in stem-like cells from each diseased tissue sample relative to stem-like cells in normal samples in each tissue plotted against the malignancy continuum. Samples are colored based on if they are from different disease stage.AEH: Atypical endometrial hyperplasia
EEC: Endometrioid Cancer
EsophagusThe image shows the transcriptomic changes along malignancy continuum.log2FC in expression of this searched gene in stem-like cells from each diseased tissue sample relative to stem-like cells in normal samples in each tissue plotted against the malignancy continuum. Samples are colored based on if they are from different disease stage.ESCC: Esophageal squamous cell carcinoma
HGIN: High-grade intraepithelial neoplasias
LGIN: Low-grade intraepithelial neoplasias
LiverThe image shows the transcriptomic changes along malignancy continuum.log2FC in expression of this searched gene in stem-like cells from each diseased tissue sample relative to stem-like cells in normal samples in each tissue plotted against the malignancy continuum. Samples are colored based on if they are from different disease stage.
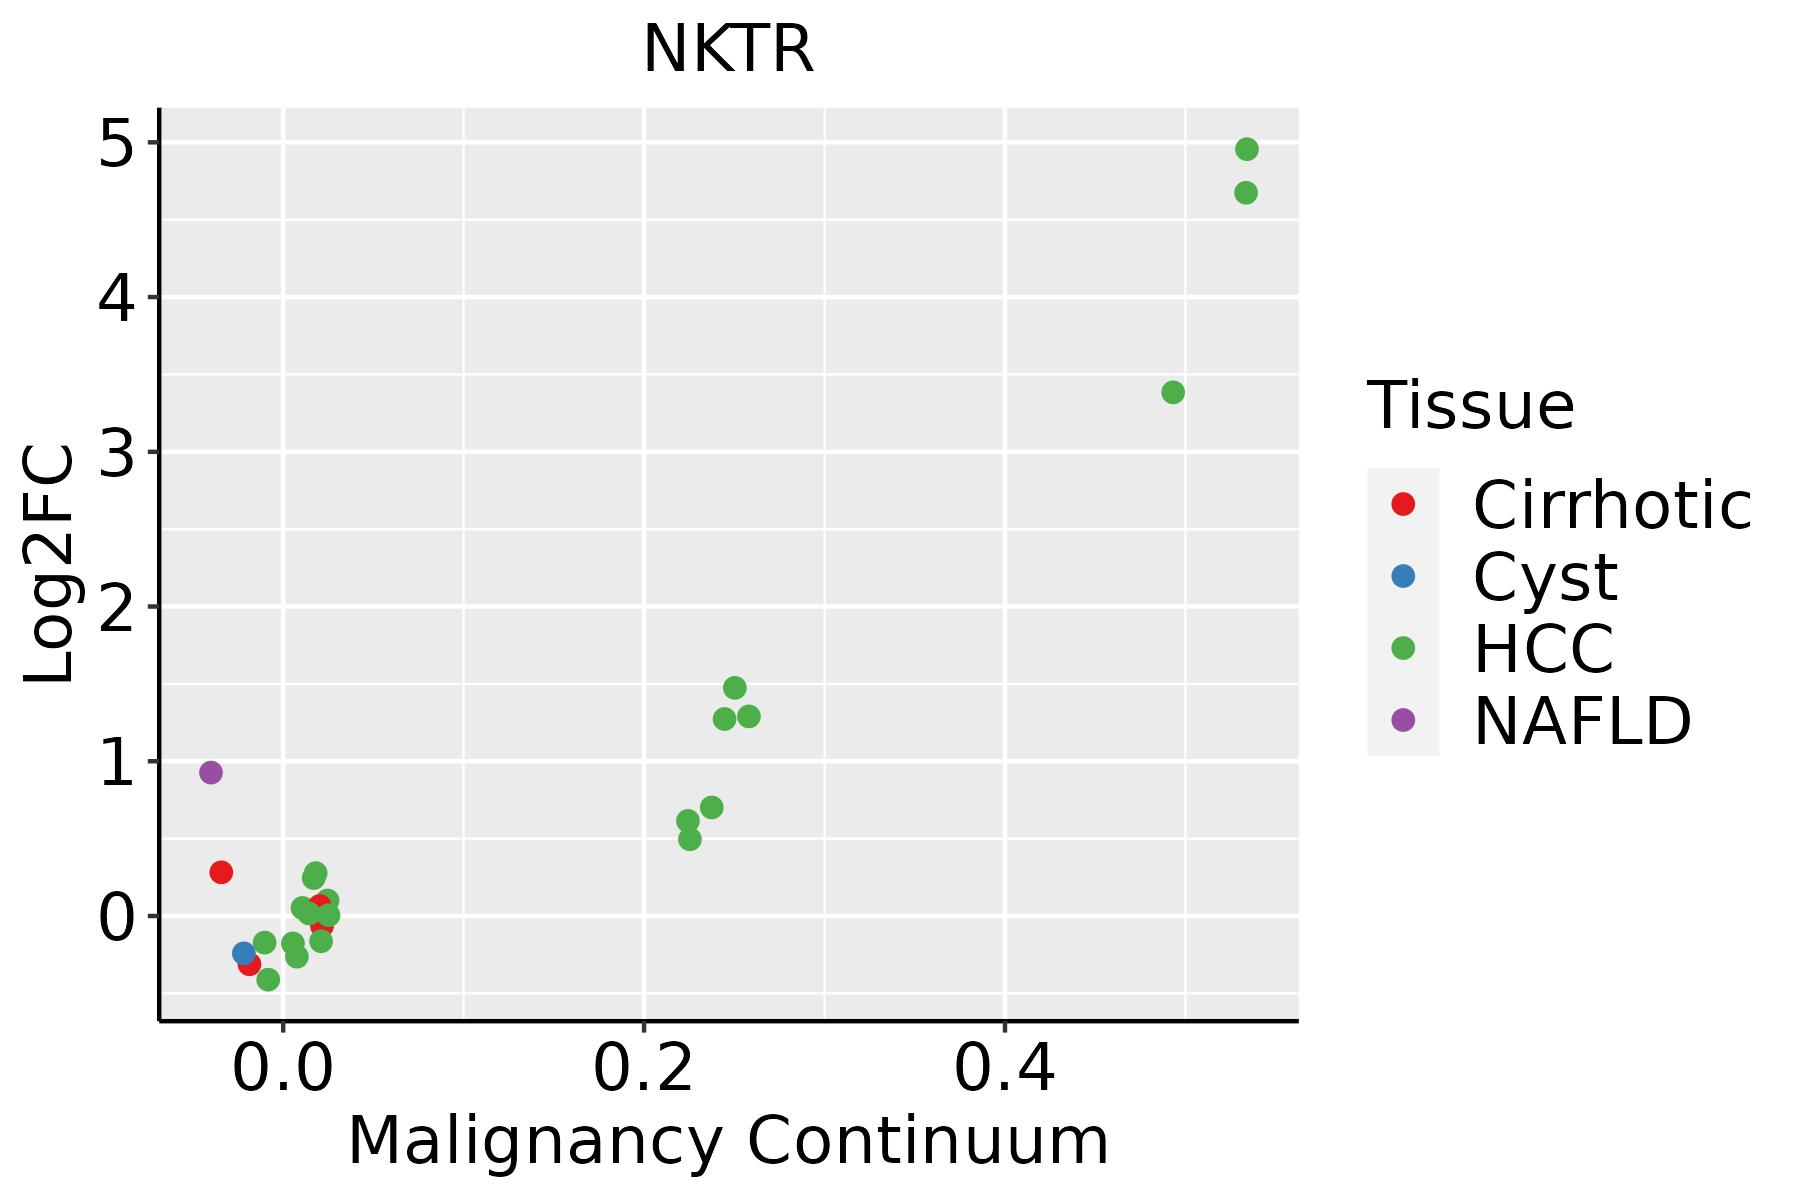
HCC: Hepatocellular carcinoma
NAFLD: Non-alcoholic fatty liver disease
LungThe image shows the transcriptomic changes along malignancy continuum.log2FC in expression of this searched gene in stem-like cells from each diseased tissue sample relative to stem-like cells in normal samples in each tissue plotted against the malignancy continuum. Samples are colored based on if they are from different disease stage.
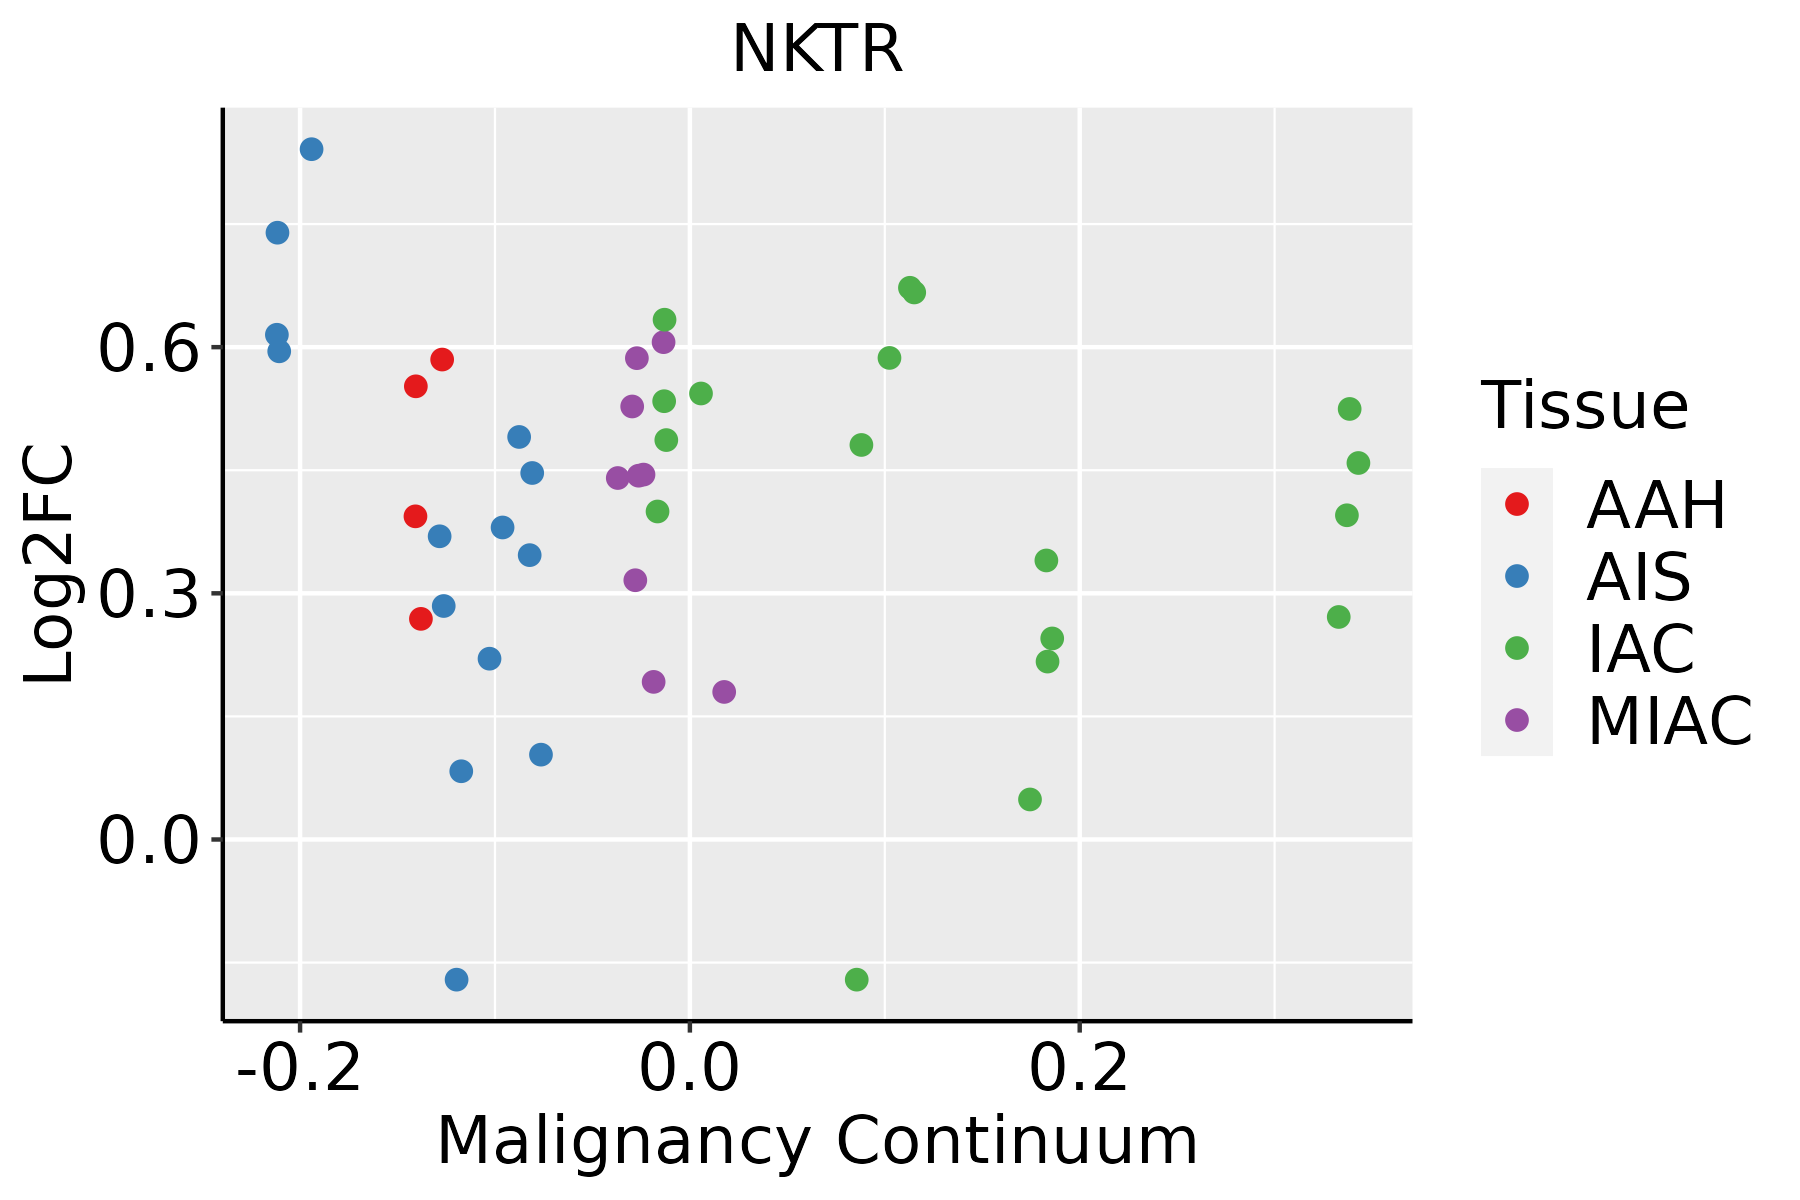
AAH: Atypical adenomatous hyperplasia
AIS: Adenocarcinoma in situ
IAC: Invasive lung adenocarcinoma
MIA: Minimally invasive adenocarcinoma
Oral CavityThe image shows the transcriptomic changes along malignancy continuum.log2FC in expression of this searched gene in stem-like cells from each diseased tissue sample relative to stem-like cells in normal samples in each tissue plotted against the malignancy continuum. Samples are colored based on if they are from different disease stage.
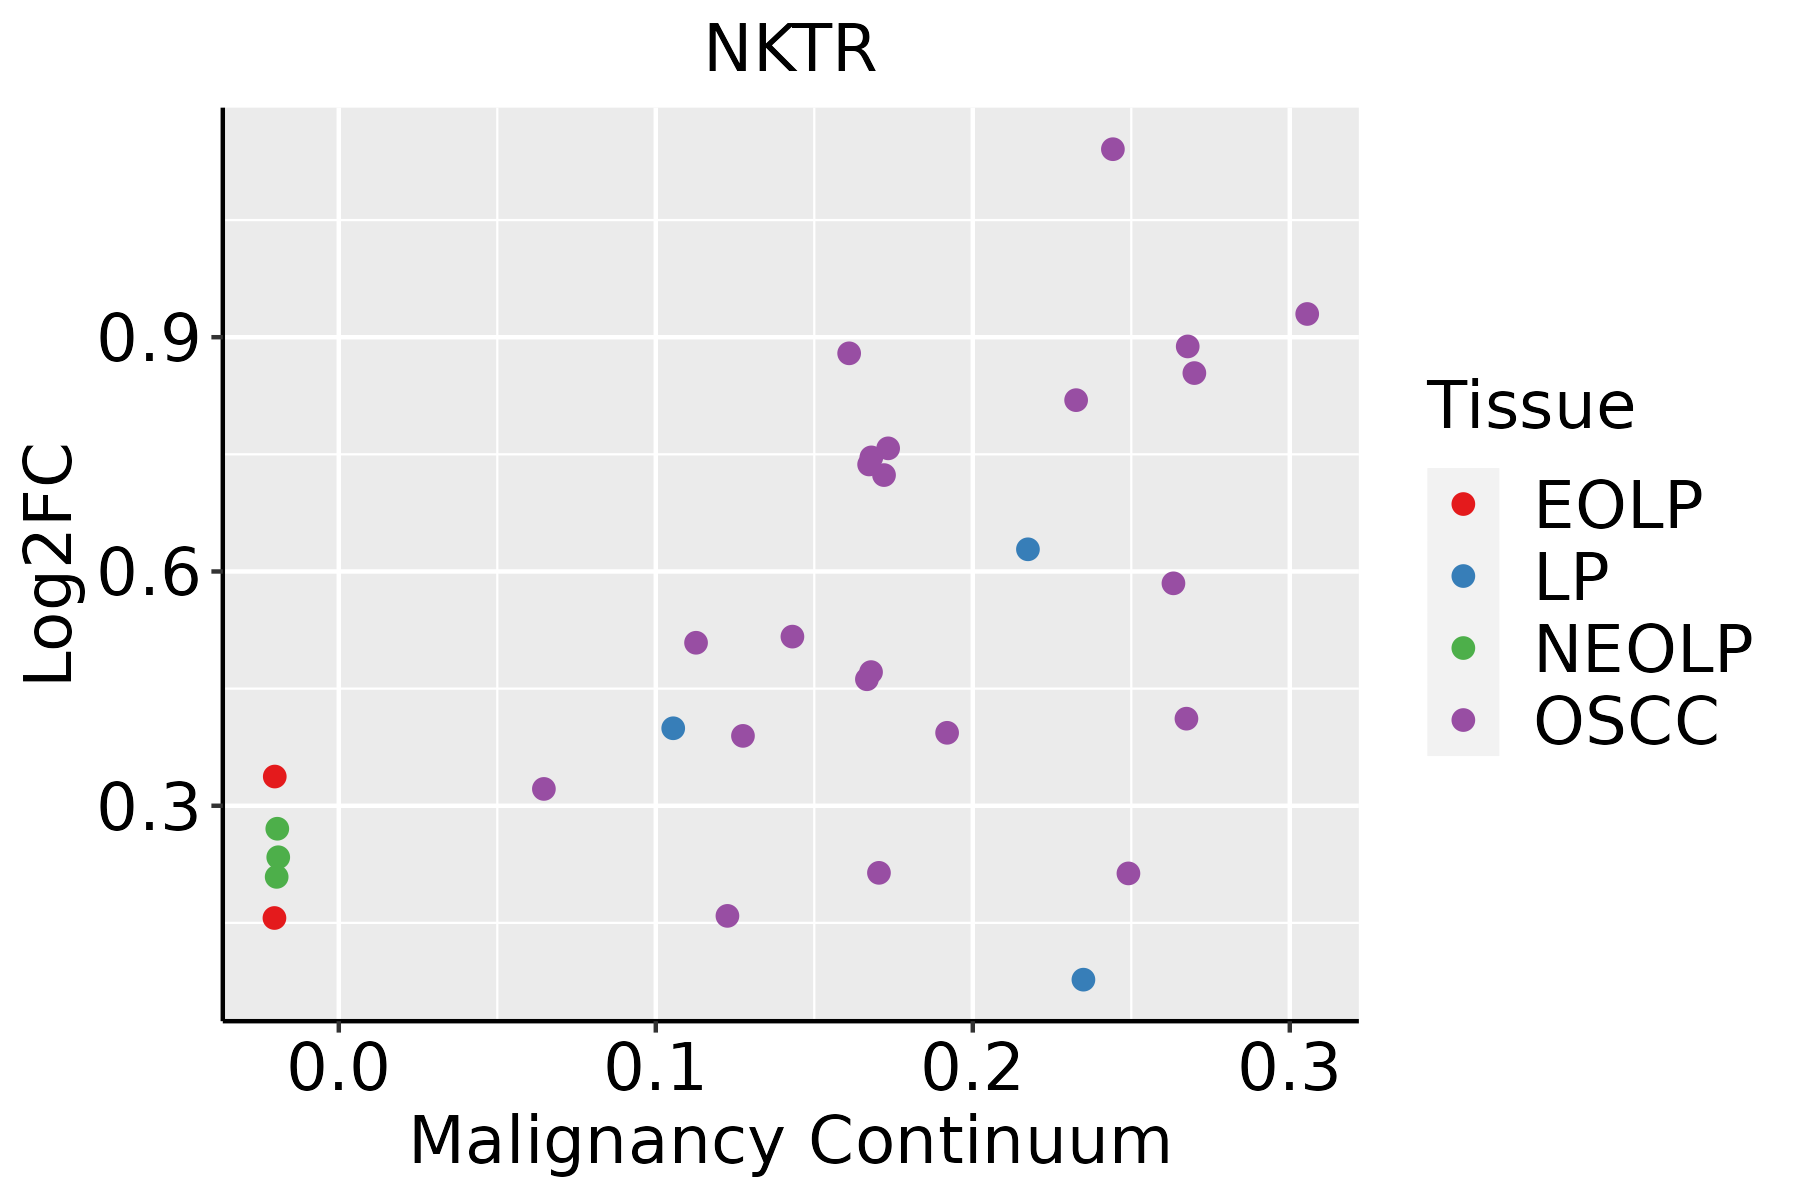
EOLP: Erosive Oral lichen planus
LP: leukoplakia
NEOLP: Non-erosive oral lichen planus
OSCC: Oral squamous cell carcinoma
ProstateThe image shows the transcriptomic changes along malignancy continuum.log2FC in expression of this searched gene in stem-like cells from each diseased tissue sample relative to stem-like cells in normal samples in each tissue plotted against the malignancy continuum. Samples are colored based on if they are from different disease stage.BPH: Benign Prostatic Hyperplasia
SkinThe image shows the transcriptomic changes along malignancy continuum.log2FC in expression of this searched gene in stem-like cells from each diseased tissue sample relative to stem-like cells in normal samples in each tissue plotted against the malignancy continuum. Samples are colored based on if they are from different disease stage.
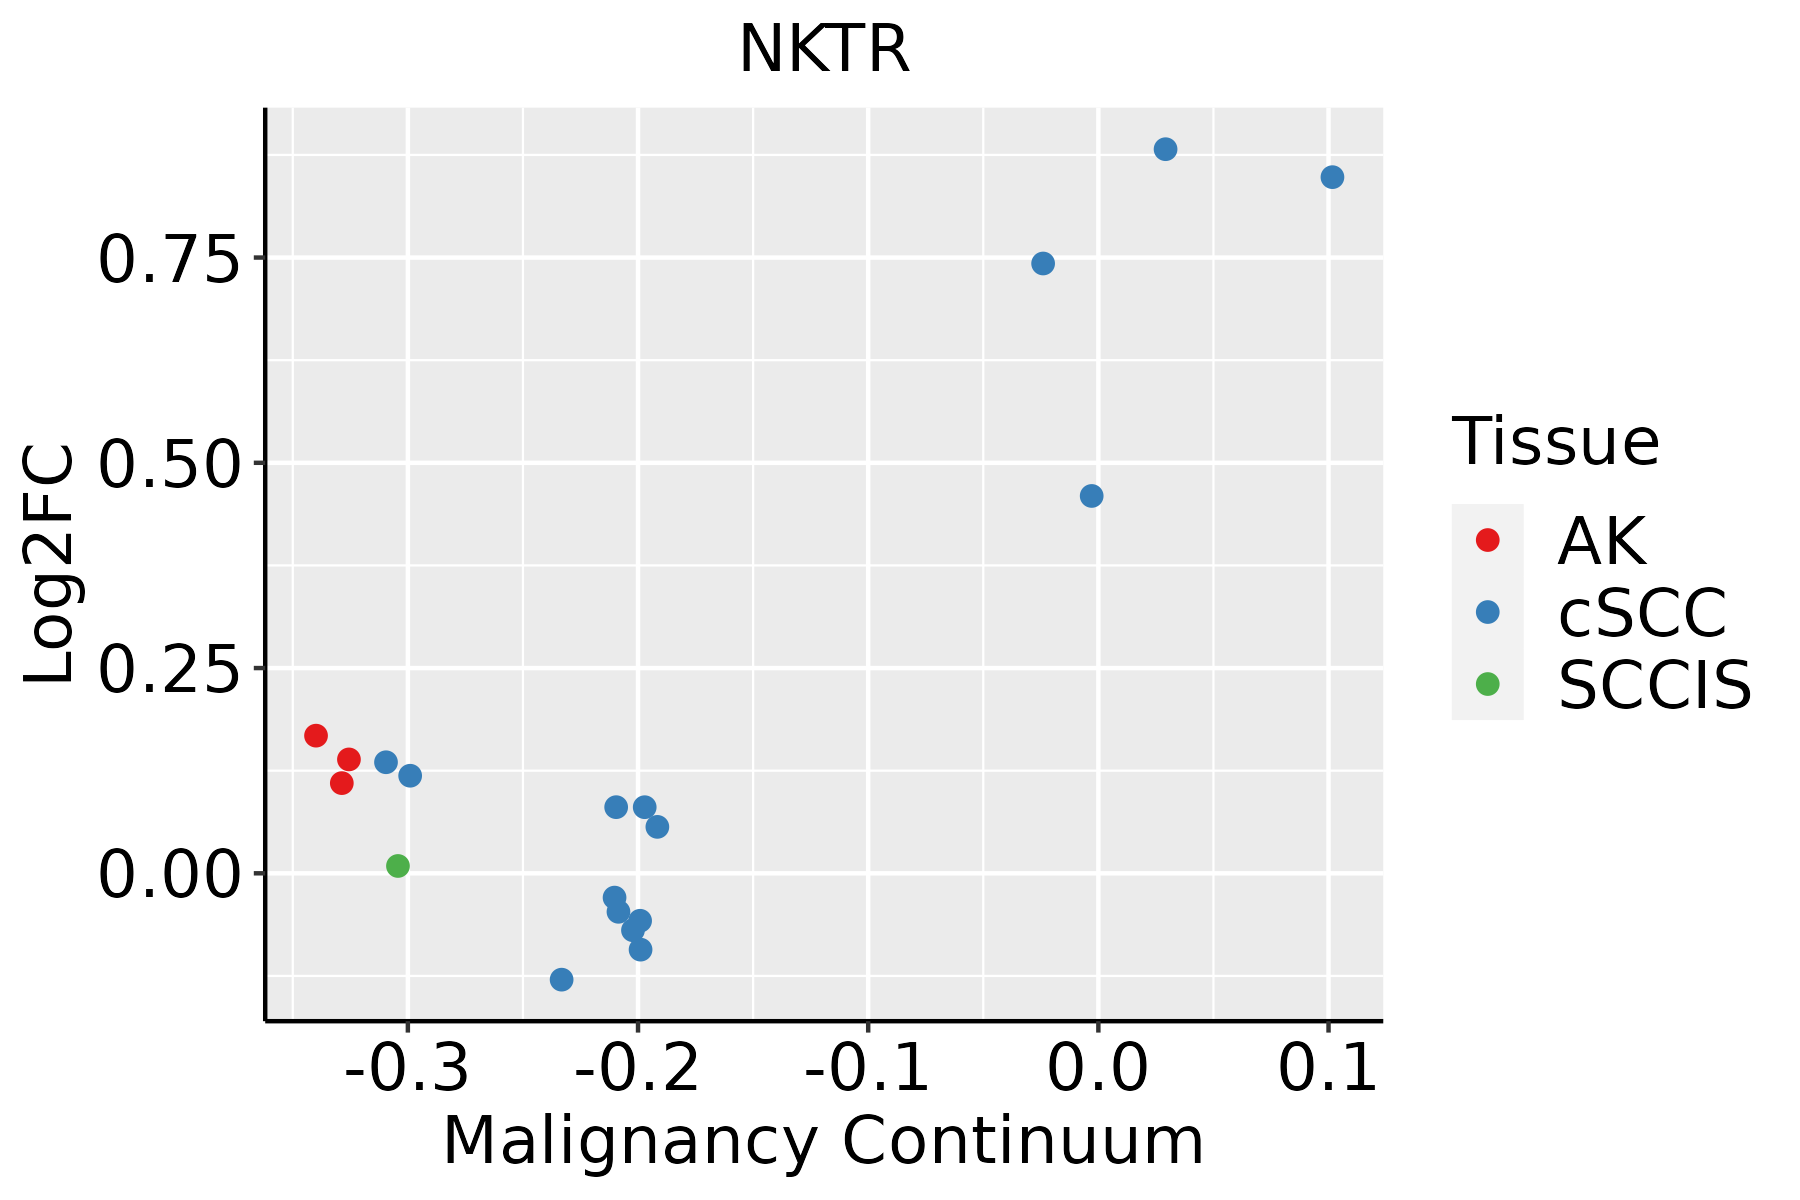
AK: Actinic keratosis
cSCC: Cutaneous squamous cell carcinoma
SCCIS:squamous cell carcinoma in situ
ThyroidThe image shows the transcriptomic changes along malignancy continuum.log2FC in expression of this searched gene in stem-like cells from each diseased tissue sample relative to stem-like cells in normal samples in each tissue plotted against the malignancy continuum. Samples are colored based on if they are from different disease stage.
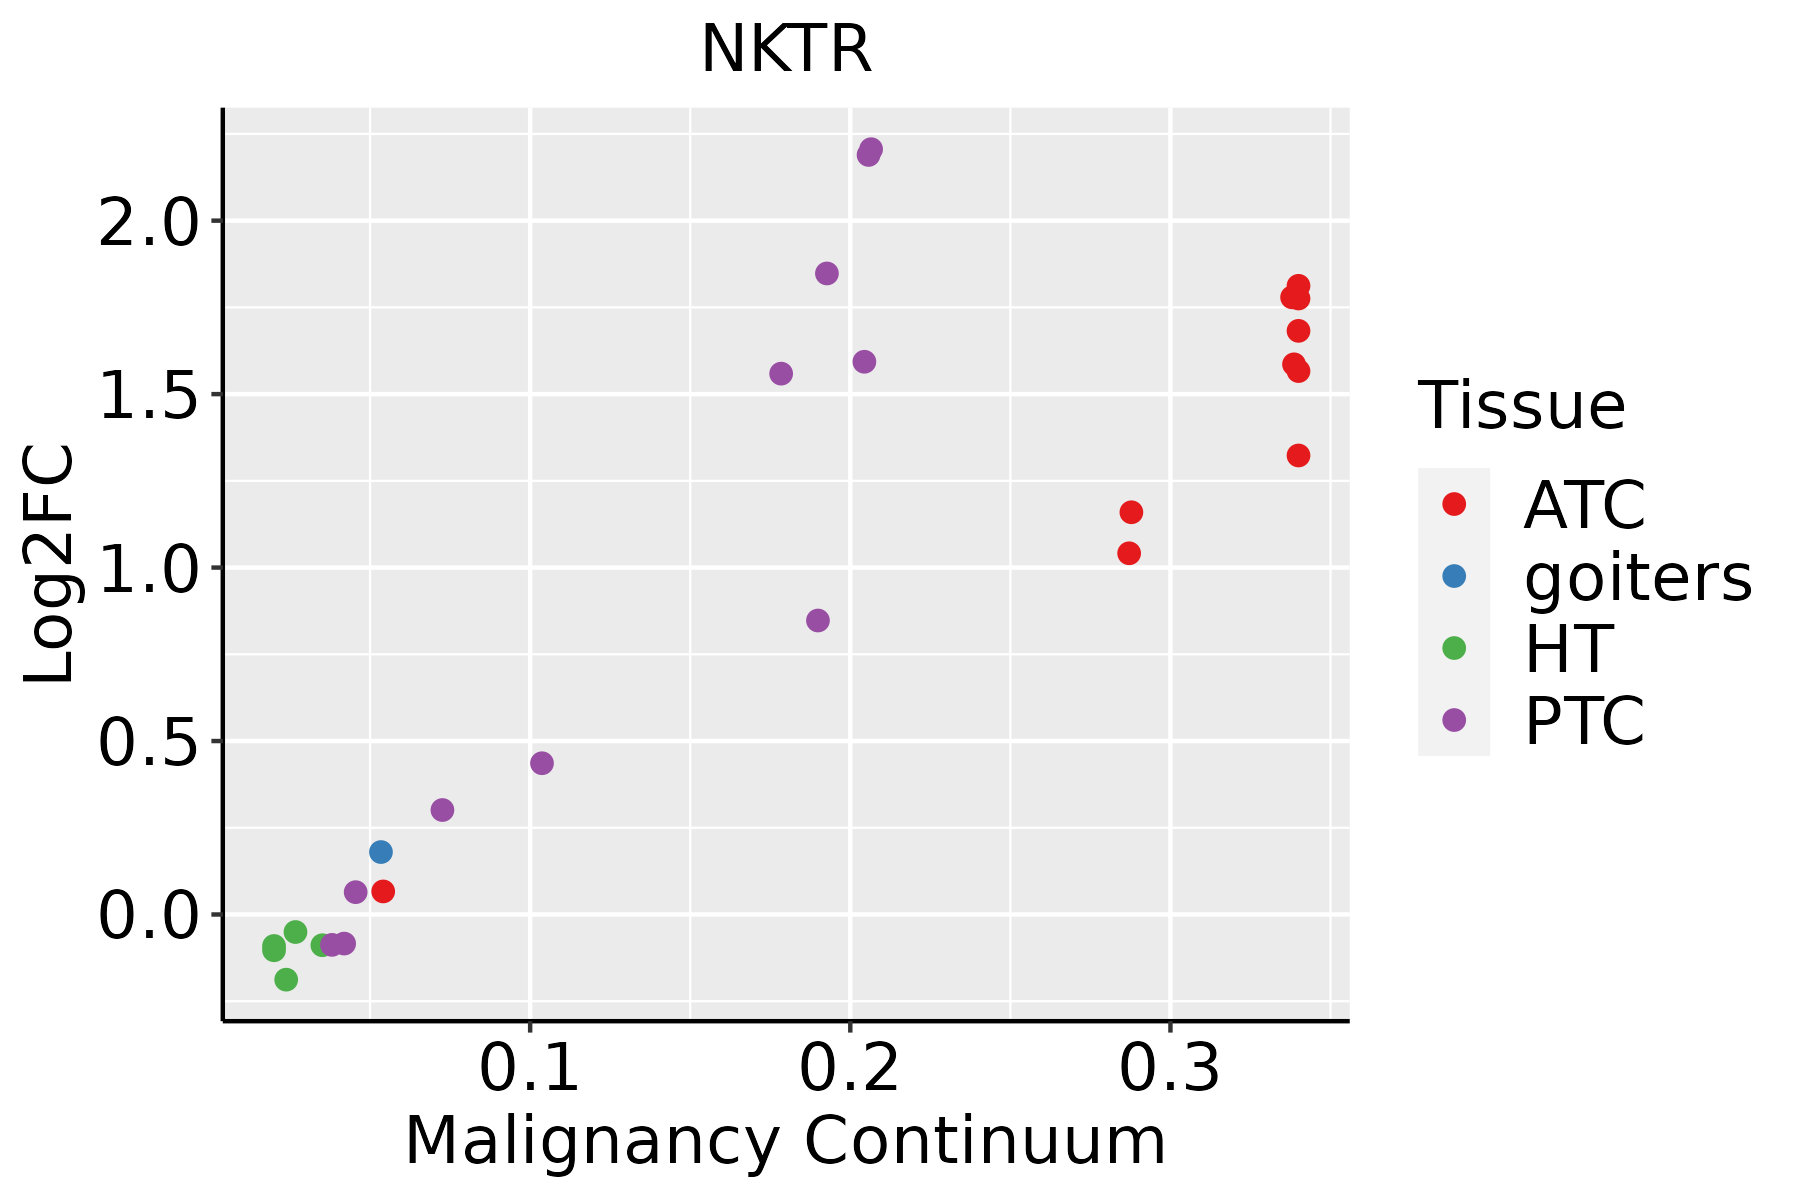
ATC: Anaplastic thyroid cancer
HT: Hashimoto's thyroiditis
PTC: Papillary thyroid cancer
∗log2FC in expression of this searched gene in stem-like cells from each diseased tissue sample relative to stem-like cells in normal samples in each tissue plotted against the malignancy continuum. Samples are colored based on if they are from different disease stage.

Top

Malignant transformation related pathway analysis

check buttonFind out the enriched GO biological processes and KEGG pathways involved in transition from healthy to precancer to cancer
check button Figure of enriched GO biological processes.
TissueDisease StageEnriched GO biological Processes
ColorectumADGO analysis - Figure of enriched GO biological processes: Top 15 enriched GO BP terms are showed in the bar plot of each disease state in each tissue. Each row represents a significant GO biological process which is colored according to the -log10(p.adjust).
ColorectumSERGO analysis - Figure of enriched GO biological processes: Top 15 enriched GO BP terms are showed in the bar plot of each disease state in each tissue. Each row represents a significant GO biological process which is colored according to the -log10(p.adjust).
ColorectumMSSGO analysis - Figure of enriched GO biological processes: Top 15 enriched GO BP terms are showed in the bar plot of each disease state in each tissue. Each row represents a significant GO biological process which is colored according to the -log10(p.adjust).
ColorectumMSI-HGO analysis - Figure of enriched GO biological processes: Top 15 enriched GO BP terms are showed in the bar plot of each disease state in each tissue. Each row represents a significant GO biological process which is colored according to the -log10(p.adjust).
ColorectumFAPGO analysis - Figure of enriched GO biological processes: Top 15 enriched GO BP terms are showed in the bar plot of each disease state in each tissue. Each row represents a significant GO biological process which is colored according to the -log10(p.adjust).
∗Top 15 enriched GO BP terms are showed in the bar plot of each disease state in each tissue. Each row represents a significant GO biological process which is colored according to the -log10(p.adjust).
Page: 1 2 3 4 5 6 7 8 9 

check button Enriched GO biological processes.
GO IDTissueDisease StageDescriptionGene RatioBg Ratiopvaluep.adjustCount
GO:000645713BreastIDCprotein folding47/1434212/187232.31e-113.86e-0947
GO:001820812BreastIDCpeptidyl-proline modification13/143458/187233.59e-045.18e-0313
GO:000645723BreastDCISprotein folding47/1390212/187237.84e-121.53e-0947
GO:001820821BreastDCISpeptidyl-proline modification13/139058/187232.65e-044.03e-0313
GO:0006457ColorectumADprotein folding73/3918212/187233.24e-069.10e-0573
GO:00064571ColorectumSERprotein folding54/2897212/187231.04e-042.18e-0354
GO:00064572ColorectumMSSprotein folding71/3467212/187231.25e-075.91e-0671
GO:00064574ColorectumFAPprotein folding44/2622212/187234.36e-032.98e-0244
GO:000645715EndometriumEECprotein folding63/2168212/187236.82e-131.40e-1063
GO:000041311EndometriumEECprotein peptidyl-prolyl isomerization14/216842/187231.69e-042.10e-0314
GO:001820813EndometriumEECpeptidyl-proline modification17/216858/187232.11e-042.54e-0317
GO:000645720EsophagusHGINprotein folding75/2587212/187231.61e-153.86e-1375
GO:00182089EsophagusHGINpeptidyl-proline modification17/258758/187231.64e-031.82e-0217
GO:00004135EsophagusHGINprotein peptidyl-prolyl isomerization13/258742/187233.32e-033.12e-0213
GO:0006457110EsophagusESCCprotein folding163/8552212/187231.13e-201.74e-18163
GO:001820816EsophagusESCCpeptidyl-proline modification46/855258/187231.59e-072.51e-0646
GO:000041313EsophagusESCCprotein peptidyl-prolyl isomerization32/855242/187235.52e-054.27e-0432
GO:00064577LiverCirrhoticprotein folding114/4634212/187239.23e-202.31e-17114
GO:00182084LiverCirrhoticpeptidyl-proline modification26/463458/187236.65e-045.04e-0326
GO:00004132LiverCirrhoticprotein peptidyl-prolyl isomerization19/463442/187233.00e-031.71e-0219
Page: 1 2 3 

check button Enriched KEGG pathways.
Pathway IDTissueDisease StageDescriptionGene RatioBg Ratiopvaluep.adjustqvalueCount
Page: 1 

Top

Cell-cell communication analysis

check buttonIdentification of potential cell-cell interactions between two cell types and their ligand-receptor pairs for different disease states
LigandReceptorLRpairPathwayTissueDisease Stage
Page: 1 

Top

Single-cell gene regulatory network inference analysis

check buttonFind out the significant the regulons (TFs) and the target genes of each regulon across cell types for different disease states
TFCell TypeTissueDisease StageTarget GeneRSSRegulon Activity
∗The dot plots of a searched regulon are shown for all cell subpopulations in each disease state of each tissue based on the regulon specific score inferred using pySCENIC and by calculating the average expression.
Page: 1 

Top

Somatic mutation of malignant transformation related genes

check buttonAnnotation of somatic variants for genes involved in malignant transformation
Hugo SymbolVariant ClassVariant ClassificationdbSNP RSHGVScHGVSpHGVSp ShortSWISSPROTBIOTYPESIFTPolyPhenTumor Sample BarcodeTissueHistologySexAgeStageTherapy TypesDrugsOutcome
NKTRSNVMissense_Mutationc.2665T>Ap.Ser889Thrp.S889TP30414protein_codingdeleterious_low_confidence(0)probably_damaging(0.985)TCGA-A8-A09M-01Breastbreast invasive carcinomaFemale>=65III/IVChemotherapypaclitaxelCR
NKTRSNVMissense_Mutationc.2900N>Tp.Ser967Leup.S967LP30414protein_codingtolerated_low_confidence(0.3)benign(0)TCGA-AN-A046-01Breastbreast invasive carcinomaFemale>=65I/IIUnknownUnknownSD
NKTRSNVMissense_Mutationrs144598783c.3817N>Tp.Arg1273Trpp.R1273WP30414protein_codingdeleterious_low_confidence(0)probably_damaging(0.999)TCGA-AN-A046-01Breastbreast invasive carcinomaFemale>=65I/IIUnknownUnknownSD
NKTRSNVMissense_Mutationc.196N>Tp.Arg66Cysp.R66CP30414protein_codingdeleterious_low_confidence(0)probably_damaging(1)TCGA-BH-A0B6-01Breastbreast invasive carcinomaFemale<65I/IIUnknownUnknownSD
NKTRSNVMissense_Mutationc.1618N>Gp.Lys540Glup.K540EP30414protein_codingdeleterious_low_confidence(0.05)benign(0.073)TCGA-C8-A27B-01Breastbreast invasive carcinomaFemale<65I/IIChemotherapy5-fluorouracilCR
NKTRSNVMissense_Mutationc.112N>Gp.Asn38Aspp.N38DP30414protein_codingdeleterious_low_confidence(0)probably_damaging(0.999)TCGA-E2-A14O-01Breastbreast invasive carcinomaFemale>=65III/IVHormone TherapyarimidexSD
NKTRSNVMissense_Mutationnovelc.3427G>Cp.Glu1143Glnp.E1143QP30414protein_codingtolerated_low_confidence(0.05)benign(0.288)TCGA-EW-A3E8-01Breastbreast invasive carcinomaFemale<65I/IIHormone TherapyanastrozoleSD
NKTRinsertionIn_Frame_Insnovelc.730_731insTATTATp.Ser244delinsIleLeuCysp.S244delinsILCP30414protein_codingTCGA-A8-A07R-01Breastbreast invasive carcinomaFemale>=65III/IVAncillaryzoledronicSD
NKTRinsertionFrame_Shift_Insnovelc.731_732insCAATTCTTTTTTTTTTTTTp.Ser245AsnfsTer13p.S245Nfs*13P30414protein_codingTCGA-A8-A07R-01Breastbreast invasive carcinomaFemale>=65III/IVAncillaryzoledronicSD
NKTRinsertionFrame_Shift_Insnovelc.3392_3393insCp.Cys1132LeufsTer4p.C1132Lfs*4P30414protein_codingTCGA-AR-A256-01Breastbreast invasive carcinomaFemale<65I/IIChemotherapydoxorubicinPD
Page: 1 2 3 4 5 6 7 8 9 10 11 12 13 14 15 16 

Top

Related drugs of malignant transformation related genes

check buttonIdentification of chemicals and drugs interact with genes involved in malignant transfromation
(DGIdb 4.0)
Entrez IDSymbolCategoryInteraction TypesDrug Claim NameDrug NamePMIDs
Page: 1