
|
|||||
|
 | |
| |
| |
| |
| |
| |
|
Gene: NKG7 |
Gene summary for NKG7 |
| Gene information | Species | Human | Gene symbol | NKG7 | Gene ID | 4818 |
| Gene name | natural killer cell granule protein 7 | |
| Gene Alias | GIG1 | |
| Cytomap | 19q13.41 | |
| Gene Type | protein-coding | GO ID | GO:0000323 | UniProtAcc | Q16617 |
Top |
Malignant transformation analysis |
| Identification of the aberrant gene expression in precancerous and cancerous lesions by comparing the gene expression of stem-like cells in diseased tissues with normal stem cells |
| Entrez ID | Symbol | Replicates | Species | Organ | Tissue | Adj P-value | Log2FC | Malignancy |
| 4818 | NKG7 | LZE4T | Human | Esophagus | ESCC | 3.02e-04 | 8.21e-01 | 0.0811 |
| 4818 | NKG7 | LZE6T | Human | Esophagus | ESCC | 1.01e-18 | 2.02e+00 | 0.0845 |
| 4818 | NKG7 | S43 | Human | Liver | Cirrhotic | 2.72e-16 | -4.93e-01 | -0.0187 |
| 4818 | NKG7 | HCC1_Meng | Human | Liver | HCC | 1.24e-13 | -4.84e-01 | 0.0246 |
| 4818 | NKG7 | HCC2_Meng | Human | Liver | HCC | 5.48e-10 | -4.64e-01 | 0.0107 |
| 4818 | NKG7 | cirrhotic1 | Human | Liver | Cirrhotic | 3.83e-09 | -2.81e-01 | 0.0202 |
| 4818 | NKG7 | cirrhotic2 | Human | Liver | Cirrhotic | 1.39e-31 | 2.07e-01 | 0.0201 |
| 4818 | NKG7 | cirrhotic3 | Human | Liver | Cirrhotic | 1.54e-05 | -3.66e-01 | 0.0215 |
| 4818 | NKG7 | HCC1 | Human | Liver | HCC | 6.03e-03 | -5.06e-01 | 0.5336 |
| 4818 | NKG7 | Pt13.a | Human | Liver | HCC | 8.33e-04 | -3.54e-01 | 0.021 |
| 4818 | NKG7 | Pt13.b | Human | Liver | HCC | 1.61e-09 | -4.80e-01 | 0.0251 |
| 4818 | NKG7 | Pt13.c | Human | Liver | HCC | 1.69e-03 | -4.27e-01 | 0.0076 |
| 4818 | NKG7 | Pt14.d | Human | Liver | HCC | 3.28e-05 | -3.73e-01 | 0.0143 |
| 4818 | NKG7 | S015 | Human | Liver | HCC | 2.72e-04 | -4.74e-01 | 0.2375 |
| 4818 | NKG7 | S016 | Human | Liver | HCC | 5.44e-08 | -4.49e-01 | 0.2243 |
| 4818 | NKG7 | S028 | Human | Liver | HCC | 7.31e-06 | -4.87e-01 | 0.2503 |
| 4818 | NKG7 | S029 | Human | Liver | HCC | 3.00e-02 | -3.89e-01 | 0.2581 |
| 4818 | NKG7 | C21 | Human | Oral cavity | OSCC | 3.44e-39 | 1.45e+00 | 0.2678 |
| 4818 | NKG7 | C30 | Human | Oral cavity | OSCC | 1.37e-09 | 5.15e-01 | 0.3055 |
| 4818 | NKG7 | C38 | Human | Oral cavity | OSCC | 5.68e-14 | 2.34e+00 | 0.172 |
| Page: 1 2 |
| Tissue | Expression Dynamics | Abbreviation |
| Esophagus | 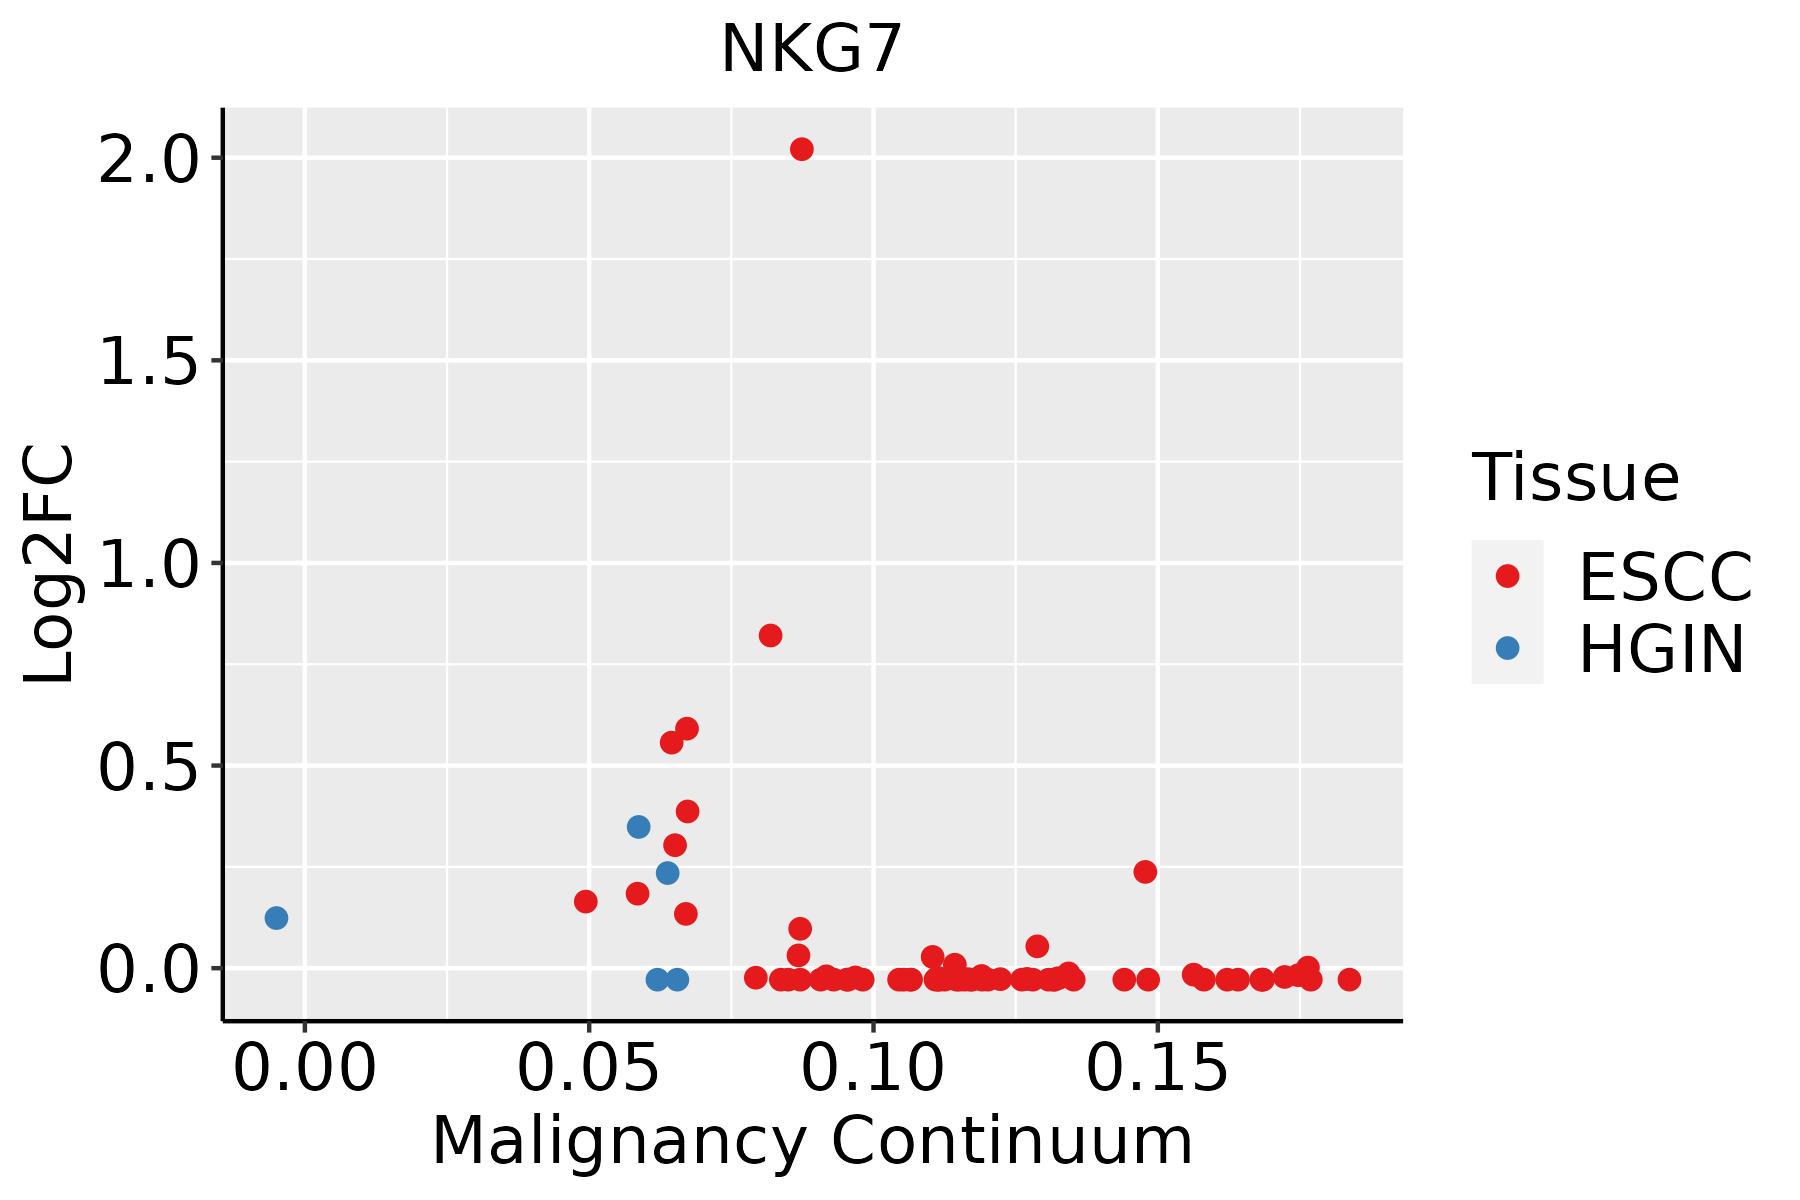 | ESCC: Esophageal squamous cell carcinoma |
| HGIN: High-grade intraepithelial neoplasias | ||
| LGIN: Low-grade intraepithelial neoplasias | ||
| Liver | 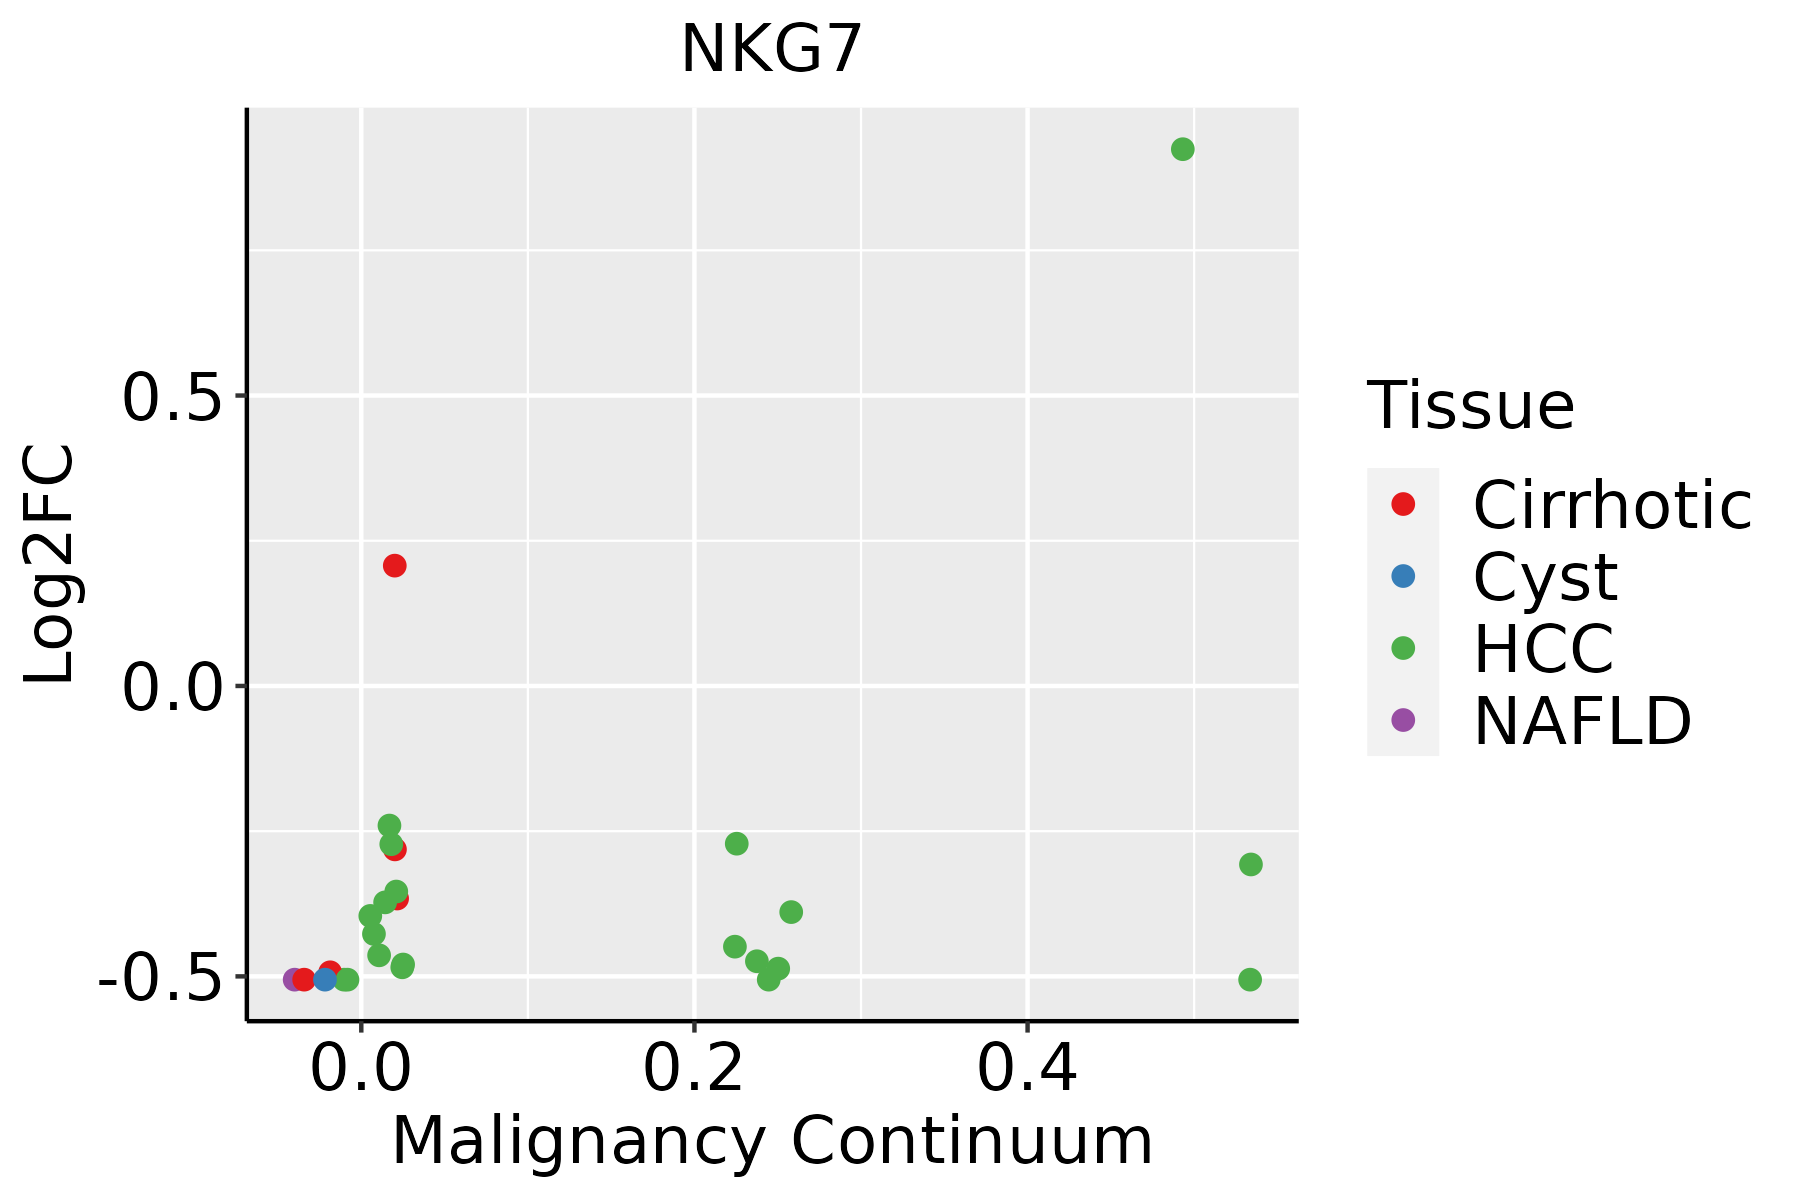 | HCC: Hepatocellular carcinoma |
| NAFLD: Non-alcoholic fatty liver disease | ||
| Oral Cavity | 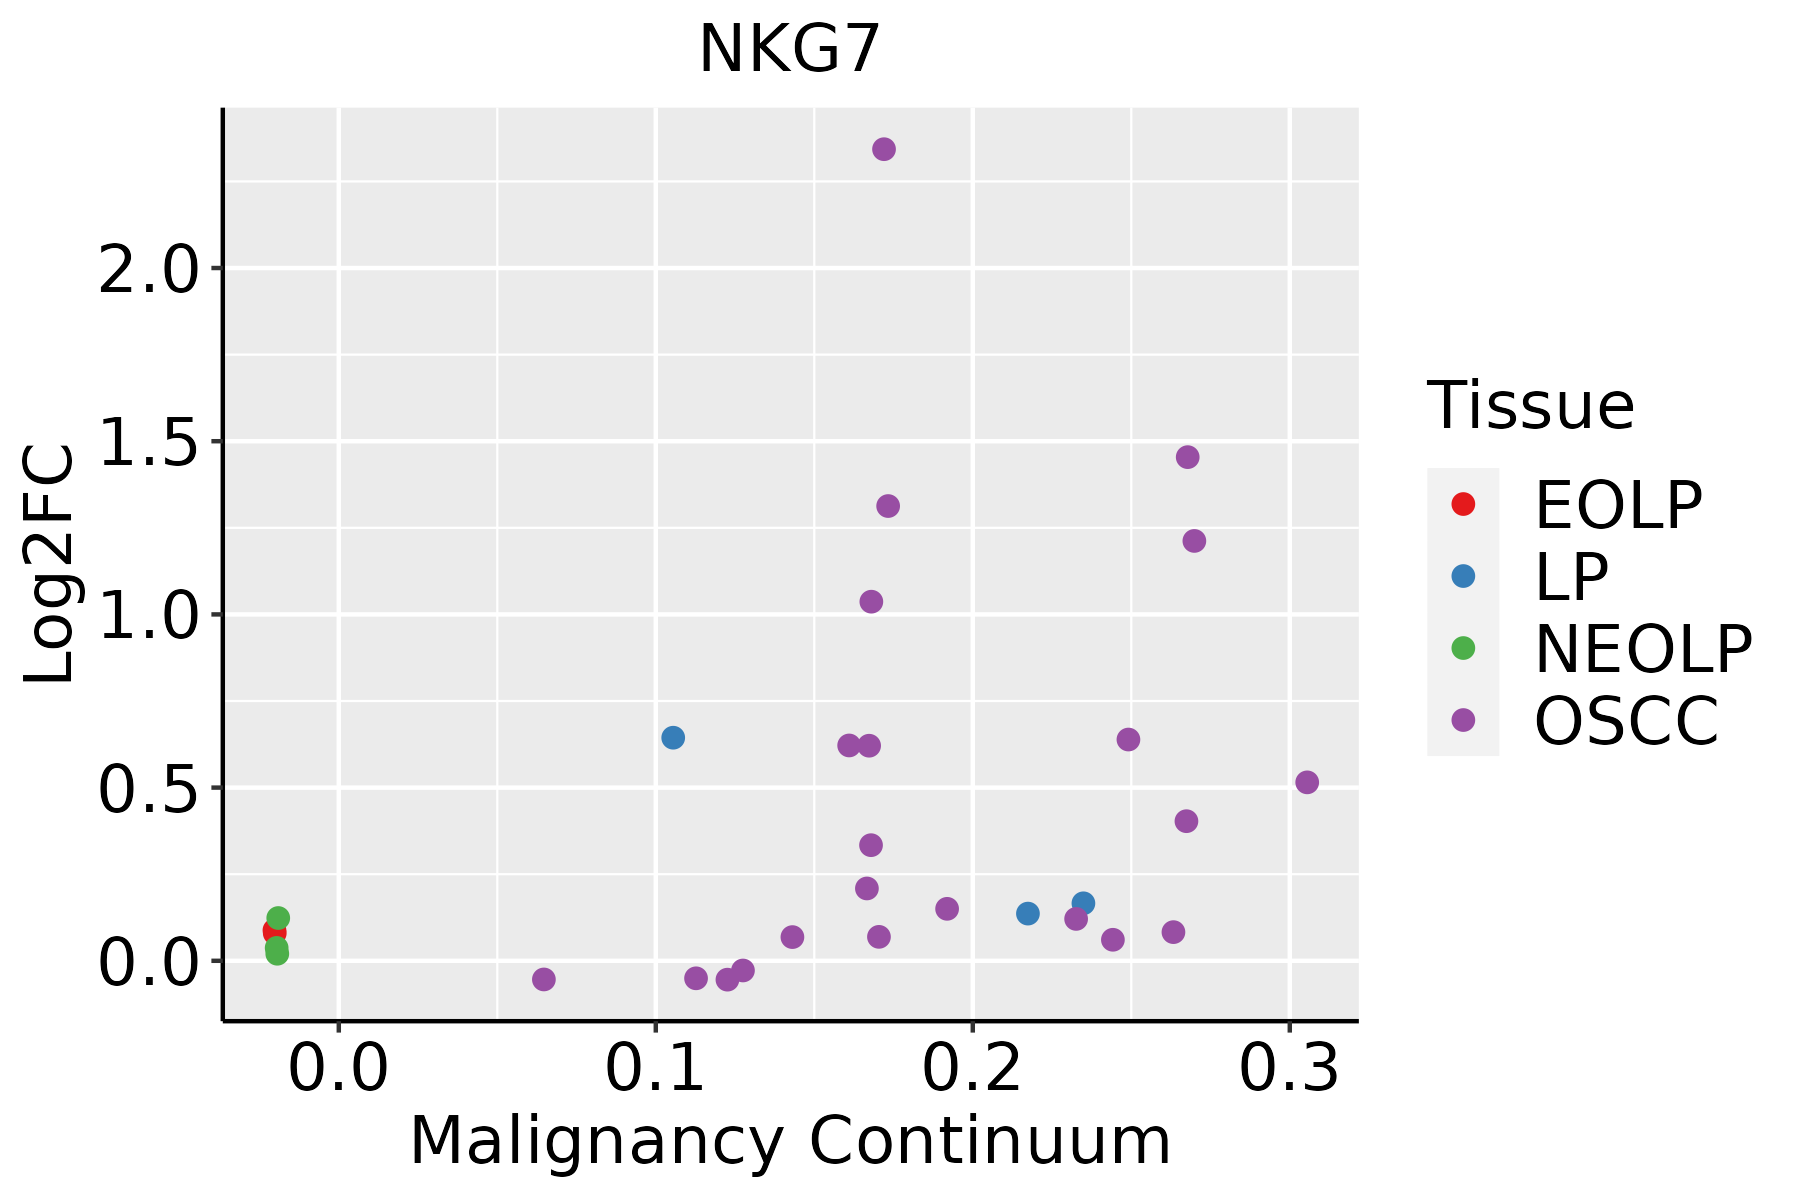 | EOLP: Erosive Oral lichen planus |
| LP: leukoplakia | ||
| NEOLP: Non-erosive oral lichen planus | ||
| OSCC: Oral squamous cell carcinoma | ||
| Thyroid | 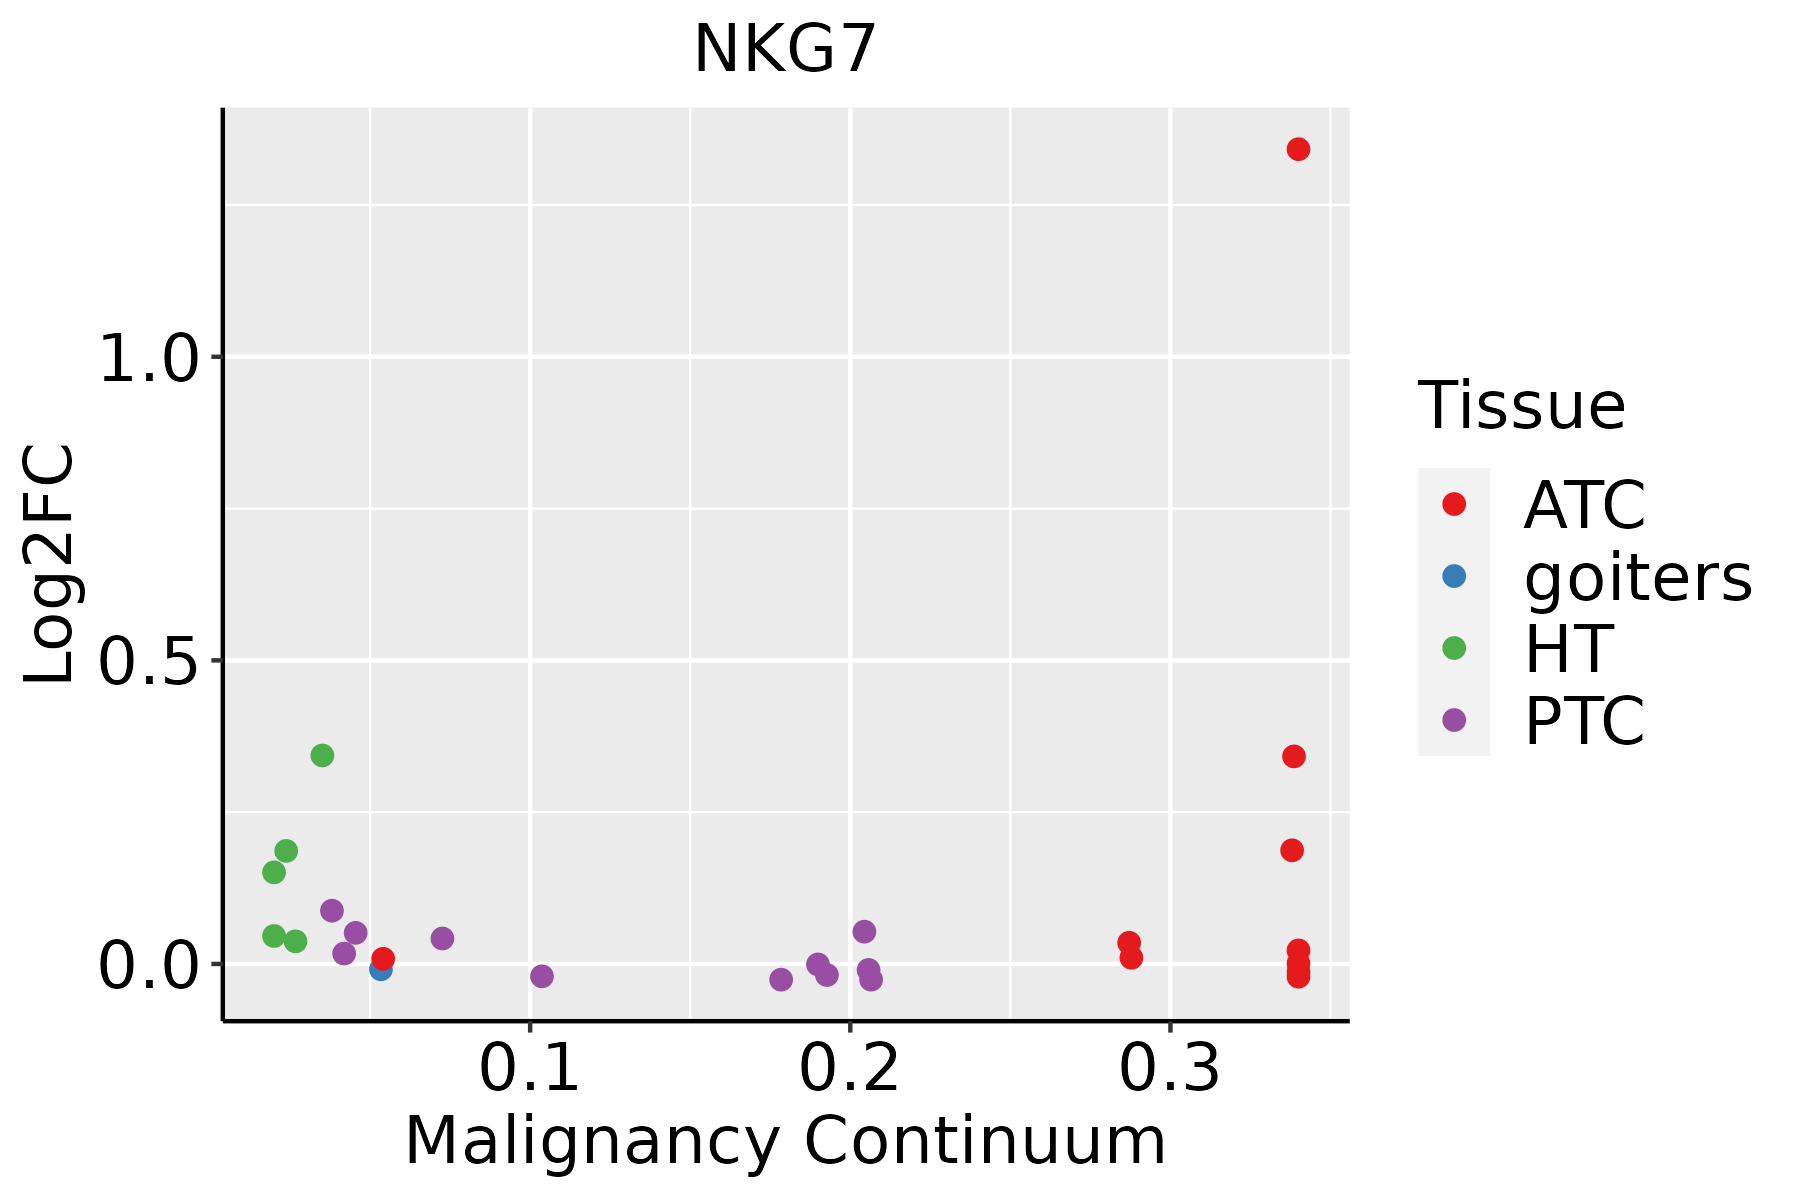 | ATC: Anaplastic thyroid cancer |
| HT: Hashimoto's thyroiditis | ||
| PTC: Papillary thyroid cancer |
| ∗log2FC in expression of this searched gene in stem-like cells from each diseased tissue sample relative to stem-like cells in normal samples in each tissue plotted against the malignancy continuum. Samples are colored based on if they are from different disease stage. |
Top |
Malignant transformation related pathway analysis |
| Find out the enriched GO biological processes and KEGG pathways involved in transition from healthy to precancer to cancer |
| Tissue | Disease Stage | Enriched GO biological Processes |
| Colorectum | AD |  |
| Colorectum | SER |  |
| Colorectum | MSS |  |
| Colorectum | MSI-H |  |
| Colorectum | FAP |  |
| ∗Top 15 enriched GO BP terms are showed in the bar plot of each disease state in each tissue. Each row represents a significant GO biological process which is colored according to the -log10(p.adjust). |
| Page: 1 2 3 4 5 6 7 8 9 |
| GO ID | Tissue | Disease Stage | Description | Gene Ratio | Bg Ratio | pvalue | p.adjust | Count |
| Page: 1 |
| Pathway ID | Tissue | Disease Stage | Description | Gene Ratio | Bg Ratio | pvalue | p.adjust | qvalue | Count |
| Page: 1 |
Top |
Cell-cell communication analysis |
| Identification of potential cell-cell interactions between two cell types and their ligand-receptor pairs for different disease states |
| Ligand | Receptor | LRpair | Pathway | Tissue | Disease Stage |
| Page: 1 |
Top |
Single-cell gene regulatory network inference analysis |
| Find out the significant the regulons (TFs) and the target genes of each regulon across cell types for different disease states |
| TF | Cell Type | Tissue | Disease Stage | Target Gene | RSS | Regulon Activity |
| ∗The dot plots of a searched regulon are shown for all cell subpopulations in each disease state of each tissue based on the regulon specific score inferred using pySCENIC and by calculating the average expression. |
| Page: 1 |
Top |
Somatic mutation of malignant transformation related genes |
| Annotation of somatic variants for genes involved in malignant transformation |
| Hugo Symbol | Variant Class | Variant Classification | dbSNP RS | HGVSc | HGVSp | HGVSp Short | SWISSPROT | BIOTYPE | SIFT | PolyPhen | Tumor Sample Barcode | Tissue | Histology | Sex | Age | Stage | Therapy Types | Drugs | Outcome |
| NKG7 | SNV | Missense_Mutation | novel | c.399C>G | p.Phe133Leu | p.F133L | Q16617 | protein_coding | deleterious(0) | probably_damaging(0.998) | TCGA-VS-A958-01 | Cervix | cervical & endocervical cancer | Female | <65 | I/II | Chemotherapy | cisplatin | CR |
| NKG7 | SNV | Missense_Mutation | rs146383130 | c.346N>T | p.Arg116Trp | p.R116W | Q16617 | protein_coding | deleterious(0.01) | probably_damaging(0.997) | TCGA-AA-3492-01 | Colorectum | colon adenocarcinoma | Female | >=65 | I/II | Unknown | Unknown | SD |
| NKG7 | SNV | Missense_Mutation | novel | c.411G>T | p.Trp137Cys | p.W137C | Q16617 | protein_coding | deleterious(0) | probably_damaging(0.999) | TCGA-AA-A004-01 | Colorectum | colon adenocarcinoma | Male | >=65 | I/II | Unknown | Unknown | SD |
| NKG7 | deletion | Frame_Shift_Del | rs765087839 | c.260delN | p.Pro87GlnfsTer63 | p.P87Qfs*63 | Q16617 | protein_coding | TCGA-AG-3878-01 | Colorectum | rectum adenocarcinoma | Male | <65 | I/II | Unknown | Unknown | SD | ||
| NKG7 | SNV | Missense_Mutation | novel | c.232C>A | p.Leu78Met | p.L78M | Q16617 | protein_coding | tolerated(0.23) | benign(0.377) | TCGA-A5-A0G2-01 | Endometrium | uterine corpus endometrioid carcinoma | Female | <65 | III/IV | Unknown | Unknown | SD |
| NKG7 | SNV | Missense_Mutation | c.299N>T | p.Ala100Val | p.A100V | Q16617 | protein_coding | tolerated(0.21) | benign(0.077) | TCGA-AP-A051-01 | Endometrium | uterine corpus endometrioid carcinoma | Female | >=65 | I/II | Unknown | Unknown | SD | |
| NKG7 | SNV | Missense_Mutation | rs532047087 | c.289G>A | p.Ala97Thr | p.A97T | Q16617 | protein_coding | tolerated(1) | benign(0) | TCGA-AP-A0LM-01 | Endometrium | uterine corpus endometrioid carcinoma | Female | <65 | III/IV | Chemotherapy | cisplatin | SD |
| NKG7 | SNV | Missense_Mutation | c.43N>T | p.Gly15Cys | p.G15C | Q16617 | protein_coding | deleterious(0) | probably_damaging(0.986) | TCGA-B5-A1MX-01 | Endometrium | uterine corpus endometrioid carcinoma | Female | <65 | I/II | Hormone Therapy | megace | SD | |
| NKG7 | SNV | Missense_Mutation | novel | c.328G>A | p.Ala110Thr | p.A110T | Q16617 | protein_coding | tolerated(0.26) | benign(0.031) | TCGA-B5-A3FC-01 | Endometrium | uterine corpus endometrioid carcinoma | Female | <65 | I/II | Unknown | Unknown | SD |
| NKG7 | SNV | Missense_Mutation | rs760395622 | c.476N>A | p.Arg159His | p.R159H | Q16617 | protein_coding | deleterious(0.02) | benign(0.358) | TCGA-EC-A1QX-01 | Endometrium | uterine corpus endometrioid carcinoma | Female | >=65 | I/II | Chemotherapy | cyclophosphamide | PD |
| Page: 1 2 |
Top |
Related drugs of malignant transformation related genes |
| Identification of chemicals and drugs interact with genes involved in malignant transfromation |
| (DGIdb 4.0) |
| Entrez ID | Symbol | Category | Interaction Types | Drug Claim Name | Drug Name | PMIDs |
| Page: 1 |

Copyright 2023-Present -The University of Texas Health Science Center at Houston |