
|
|||||
|
 | |
| |
| |
| |
| |
| |
|
Gene: NKD1 |
Gene summary for NKD1 |
| Gene information | Species | Human | Gene symbol | NKD1 | Gene ID | 85407 |
| Gene name | NKD inhibitor of WNT signaling pathway 1 | |
| Gene Alias | Naked1 | |
| Cytomap | 16q12.1 | |
| Gene Type | protein-coding | GO ID | GO:0001654 | UniProtAcc | Q969G9 |
Top |
Malignant transformation analysis |
| Identification of the aberrant gene expression in precancerous and cancerous lesions by comparing the gene expression of stem-like cells in diseased tissues with normal stem cells |
| Entrez ID | Symbol | Replicates | Species | Organ | Tissue | Adj P-value | Log2FC | Malignancy |
| 85407 | NKD1 | HTA11_3410_2000001011 | Human | Colorectum | AD | 9.19e-04 | 3.91e-01 | 0.0155 |
| 85407 | NKD1 | HTA11_2951_2000001011 | Human | Colorectum | AD | 3.20e-02 | 7.72e-01 | 0.0216 |
| 85407 | NKD1 | HTA11_696_2000001011 | Human | Colorectum | AD | 6.36e-15 | 9.31e-01 | -0.1464 |
| 85407 | NKD1 | HTA11_866_3004761011 | Human | Colorectum | AD | 1.16e-28 | 1.22e+00 | 0.096 |
| 85407 | NKD1 | HTA11_9408_2000001011 | Human | Colorectum | AD | 1.90e-07 | 8.45e-01 | 0.0451 |
| 85407 | NKD1 | HTA11_10711_2000001011 | Human | Colorectum | AD | 3.30e-25 | 1.48e+00 | 0.0338 |
| 85407 | NKD1 | HTA11_7696_3000711011 | Human | Colorectum | AD | 1.87e-28 | 1.00e+00 | 0.0674 |
| 85407 | NKD1 | HTA11_11156_2000001011 | Human | Colorectum | AD | 5.68e-04 | 1.29e+00 | 0.0397 |
| 85407 | NKD1 | HTA11_6818_2000001021 | Human | Colorectum | AD | 7.34e-18 | 9.48e-01 | 0.0588 |
| 85407 | NKD1 | HTA11_99999970781_79442 | Human | Colorectum | MSS | 9.15e-16 | 5.04e-01 | 0.294 |
| 85407 | NKD1 | HTA11_99999965062_69753 | Human | Colorectum | MSI-H | 1.95e-02 | 3.88e-01 | 0.3487 |
| 85407 | NKD1 | HTA11_99999965104_69814 | Human | Colorectum | MSS | 4.70e-10 | 8.07e-01 | 0.281 |
| 85407 | NKD1 | HTA11_99999971662_82457 | Human | Colorectum | MSS | 1.07e-71 | 1.92e+00 | 0.3859 |
| 85407 | NKD1 | HTA11_99999973899_84307 | Human | Colorectum | MSS | 3.12e-14 | 7.44e-01 | 0.2585 |
| 85407 | NKD1 | HTA11_99999974143_84620 | Human | Colorectum | MSS | 1.63e-109 | 2.33e+00 | 0.3005 |
| 85407 | NKD1 | F007 | Human | Colorectum | FAP | 8.40e-30 | 1.32e+00 | 0.1176 |
| 85407 | NKD1 | A002-C-010 | Human | Colorectum | FAP | 5.26e-26 | 8.72e-01 | 0.242 |
| 85407 | NKD1 | A001-C-207 | Human | Colorectum | FAP | 2.31e-71 | 1.75e+00 | 0.1278 |
| 85407 | NKD1 | A015-C-203 | Human | Colorectum | FAP | 1.28e-64 | 1.53e+00 | -0.1294 |
| 85407 | NKD1 | A015-C-204 | Human | Colorectum | FAP | 1.54e-08 | 6.25e-01 | -0.0228 |
| Page: 1 2 3 |
| Tissue | Expression Dynamics | Abbreviation |
| Colorectum (GSE201348) |  | FAP: Familial adenomatous polyposis |
| CRC: Colorectal cancer | ||
| Colorectum (HTA11) |  | AD: Adenomas |
| SER: Sessile serrated lesions | ||
| MSI-H: Microsatellite-high colorectal cancer | ||
| MSS: Microsatellite stable colorectal cancer | ||
| Liver | 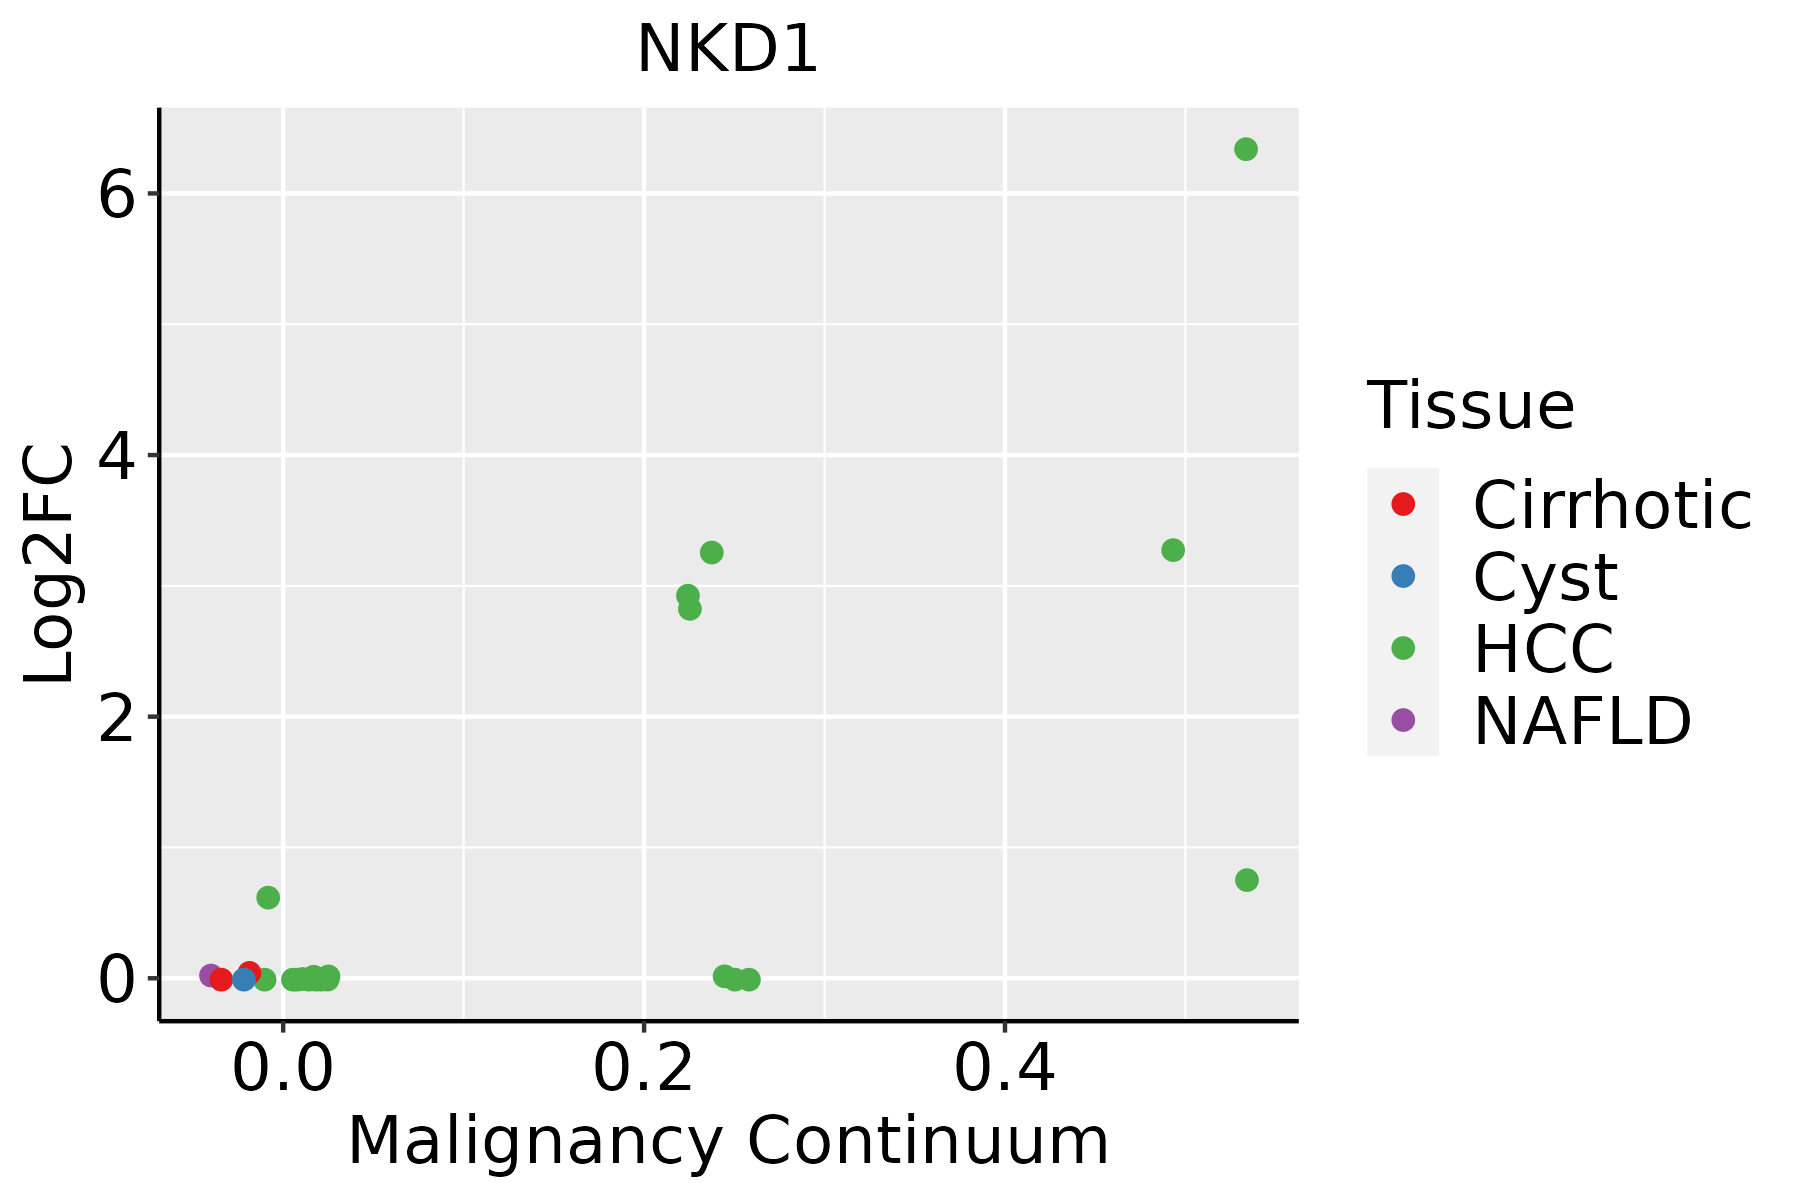 | HCC: Hepatocellular carcinoma |
| NAFLD: Non-alcoholic fatty liver disease |
| ∗log2FC in expression of this searched gene in stem-like cells from each diseased tissue sample relative to stem-like cells in normal samples in each tissue plotted against the malignancy continuum. Samples are colored based on if they are from different disease stage. |
Top |
Malignant transformation related pathway analysis |
| Find out the enriched GO biological processes and KEGG pathways involved in transition from healthy to precancer to cancer |
| Tissue | Disease Stage | Enriched GO biological Processes |
| Colorectum | AD |  |
| Colorectum | SER |  |
| Colorectum | MSS |  |
| Colorectum | MSI-H |  |
| Colorectum | FAP |  |
| ∗Top 15 enriched GO BP terms are showed in the bar plot of each disease state in each tissue. Each row represents a significant GO biological process which is colored according to the -log10(p.adjust). |
| Page: 1 2 3 4 5 6 7 8 9 |
| GO ID | Tissue | Disease Stage | Description | Gene Ratio | Bg Ratio | pvalue | p.adjust | Count |
| GO:0042176 | Colorectum | AD | regulation of protein catabolic process | 160/3918 | 391/18723 | 1.06e-19 | 7.34e-17 | 160 |
| GO:0009896 | Colorectum | AD | positive regulation of catabolic process | 180/3918 | 492/18723 | 4.33e-16 | 1.94e-13 | 180 |
| GO:0045732 | Colorectum | AD | positive regulation of protein catabolic process | 92/3918 | 231/18723 | 3.85e-11 | 4.47e-09 | 92 |
| GO:0030111 | Colorectum | AD | regulation of Wnt signaling pathway | 102/3918 | 328/18723 | 8.51e-06 | 2.03e-04 | 102 |
| GO:0016055 | Colorectum | AD | Wnt signaling pathway | 130/3918 | 444/18723 | 1.60e-05 | 3.37e-04 | 130 |
| GO:0198738 | Colorectum | AD | cell-cell signaling by wnt | 130/3918 | 446/18723 | 2.02e-05 | 4.10e-04 | 130 |
| GO:0060070 | Colorectum | AD | canonical Wnt signaling pathway | 90/3918 | 303/18723 | 1.76e-04 | 2.38e-03 | 90 |
| GO:0060828 | Colorectum | AD | regulation of canonical Wnt signaling pathway | 77/3918 | 253/18723 | 2.19e-04 | 2.87e-03 | 77 |
| GO:0030177 | Colorectum | AD | positive regulation of Wnt signaling pathway | 45/3918 | 140/18723 | 1.23e-03 | 1.09e-02 | 45 |
| GO:0048638 | Colorectum | AD | regulation of developmental growth | 92/3918 | 330/18723 | 1.48e-03 | 1.25e-02 | 92 |
| GO:0045926 | Colorectum | AD | negative regulation of growth | 70/3918 | 249/18723 | 4.07e-03 | 2.83e-02 | 70 |
| GO:0001738 | Colorectum | AD | morphogenesis of a polarized epithelium | 31/3918 | 94/18723 | 4.30e-03 | 2.95e-02 | 31 |
| GO:0060560 | Colorectum | AD | developmental growth involved in morphogenesis | 66/3918 | 234/18723 | 4.75e-03 | 3.22e-02 | 66 |
| GO:2000052 | Colorectum | AD | positive regulation of non-canonical Wnt signaling pathway | 8/3918 | 15/18723 | 5.67e-03 | 3.64e-02 | 8 |
| GO:00421762 | Colorectum | MSS | regulation of protein catabolic process | 145/3467 | 391/18723 | 2.03e-18 | 1.17e-15 | 145 |
| GO:00098962 | Colorectum | MSS | positive regulation of catabolic process | 163/3467 | 492/18723 | 3.10e-15 | 9.22e-13 | 163 |
| GO:00457322 | Colorectum | MSS | positive regulation of protein catabolic process | 85/3467 | 231/18723 | 3.66e-11 | 4.57e-09 | 85 |
| GO:00301112 | Colorectum | MSS | regulation of Wnt signaling pathway | 98/3467 | 328/18723 | 3.37e-07 | 1.36e-05 | 98 |
| GO:00160552 | Colorectum | MSS | Wnt signaling pathway | 124/3467 | 444/18723 | 6.06e-07 | 2.26e-05 | 124 |
| GO:01987382 | Colorectum | MSS | cell-cell signaling by wnt | 124/3467 | 446/18723 | 7.83e-07 | 2.77e-05 | 124 |
| Page: 1 2 3 4 |
| Pathway ID | Tissue | Disease Stage | Description | Gene Ratio | Bg Ratio | pvalue | p.adjust | qvalue | Count |
| hsa04310 | Colorectum | AD | Wnt signaling pathway | 56/2092 | 171/8465 | 1.03e-02 | 3.93e-02 | 2.51e-02 | 56 |
| hsa043101 | Colorectum | AD | Wnt signaling pathway | 56/2092 | 171/8465 | 1.03e-02 | 3.93e-02 | 2.51e-02 | 56 |
| hsa043102 | Colorectum | MSS | Wnt signaling pathway | 53/1875 | 171/8465 | 4.24e-03 | 1.86e-02 | 1.14e-02 | 53 |
| hsa04390 | Colorectum | MSS | Hippo signaling pathway | 48/1875 | 157/8465 | 8.32e-03 | 3.10e-02 | 1.90e-02 | 48 |
| hsa043103 | Colorectum | MSS | Wnt signaling pathway | 53/1875 | 171/8465 | 4.24e-03 | 1.86e-02 | 1.14e-02 | 53 |
| hsa043901 | Colorectum | MSS | Hippo signaling pathway | 48/1875 | 157/8465 | 8.32e-03 | 3.10e-02 | 1.90e-02 | 48 |
| hsa043104 | Colorectum | FAP | Wnt signaling pathway | 46/1404 | 171/8465 | 3.94e-04 | 3.06e-03 | 1.86e-03 | 46 |
| hsa043902 | Colorectum | FAP | Hippo signaling pathway | 41/1404 | 157/8465 | 1.49e-03 | 7.91e-03 | 4.81e-03 | 41 |
| hsa043105 | Colorectum | FAP | Wnt signaling pathway | 46/1404 | 171/8465 | 3.94e-04 | 3.06e-03 | 1.86e-03 | 46 |
| hsa043903 | Colorectum | FAP | Hippo signaling pathway | 41/1404 | 157/8465 | 1.49e-03 | 7.91e-03 | 4.81e-03 | 41 |
| hsa043106 | Colorectum | CRC | Wnt signaling pathway | 40/1091 | 171/8465 | 1.01e-04 | 1.57e-03 | 1.07e-03 | 40 |
| hsa043904 | Colorectum | CRC | Hippo signaling pathway | 32/1091 | 157/8465 | 5.17e-03 | 2.72e-02 | 1.84e-02 | 32 |
| hsa043107 | Colorectum | CRC | Wnt signaling pathway | 40/1091 | 171/8465 | 1.01e-04 | 1.57e-03 | 1.07e-03 | 40 |
| hsa043905 | Colorectum | CRC | Hippo signaling pathway | 32/1091 | 157/8465 | 5.17e-03 | 2.72e-02 | 1.84e-02 | 32 |
| Page: 1 |
Top |
Cell-cell communication analysis |
| Identification of potential cell-cell interactions between two cell types and their ligand-receptor pairs for different disease states |
| Ligand | Receptor | LRpair | Pathway | Tissue | Disease Stage |
| Page: 1 |
Top |
Single-cell gene regulatory network inference analysis |
| Find out the significant the regulons (TFs) and the target genes of each regulon across cell types for different disease states |
| TF | Cell Type | Tissue | Disease Stage | Target Gene | RSS | Regulon Activity |
| ∗The dot plots of a searched regulon are shown for all cell subpopulations in each disease state of each tissue based on the regulon specific score inferred using pySCENIC and by calculating the average expression. |
| Page: 1 |
Top |
Somatic mutation of malignant transformation related genes |
| Annotation of somatic variants for genes involved in malignant transformation |
| Hugo Symbol | Variant Class | Variant Classification | dbSNP RS | HGVSc | HGVSp | HGVSp Short | SWISSPROT | BIOTYPE | SIFT | PolyPhen | Tumor Sample Barcode | Tissue | Histology | Sex | Age | Stage | Therapy Types | Drugs | Outcome |
| NKD1 | SNV | Missense_Mutation | c.668N>T | p.Trp223Leu | p.W223L | Q969G9 | protein_coding | tolerated(0.09) | benign(0) | TCGA-AN-A0AT-01 | Breast | breast invasive carcinoma | Female | <65 | I/II | Unknown | Unknown | SD | |
| NKD1 | SNV | Missense_Mutation | novel | c.695N>A | p.Arg232Lys | p.R232K | Q969G9 | protein_coding | deleterious(0) | benign(0.343) | TCGA-AN-A0XU-01 | Breast | breast invasive carcinoma | Female | <65 | I/II | Unknown | Unknown | SD |
| NKD1 | SNV | Missense_Mutation | c.975N>G | p.Ile325Met | p.I325M | Q969G9 | protein_coding | tolerated(0.22) | benign(0.142) | TCGA-E9-A1NE-01 | Breast | breast invasive carcinoma | Female | <65 | I/II | Chemotherapy | doxorubicin | CR | |
| NKD1 | insertion | Frame_Shift_Ins | rs772439983 | c.855_856insC | p.Arg288ProfsTer12 | p.R288Pfs*12 | Q969G9 | protein_coding | TCGA-A8-A06U-01 | Breast | breast invasive carcinoma | Female | >=65 | I/II | Unknown | Unknown | SD | ||
| NKD1 | SNV | Missense_Mutation | novel | c.451G>A | p.Val151Ile | p.V151I | Q969G9 | protein_coding | deleterious(0.05) | probably_damaging(0.994) | TCGA-5M-AAT6-01 | Colorectum | colon adenocarcinoma | Female | <65 | III/IV | Unknown | Unknown | PD |
| NKD1 | SNV | Missense_Mutation | rs374394871 | c.1120N>A | p.Ala374Thr | p.A374T | Q969G9 | protein_coding | tolerated(0.25) | benign(0.001) | TCGA-A6-4105-01 | Colorectum | colon adenocarcinoma | Male | >=65 | I/II | Unknown | Unknown | PD |
| NKD1 | SNV | Missense_Mutation | c.79G>A | p.Ala27Thr | p.A27T | Q969G9 | protein_coding | deleterious(0.01) | probably_damaging(0.99) | TCGA-AA-3710-01 | Colorectum | colon adenocarcinoma | Female | >=65 | I/II | Unknown | Unknown | SD | |
| NKD1 | SNV | Missense_Mutation | novel | c.310N>G | p.Lys104Glu | p.K104E | Q969G9 | protein_coding | tolerated(0.4) | benign(0.014) | TCGA-AD-6964-01 | Colorectum | colon adenocarcinoma | Male | <65 | III/IV | Chemotherapy | folfox | PD |
| NKD1 | SNV | Missense_Mutation | c.500N>G | p.Val167Gly | p.V167G | Q969G9 | protein_coding | deleterious(0) | possibly_damaging(0.836) | TCGA-EI-6506-01 | Colorectum | rectum adenocarcinoma | Female | >=65 | I/II | Unknown | Unknown | SD | |
| NKD1 | SNV | Missense_Mutation | rs757689418 | c.686N>T | p.Ala229Val | p.A229V | Q969G9 | protein_coding | deleterious(0.01) | possibly_damaging(0.889) | TCGA-A5-A2K3-01 | Endometrium | uterine corpus endometrioid carcinoma | Female | >=65 | I/II | Chemotherapy | carboplatin | SD |
| Page: 1 2 3 4 5 |
Top |
Related drugs of malignant transformation related genes |
| Identification of chemicals and drugs interact with genes involved in malignant transfromation |
| (DGIdb 4.0) |
| Entrez ID | Symbol | Category | Interaction Types | Drug Claim Name | Drug Name | PMIDs |
| Page: 1 |

Copyright 2023-Present -The University of Texas Health Science Center at Houston |