Schematic overview of the cellular and molecular mechanisms involved in the cancer progression, including the proposed cellular and molecular mechanisms in cancer cells trajectory. AT1: alveolar type 1 cells; AT2: alveolar type 2 cells; AAH: atypical adenomatous hyperplasia; AIS: adenocarcinoma in situ; MIA: minimally invasive adenocarcinoma; IA: invasive adenocarcinoma; EMT: epithelial-mesenchymal transition

Home

Download

Statistics

Help

Contact

Center for Computational Systems Medicine
leaf

Gene summary

leaf

Malignant transformation analysis

leaf

Malignant transformation related pathway analysis

leaf

Cell-cell communication analysis

leaf

Single-cell gene regulatory network inference analysis

leaf

Somatic mutation of malignant transformation related genes

leaf

Related drugs of malignant transformation related genes

Gene: NKAP

Gene summary for NKAP

check button Gene summary.

Gene informationSpeciesHuman
Gene symbol

NKAP

Gene ID

79576

Gene nameNFKB activating protein
Gene AliasMRXSHD
CytomapXq24
Gene Typeprotein-coding
GO ID

GO:0000122

UniProtAcc

Q8N5F7


Top

Malignant transformation analysis

check button Identification of the aberrant gene expression in precancerous and cancerous lesions by comparing the gene expression of stem-like cells in diseased tissues with normal stem cells
check button Malignant transformation involving gene list.
Entrez IDSymbolReplicatesSpeciesOrganTissueAdj P-valueLog2FCMalignancy
79576NKAPLZE2THumanEsophagusESCC3.10e-022.57e-010.082
79576NKAPLZE4THumanEsophagusESCC2.39e-123.93e-010.0811
79576NKAPLZE5THumanEsophagusESCC6.37e-043.09e-010.0514
79576NKAPLZE7THumanEsophagusESCC1.72e-167.74e-010.0667
79576NKAPLZE8THumanEsophagusESCC3.36e-081.49e-010.067
79576NKAPLZE20THumanEsophagusESCC1.46e-032.46e-010.0662
79576NKAPLZE24THumanEsophagusESCC1.82e-287.18e-010.0596
79576NKAPLZE21THumanEsophagusESCC2.08e-084.42e-010.0655
79576NKAPLZE6THumanEsophagusESCC1.13e-053.05e-010.0845
79576NKAPP1T-EHumanEsophagusESCC3.99e-136.70e-010.0875
79576NKAPP2T-EHumanEsophagusESCC1.22e-528.37e-010.1177
79576NKAPP4T-EHumanEsophagusESCC2.11e-317.44e-010.1323
79576NKAPP5T-EHumanEsophagusESCC5.97e-163.19e-010.1327
79576NKAPP8T-EHumanEsophagusESCC1.07e-225.29e-010.0889
79576NKAPP9T-EHumanEsophagusESCC6.62e-266.46e-010.1131
79576NKAPP10T-EHumanEsophagusESCC3.23e-447.86e-010.116
79576NKAPP11T-EHumanEsophagusESCC3.02e-216.41e-010.1426
79576NKAPP12T-EHumanEsophagusESCC1.40e-204.52e-010.1122
79576NKAPP15T-EHumanEsophagusESCC3.84e-194.16e-010.1149
79576NKAPP16T-EHumanEsophagusESCC1.79e-233.59e-010.1153
Page: 1 2 3 4 5 6 7 

check button Transcriptomic changes along malignancy continuum.
TissueExpression DynamicsAbbreviation
EsophagusThe image shows the transcriptomic changes along malignancy continuum.log2FC in expression of this searched gene in stem-like cells from each diseased tissue sample relative to stem-like cells in normal samples in each tissue plotted against the malignancy continuum. Samples are colored based on if they are from different disease stage.
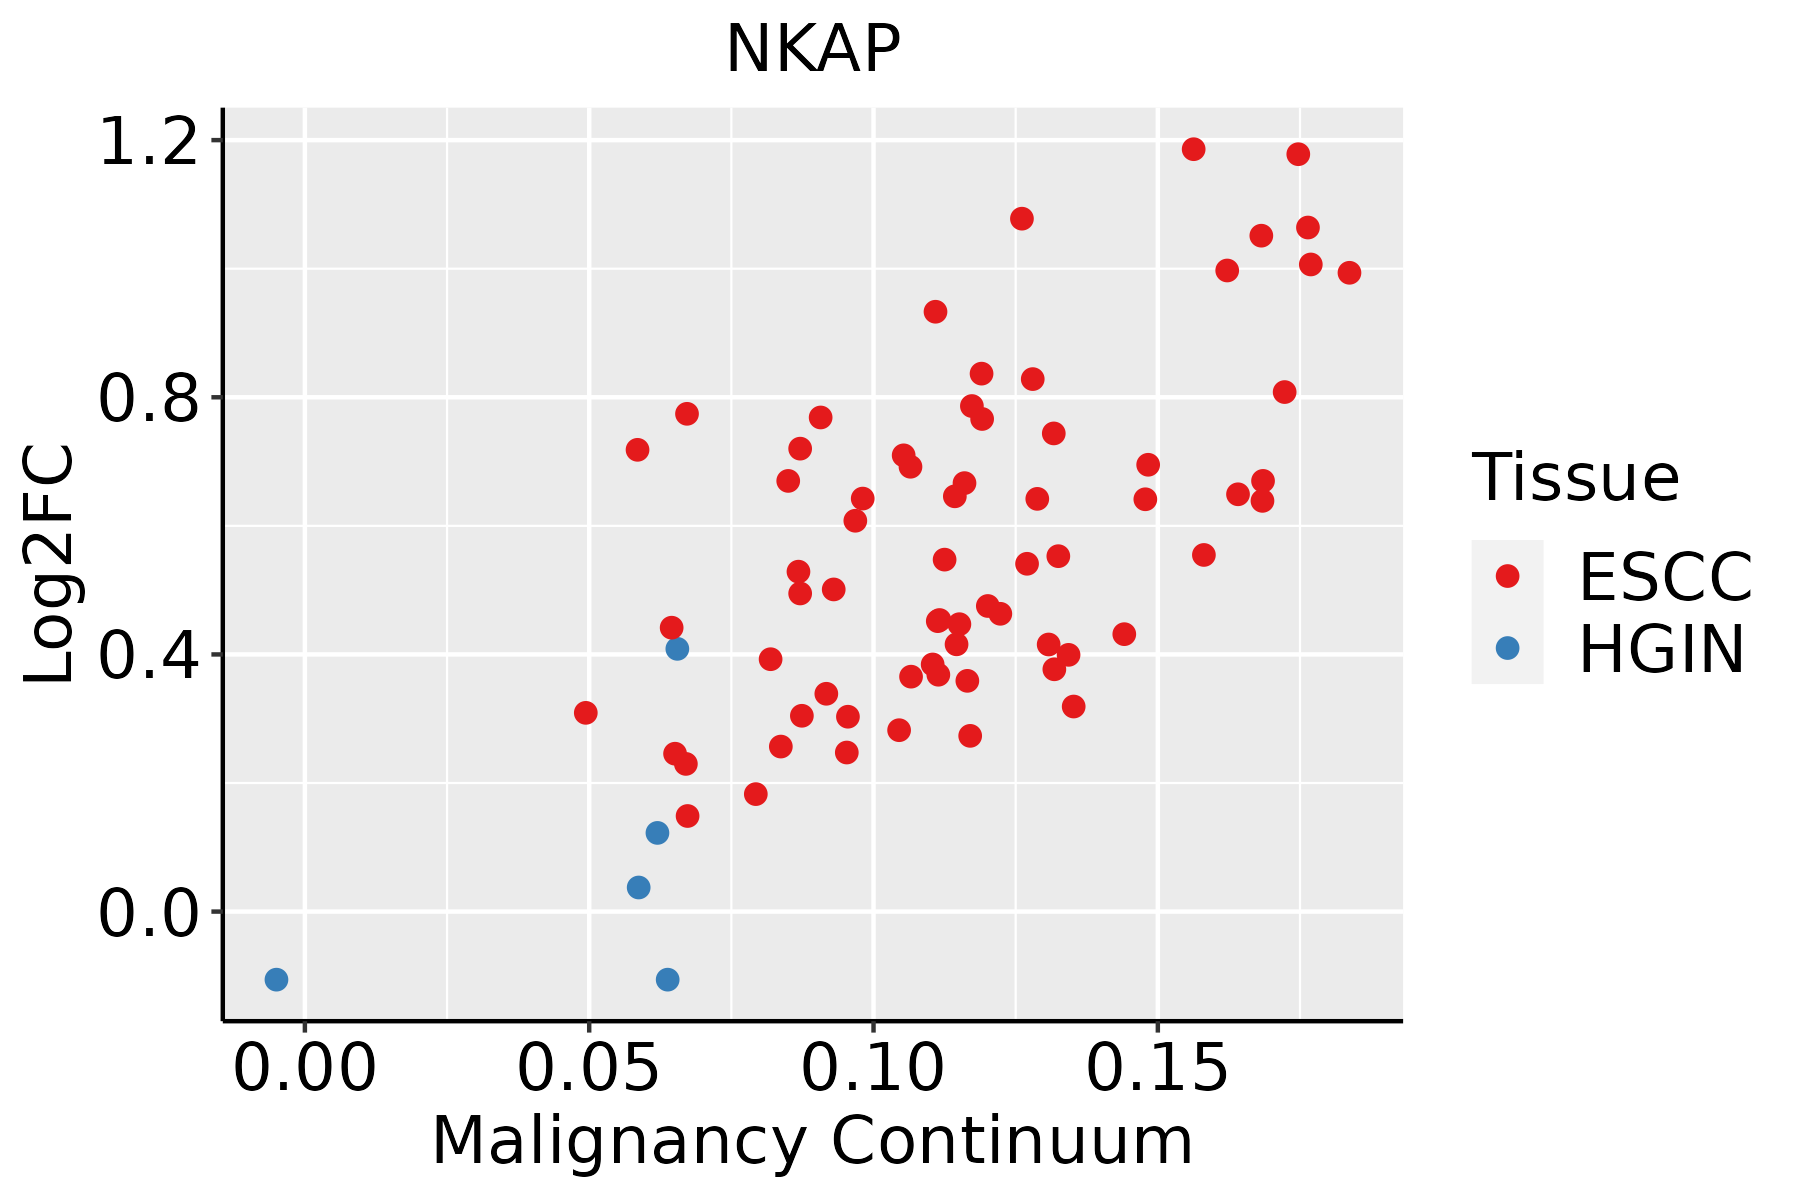
ESCC: Esophageal squamous cell carcinoma
HGIN: High-grade intraepithelial neoplasias
LGIN: Low-grade intraepithelial neoplasias
LiverThe image shows the transcriptomic changes along malignancy continuum.log2FC in expression of this searched gene in stem-like cells from each diseased tissue sample relative to stem-like cells in normal samples in each tissue plotted against the malignancy continuum. Samples are colored based on if they are from different disease stage.
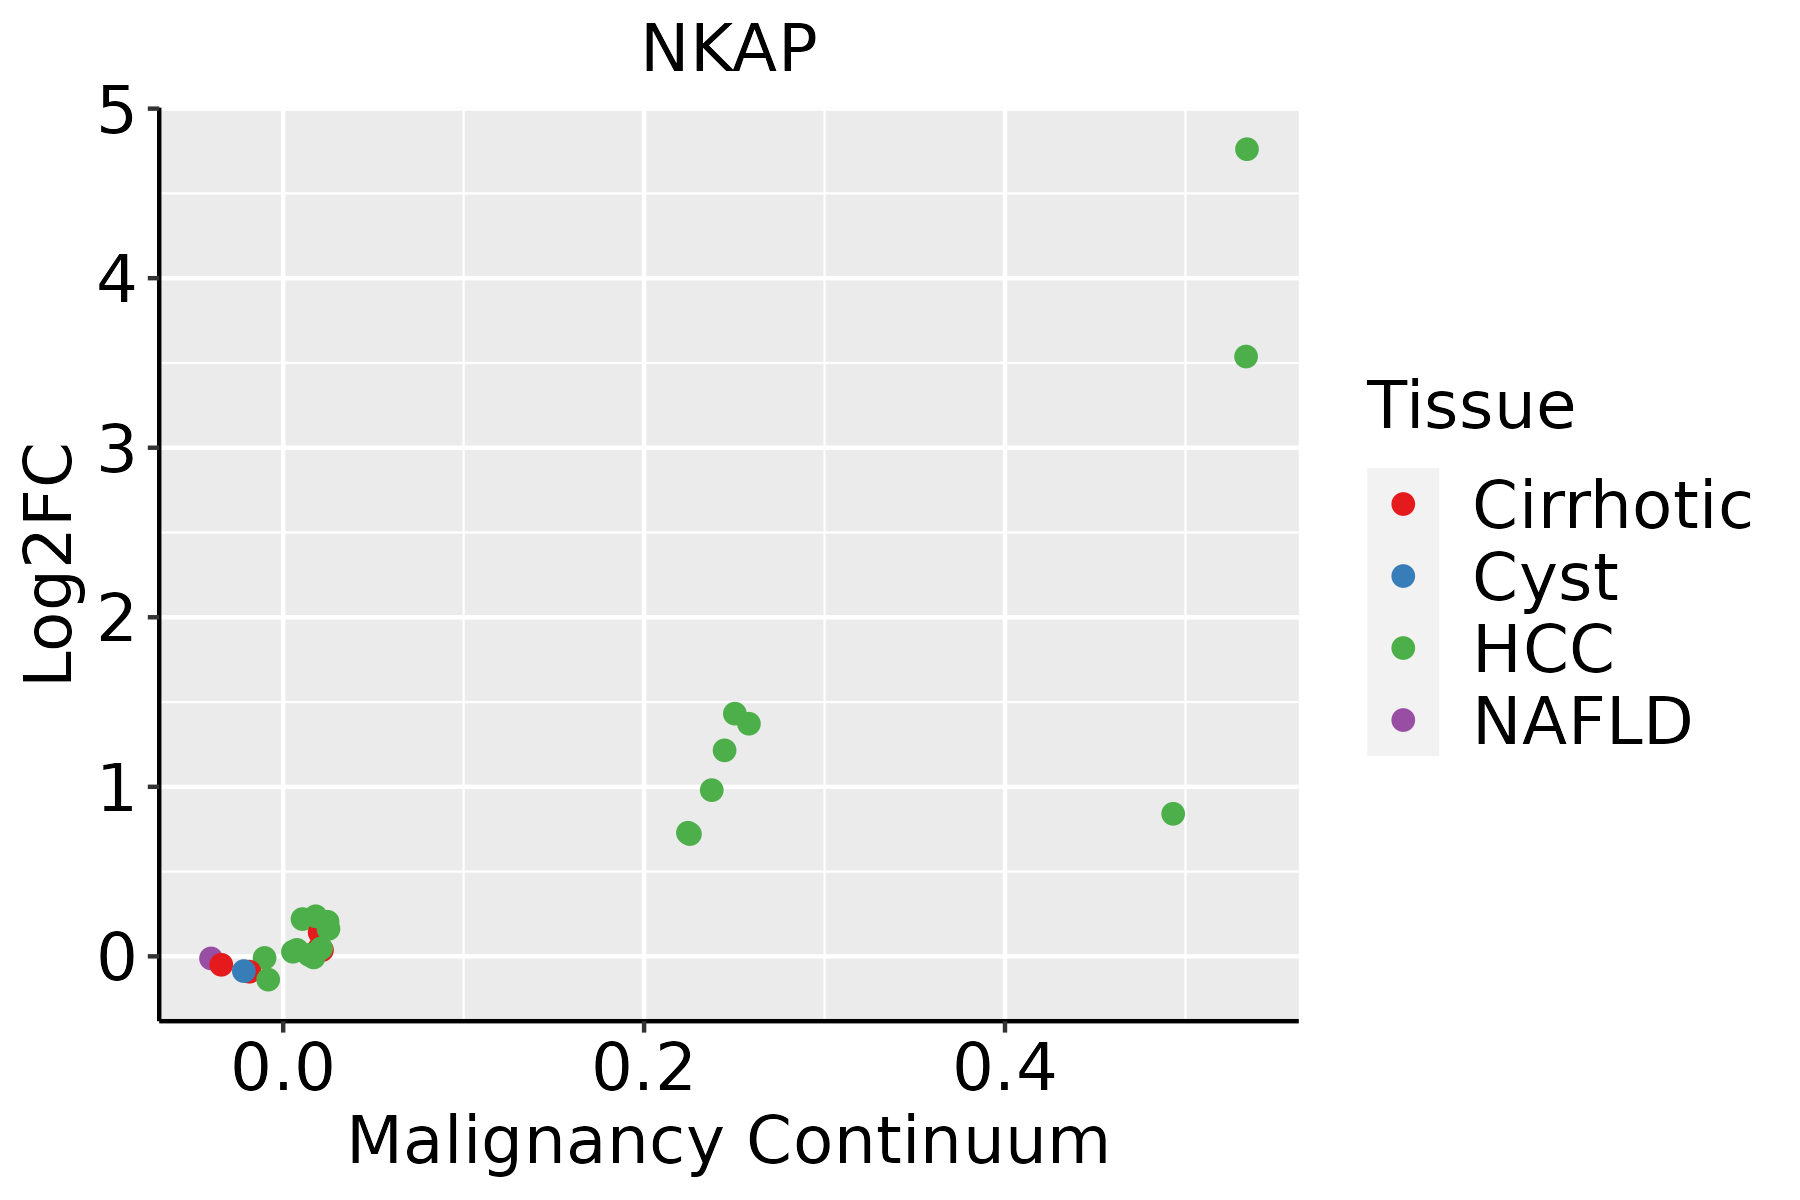
HCC: Hepatocellular carcinoma
NAFLD: Non-alcoholic fatty liver disease
Oral CavityThe image shows the transcriptomic changes along malignancy continuum.log2FC in expression of this searched gene in stem-like cells from each diseased tissue sample relative to stem-like cells in normal samples in each tissue plotted against the malignancy continuum. Samples are colored based on if they are from different disease stage.
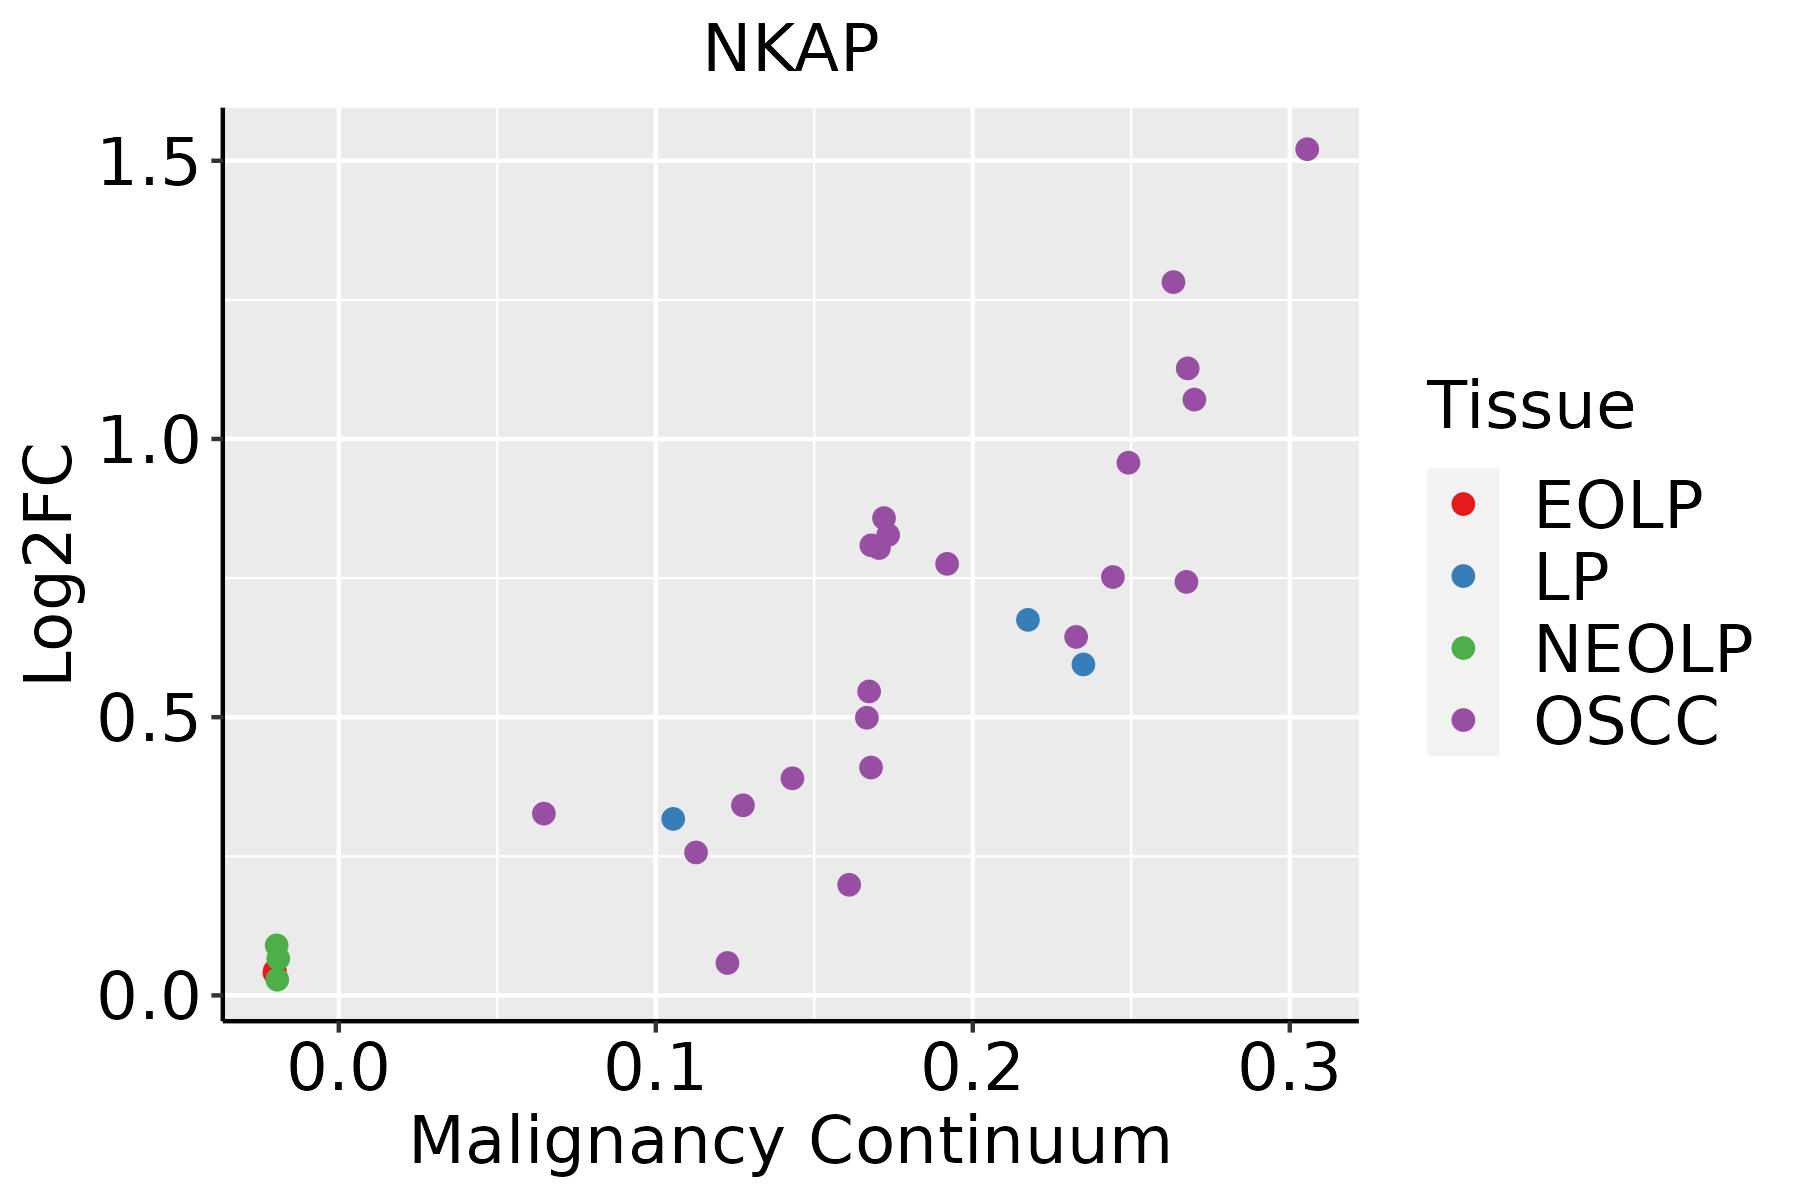
EOLP: Erosive Oral lichen planus
LP: leukoplakia
NEOLP: Non-erosive oral lichen planus
OSCC: Oral squamous cell carcinoma
SkinThe image shows the transcriptomic changes along malignancy continuum.log2FC in expression of this searched gene in stem-like cells from each diseased tissue sample relative to stem-like cells in normal samples in each tissue plotted against the malignancy continuum. Samples are colored based on if they are from different disease stage.
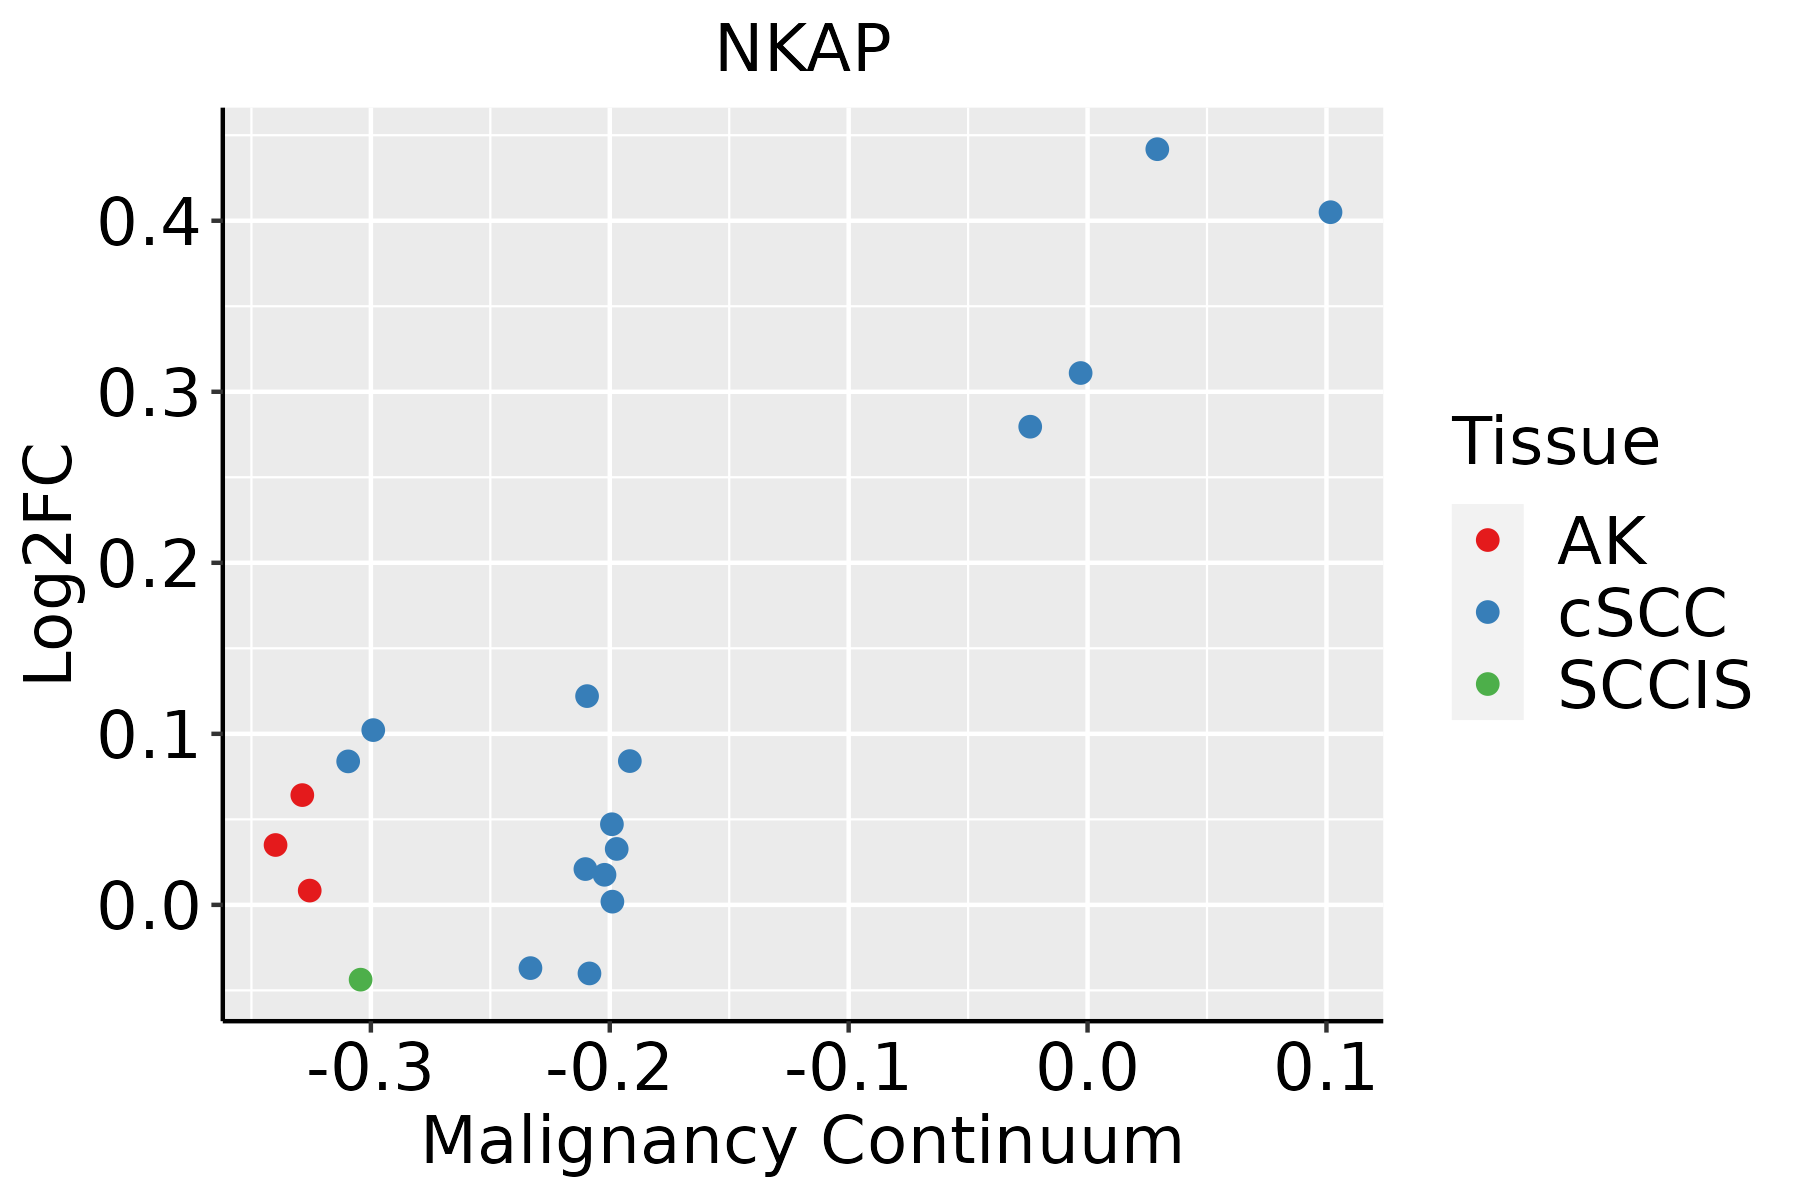
AK: Actinic keratosis
cSCC: Cutaneous squamous cell carcinoma
SCCIS:squamous cell carcinoma in situ
ThyroidThe image shows the transcriptomic changes along malignancy continuum.log2FC in expression of this searched gene in stem-like cells from each diseased tissue sample relative to stem-like cells in normal samples in each tissue plotted against the malignancy continuum. Samples are colored based on if they are from different disease stage.
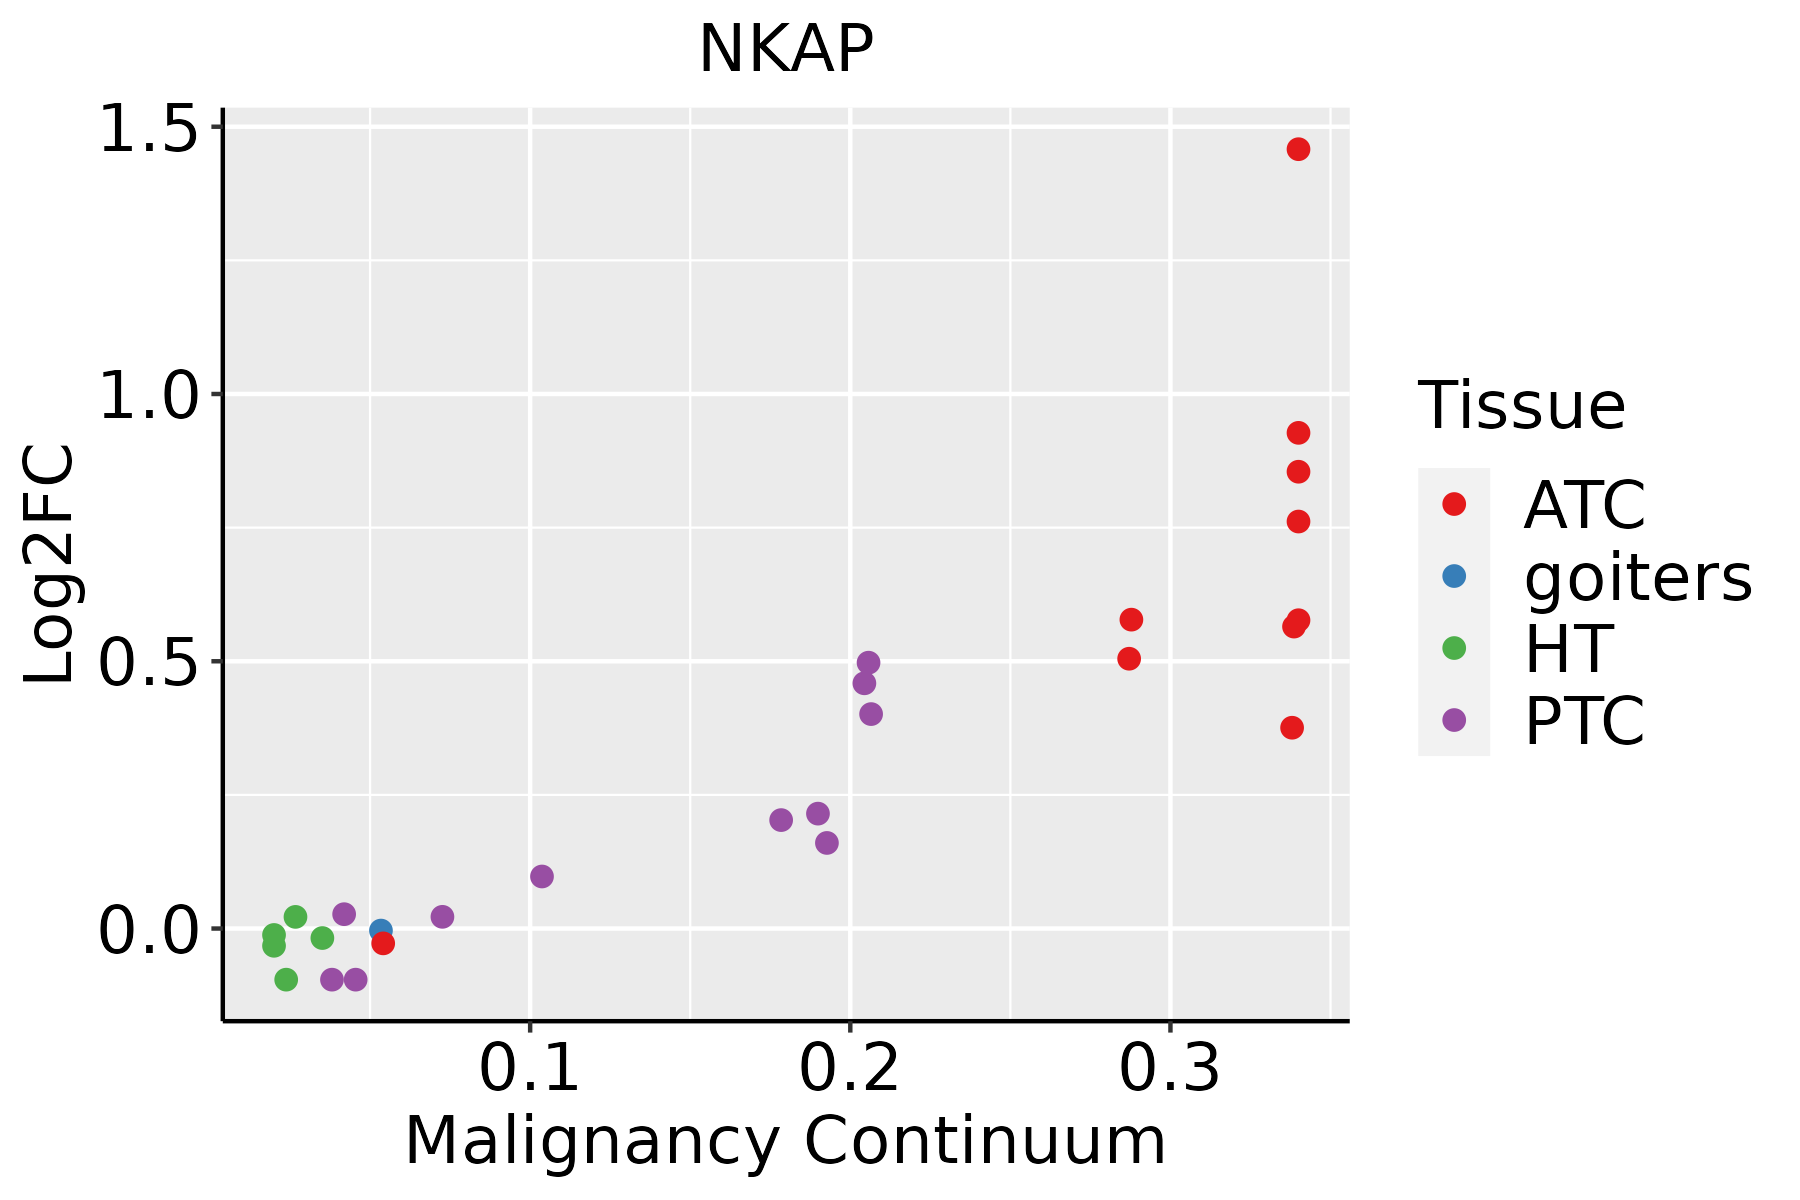
ATC: Anaplastic thyroid cancer
HT: Hashimoto's thyroiditis
PTC: Papillary thyroid cancer
∗log2FC in expression of this searched gene in stem-like cells from each diseased tissue sample relative to stem-like cells in normal samples in each tissue plotted against the malignancy continuum. Samples are colored based on if they are from different disease stage.

Top

Malignant transformation related pathway analysis

check buttonFind out the enriched GO biological processes and KEGG pathways involved in transition from healthy to precancer to cancer
check button Figure of enriched GO biological processes.
TissueDisease StageEnriched GO biological Processes
ColorectumADGO analysis - Figure of enriched GO biological processes: Top 15 enriched GO BP terms are showed in the bar plot of each disease state in each tissue. Each row represents a significant GO biological process which is colored according to the -log10(p.adjust).
ColorectumSERGO analysis - Figure of enriched GO biological processes: Top 15 enriched GO BP terms are showed in the bar plot of each disease state in each tissue. Each row represents a significant GO biological process which is colored according to the -log10(p.adjust).
ColorectumMSSGO analysis - Figure of enriched GO biological processes: Top 15 enriched GO BP terms are showed in the bar plot of each disease state in each tissue. Each row represents a significant GO biological process which is colored according to the -log10(p.adjust).
ColorectumMSI-HGO analysis - Figure of enriched GO biological processes: Top 15 enriched GO BP terms are showed in the bar plot of each disease state in each tissue. Each row represents a significant GO biological process which is colored according to the -log10(p.adjust).
ColorectumFAPGO analysis - Figure of enriched GO biological processes: Top 15 enriched GO BP terms are showed in the bar plot of each disease state in each tissue. Each row represents a significant GO biological process which is colored according to the -log10(p.adjust).
∗Top 15 enriched GO BP terms are showed in the bar plot of each disease state in each tissue. Each row represents a significant GO biological process which is colored according to the -log10(p.adjust).
Page: 1 2 3 4 5 6 7 8 9 

check button Enriched GO biological processes.
GO IDTissueDisease StageDescriptionGene RatioBg Ratiopvaluep.adjustCount
GO:004578527EsophagusESCCpositive regulation of cell adhesion255/8552437/187235.07e-089.11e-07255
GO:00072197EsophagusESCCNotch signaling pathway106/8552172/187231.74e-051.55e-04106
GO:1903706110EsophagusESCCregulation of hemopoiesis201/8552367/187232.60e-041.58e-03201
GO:19021076EsophagusESCCpositive regulation of leukocyte differentiation93/8552157/187234.20e-042.39e-0393
GO:19037086EsophagusESCCpositive regulation of hemopoiesis93/8552157/187234.20e-042.39e-0393
GO:002240720EsophagusESCCregulation of cell-cell adhesion239/8552448/187235.88e-043.19e-03239
GO:004211018EsophagusESCCT cell activation256/8552487/187231.18e-035.87e-03256
GO:19031317EsophagusESCCmononuclear cell differentiation226/8552426/187231.20e-035.88e-03226
GO:002240919EsophagusESCCpositive regulation of cell-cell adhesion155/8552284/187231.50e-037.06e-03155
GO:190210510EsophagusESCCregulation of leukocyte differentiation152/8552279/187231.82e-038.35e-03152
GO:00456213EsophagusESCCpositive regulation of lymphocyte differentiation61/8552104/187235.22e-031.97e-0261
GO:005087015EsophagusESCCpositive regulation of T cell activation117/8552216/187237.23e-032.62e-02117
GO:00302176EsophagusESCCT cell differentiation137/8552257/187238.09e-032.87e-02137
GO:190303916EsophagusESCCpositive regulation of leukocyte cell-cell adhesion128/8552239/187238.40e-032.96e-02128
GO:000715918EsophagusESCCleukocyte cell-cell adhesion192/8552371/187231.03e-023.51e-02192
GO:190303717EsophagusESCCregulation of leukocyte cell-cell adhesion174/8552336/187231.36e-024.43e-02174
GO:00300984EsophagusESCClymphocyte differentiation192/8552374/187231.52e-024.93e-02192
GO:00457857LiverCirrhoticpositive regulation of cell adhesion141/4634437/187232.05e-041.89e-03141
GO:004578512LiverHCCpositive regulation of cell adhesion215/7958437/187232.53e-031.22e-02215
GO:004578520Oral cavityOSCCpositive regulation of cell adhesion225/7305437/187236.06e-081.09e-06225
Page: 1 2 3 

check button Enriched KEGG pathways.
Pathway IDTissueDisease StageDescriptionGene RatioBg Ratiopvaluep.adjustqvalueCount
Page: 1 

Top

Cell-cell communication analysis

check buttonIdentification of potential cell-cell interactions between two cell types and their ligand-receptor pairs for different disease states
LigandReceptorLRpairPathwayTissueDisease Stage
Page: 1 

Top

Single-cell gene regulatory network inference analysis

check buttonFind out the significant the regulons (TFs) and the target genes of each regulon across cell types for different disease states
TFCell TypeTissueDisease StageTarget GeneRSSRegulon Activity
∗The dot plots of a searched regulon are shown for all cell subpopulations in each disease state of each tissue based on the regulon specific score inferred using pySCENIC and by calculating the average expression.
Page: 1 

Top

Somatic mutation of malignant transformation related genes

check buttonAnnotation of somatic variants for genes involved in malignant transformation
Hugo SymbolVariant ClassVariant ClassificationdbSNP RSHGVScHGVSpHGVSp ShortSWISSPROTBIOTYPESIFTPolyPhenTumor Sample BarcodeTissueHistologySexAgeStageTherapy TypesDrugsOutcome
NKAPSNVMissense_Mutationc.1097N>Ap.Arg366Glnp.R366QQ8N5F7protein_codingdeleterious(0)probably_damaging(0.997)TCGA-AC-A2QI-01Breastbreast invasive carcinomaFemale>=65III/IVChemotherapycytoxanCR
NKAPSNVMissense_Mutationc.983N>Ap.Gly328Glup.G328EQ8N5F7protein_codingdeleterious(0.02)probably_damaging(0.995)TCGA-C8-A1HG-01Breastbreast invasive carcinomaFemale<65I/IIUnknownUnknownSD
NKAPSNVMissense_Mutationrs200925009c.331N>Ap.Asp111Asnp.D111NQ8N5F7protein_codingtolerated(0.12)benign(0.015)TCGA-C8-A26V-01Breastbreast invasive carcinomaFemale<65III/IVHormone TherapytamoxiphenCR
NKAPSNVMissense_Mutationc.1167N>Cp.Glu389Aspp.E389DQ8N5F7protein_codingdeleterious(0)probably_damaging(0.99)TCGA-D8-A1JA-01Breastbreast invasive carcinomaFemale<65III/IVChemotherapyadriamycinPD
NKAPSNVMissense_Mutationc.1103G>Ap.Arg368Glnp.R368QQ8N5F7protein_codingdeleterious(0.01)probably_damaging(0.99)TCGA-OL-A66J-01Breastbreast invasive carcinomaFemale>=65I/IIUnknownUnknownSD
NKAPinsertionFrame_Shift_Insnovelc.600_601insGAGTCTCCTTTTTGTACTCTCTCCTGGCTGATGATTGACCAGAAGGp.Ser201GlufsTer22p.S201Efs*22Q8N5F7protein_codingTCGA-A2-A0CM-01Breastbreast invasive carcinomaFemale<65I/IIChemotherapyadriamycinPD
NKAPSNVMissense_Mutationc.605N>Tp.Ser202Leup.S202LQ8N5F7protein_codingtolerated(0.22)possibly_damaging(0.603)TCGA-2W-A8YY-01Cervixcervical & endocervical cancerFemale<65I/IIChemotherapycisplatinCR
NKAPSNVMissense_Mutationnovelc.64N>Tp.Arg22Cysp.R22CQ8N5F7protein_codingdeleterious(0)possibly_damaging(0.446)TCGA-2W-A8YY-01Cervixcervical & endocervical cancerFemale<65I/IIChemotherapycisplatinCR
NKAPSNVMissense_Mutationc.1042N>Cp.Glu348Glnp.E348QQ8N5F7protein_codingdeleterious(0)probably_damaging(0.997)TCGA-C5-A1BQ-01Cervixcervical & endocervical cancerFemale>=65III/IVChemotherapycisplatinCR
NKAPSNVMissense_Mutationc.1103G>Ap.Arg368Glnp.R368QQ8N5F7protein_codingdeleterious(0.01)probably_damaging(0.99)TCGA-EK-A2PG-01Cervixcervical & endocervical cancerFemale>=65I/IIUnknownUnknownSD
Page: 1 2 3 4 5 6 7 8 

Top

Related drugs of malignant transformation related genes

check buttonIdentification of chemicals and drugs interact with genes involved in malignant transfromation
(DGIdb 4.0)
Entrez IDSymbolCategoryInteraction TypesDrug Claim NameDrug NamePMIDs
Page: 1