
|
|||||
|
 | |
| |
| |
| |
| |
| |
|
Gene: NISCH |
Gene summary for NISCH |
| Gene information | Species | Human | Gene symbol | NISCH | Gene ID | 11188 |
| Gene name | nischarin | |
| Gene Alias | I-1 | |
| Cytomap | 3p21.1 | |
| Gene Type | protein-coding | GO ID | GO:0003008 | UniProtAcc | Q9Y2I1 |
Top |
Malignant transformation analysis |
| Identification of the aberrant gene expression in precancerous and cancerous lesions by comparing the gene expression of stem-like cells in diseased tissues with normal stem cells |
| Entrez ID | Symbol | Replicates | Species | Organ | Tissue | Adj P-value | Log2FC | Malignancy |
| 11188 | NISCH | HCC1_Meng | Human | Liver | HCC | 3.05e-23 | 2.82e-02 | 0.0246 |
| 11188 | NISCH | HCC1 | Human | Liver | HCC | 7.48e-08 | 4.59e+00 | 0.5336 |
| 11188 | NISCH | HCC2 | Human | Liver | HCC | 6.29e-07 | 3.20e+00 | 0.5341 |
| 11188 | NISCH | S014 | Human | Liver | HCC | 1.26e-05 | 4.53e-01 | 0.2254 |
| 11188 | NISCH | S015 | Human | Liver | HCC | 2.84e-09 | 6.23e-01 | 0.2375 |
| 11188 | NISCH | S028 | Human | Liver | HCC | 5.38e-12 | 6.70e-01 | 0.2503 |
| 11188 | NISCH | S029 | Human | Liver | HCC | 2.47e-05 | 4.60e-01 | 0.2581 |
| 11188 | NISCH | C04 | Human | Oral cavity | OSCC | 6.44e-06 | 2.93e-01 | 0.2633 |
| 11188 | NISCH | C21 | Human | Oral cavity | OSCC | 6.32e-12 | 2.67e-01 | 0.2678 |
| 11188 | NISCH | C30 | Human | Oral cavity | OSCC | 5.69e-14 | 6.23e-01 | 0.3055 |
| 11188 | NISCH | C46 | Human | Oral cavity | OSCC | 1.56e-07 | 2.48e-01 | 0.1673 |
| 11188 | NISCH | C51 | Human | Oral cavity | OSCC | 1.87e-04 | 3.69e-01 | 0.2674 |
| 11188 | NISCH | C09 | Human | Oral cavity | OSCC | 3.95e-02 | 7.88e-02 | 0.1431 |
| 11188 | NISCH | LN22 | Human | Oral cavity | OSCC | 1.81e-05 | 6.10e-01 | 0.1733 |
| 11188 | NISCH | SYSMH2 | Human | Oral cavity | OSCC | 1.69e-04 | 2.14e-01 | 0.2326 |
| 11188 | NISCH | SYSMH3 | Human | Oral cavity | OSCC | 1.43e-11 | 3.92e-01 | 0.2442 |
| 11188 | NISCH | SYSMH6 | Human | Oral cavity | OSCC | 1.46e-02 | 1.26e-01 | 0.1275 |
| 11188 | NISCH | HTA12-25-1 | Human | Pancreas | PDAC | 9.69e-04 | 4.55e-01 | 0.313 |
| 11188 | NISCH | HTA12-26-1 | Human | Pancreas | PDAC | 7.87e-28 | 1.05e+00 | 0.3728 |
| 11188 | NISCH | HTA12-29-1 | Human | Pancreas | PDAC | 4.59e-51 | 1.02e+00 | 0.3722 |
| Page: 1 2 3 |
| Tissue | Expression Dynamics | Abbreviation |
| Liver |  | HCC: Hepatocellular carcinoma |
| NAFLD: Non-alcoholic fatty liver disease | ||
| Oral Cavity | 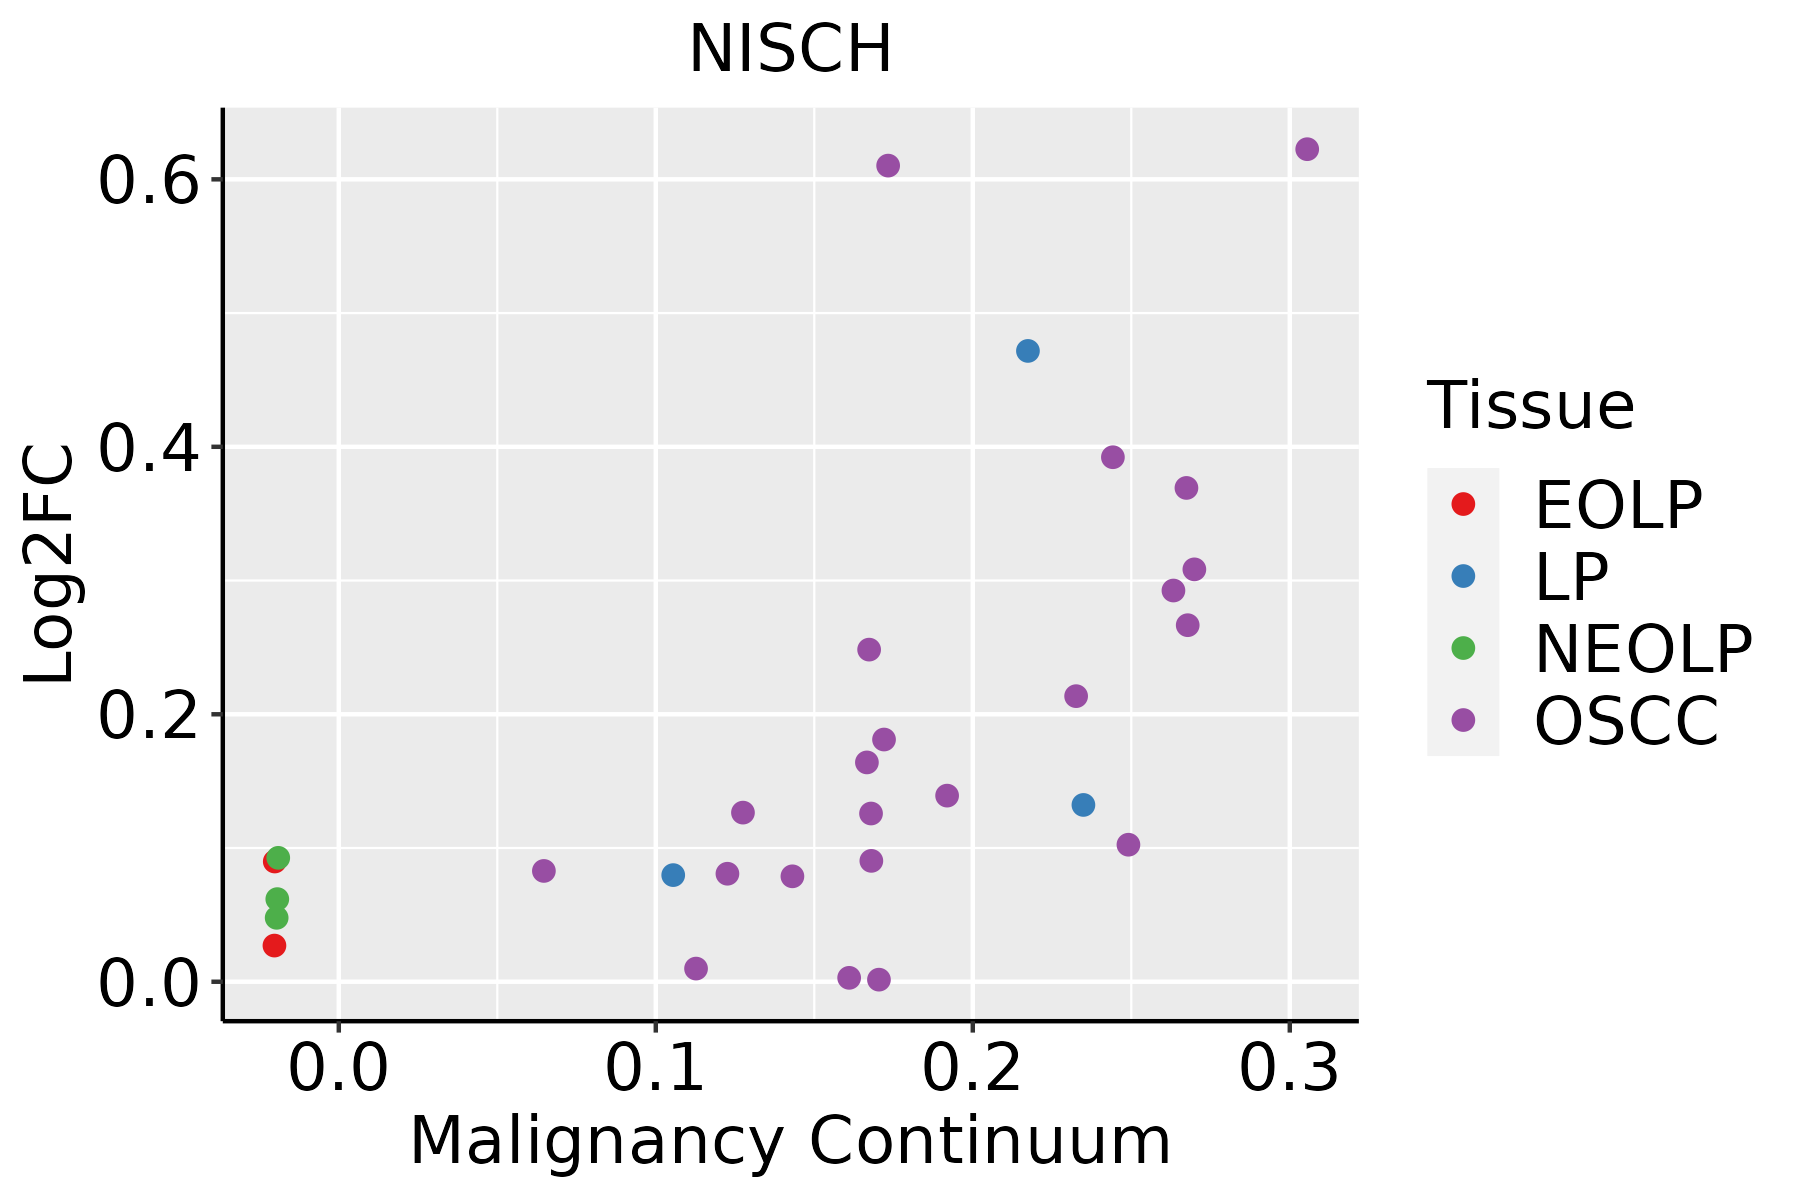 | EOLP: Erosive Oral lichen planus |
| LP: leukoplakia | ||
| NEOLP: Non-erosive oral lichen planus | ||
| OSCC: Oral squamous cell carcinoma | ||
| Prostate | 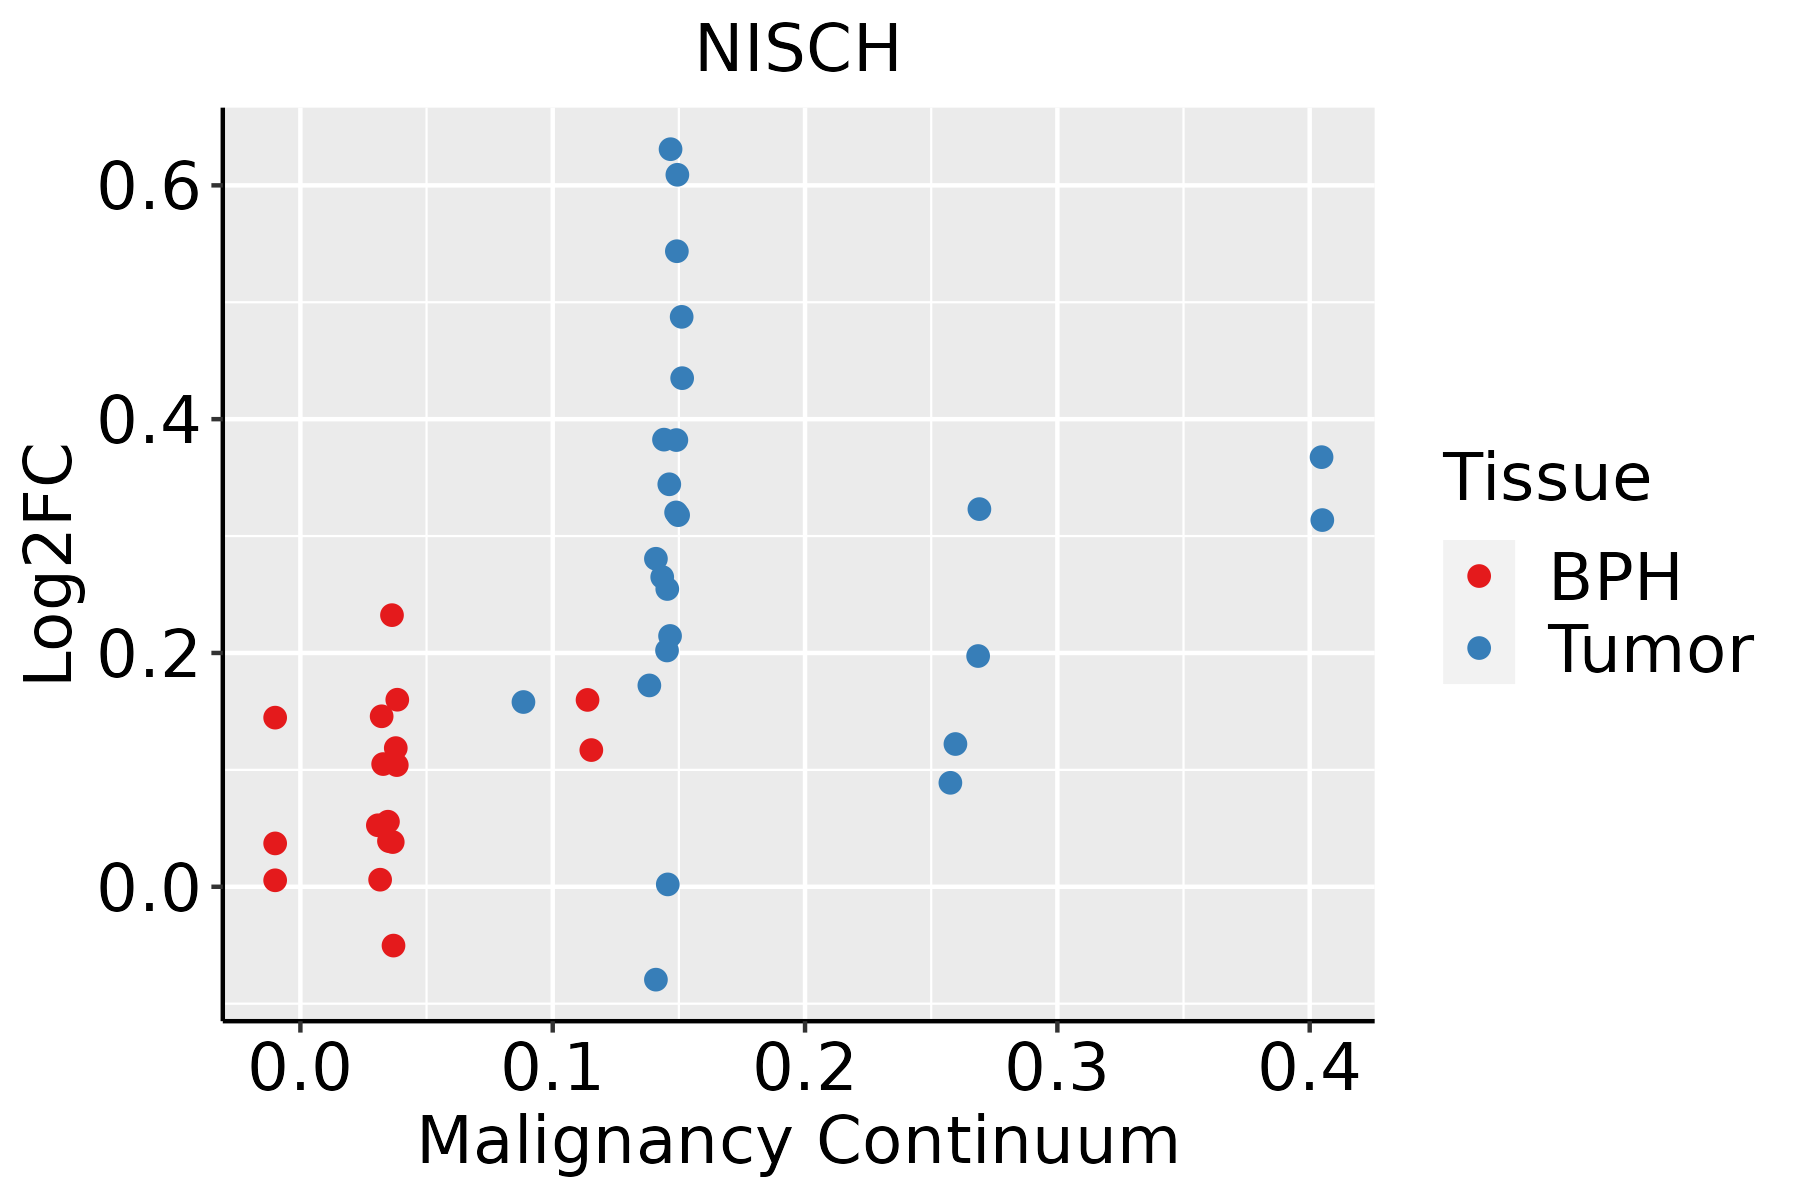 | BPH: Benign Prostatic Hyperplasia |
| Thyroid |  | ATC: Anaplastic thyroid cancer |
| HT: Hashimoto's thyroiditis | ||
| PTC: Papillary thyroid cancer |
| ∗log2FC in expression of this searched gene in stem-like cells from each diseased tissue sample relative to stem-like cells in normal samples in each tissue plotted against the malignancy continuum. Samples are colored based on if they are from different disease stage. |
Top |
Malignant transformation related pathway analysis |
| Find out the enriched GO biological processes and KEGG pathways involved in transition from healthy to precancer to cancer |
| Tissue | Disease Stage | Enriched GO biological Processes |
| Colorectum | AD |  |
| Colorectum | SER |  |
| Colorectum | MSS |  |
| Colorectum | MSI-H |  |
| Colorectum | FAP |  |
| ∗Top 15 enriched GO BP terms are showed in the bar plot of each disease state in each tissue. Each row represents a significant GO biological process which is colored according to the -log10(p.adjust). |
| Page: 1 2 3 4 5 6 7 8 9 |
| GO ID | Tissue | Disease Stage | Description | Gene Ratio | Bg Ratio | pvalue | p.adjust | Count |
| GO:000599621 | Liver | HCC | monosaccharide metabolic process | 167/7958 | 257/18723 | 2.31e-13 | 1.25e-11 | 167 |
| GO:001931821 | Liver | HCC | hexose metabolic process | 155/7958 | 237/18723 | 7.63e-13 | 3.90e-11 | 155 |
| GO:000600621 | Liver | HCC | glucose metabolic process | 128/7958 | 196/18723 | 8.60e-11 | 3.06e-09 | 128 |
| GO:000726521 | Liver | HCC | Ras protein signal transduction | 187/7958 | 337/18723 | 8.89e-07 | 1.35e-05 | 187 |
| GO:001660121 | Liver | HCC | Rac protein signal transduction | 28/7958 | 42/18723 | 1.35e-03 | 7.26e-03 | 28 |
| GO:00072659 | Oral cavity | OSCC | Ras protein signal transduction | 185/7305 | 337/18723 | 1.95e-09 | 4.60e-08 | 185 |
| GO:00059968 | Oral cavity | OSCC | monosaccharide metabolic process | 129/7305 | 257/18723 | 1.63e-04 | 1.13e-03 | 129 |
| GO:00166018 | Oral cavity | OSCC | Rac protein signal transduction | 28/7305 | 42/18723 | 2.61e-04 | 1.67e-03 | 28 |
| GO:00193188 | Oral cavity | OSCC | hexose metabolic process | 118/7305 | 237/18723 | 4.53e-04 | 2.73e-03 | 118 |
| GO:00060068 | Oral cavity | OSCC | glucose metabolic process | 98/7305 | 196/18723 | 1.10e-03 | 5.63e-03 | 98 |
| GO:000726514 | Prostate | Tumor | Ras protein signal transduction | 101/3246 | 337/18723 | 6.29e-09 | 2.44e-07 | 101 |
| GO:005127114 | Prostate | Tumor | negative regulation of cellular component movement | 92/3246 | 367/18723 | 1.03e-04 | 9.99e-04 | 92 |
| GO:000600613 | Prostate | Tumor | glucose metabolic process | 55/3246 | 196/18723 | 1.22e-04 | 1.14e-03 | 55 |
| GO:200014614 | Prostate | Tumor | negative regulation of cell motility | 89/3246 | 359/18723 | 1.99e-04 | 1.74e-03 | 89 |
| GO:001660112 | Prostate | Tumor | Rac protein signal transduction | 17/3246 | 42/18723 | 3.45e-04 | 2.73e-03 | 17 |
| GO:004001313 | Prostate | Tumor | negative regulation of locomotion | 94/3246 | 391/18723 | 4.20e-04 | 3.21e-03 | 94 |
| GO:003033613 | Prostate | Tumor | negative regulation of cell migration | 84/3246 | 344/18723 | 4.95e-04 | 3.66e-03 | 84 |
| GO:00193187 | Prostate | Tumor | hexose metabolic process | 59/3246 | 237/18723 | 1.96e-03 | 1.14e-02 | 59 |
| GO:00059967 | Prostate | Tumor | monosaccharide metabolic process | 62/3246 | 257/18723 | 3.38e-03 | 1.75e-02 | 62 |
| GO:000726519 | Thyroid | PTC | Ras protein signal transduction | 162/5968 | 337/18723 | 3.16e-10 | 1.02e-08 | 162 |
| Page: 1 2 |
| Pathway ID | Tissue | Disease Stage | Description | Gene Ratio | Bg Ratio | pvalue | p.adjust | qvalue | Count |
| Page: 1 |
Top |
Cell-cell communication analysis |
| Identification of potential cell-cell interactions between two cell types and their ligand-receptor pairs for different disease states |
| Ligand | Receptor | LRpair | Pathway | Tissue | Disease Stage |
| Page: 1 |
Top |
Single-cell gene regulatory network inference analysis |
| Find out the significant the regulons (TFs) and the target genes of each regulon across cell types for different disease states |
| TF | Cell Type | Tissue | Disease Stage | Target Gene | RSS | Regulon Activity |
| ∗The dot plots of a searched regulon are shown for all cell subpopulations in each disease state of each tissue based on the regulon specific score inferred using pySCENIC and by calculating the average expression. |
| Page: 1 |
Top |
Somatic mutation of malignant transformation related genes |
| Annotation of somatic variants for genes involved in malignant transformation |
| Hugo Symbol | Variant Class | Variant Classification | dbSNP RS | HGVSc | HGVSp | HGVSp Short | SWISSPROT | BIOTYPE | SIFT | PolyPhen | Tumor Sample Barcode | Tissue | Histology | Sex | Age | Stage | Therapy Types | Drugs | Outcome |
| NISCH | SNV | Missense_Mutation | c.544N>A | p.Asp182Asn | p.D182N | Q9Y2I1 | protein_coding | deleterious(0) | probably_damaging(0.975) | TCGA-AC-A23H-01 | Breast | breast invasive carcinoma | Female | >=65 | I/II | Unknown | Unknown | PD | |
| NISCH | SNV | Missense_Mutation | rs773401264 | c.2936N>A | p.Arg979His | p.R979H | Q9Y2I1 | protein_coding | tolerated(0.08) | probably_damaging(0.932) | TCGA-AO-A128-01 | Breast | breast invasive carcinoma | Female | <65 | I/II | Chemotherapy | doxorubicin | SD |
| NISCH | SNV | Missense_Mutation | c.3322N>C | p.Ser1108Arg | p.S1108R | Q9Y2I1 | protein_coding | deleterious(0) | possibly_damaging(0.638) | TCGA-AO-A128-01 | Breast | breast invasive carcinoma | Female | <65 | I/II | Chemotherapy | doxorubicin | SD | |
| NISCH | SNV | Missense_Mutation | novel | c.2480G>T | p.Ser827Ile | p.S827I | Q9Y2I1 | protein_coding | tolerated(0.06) | possibly_damaging(0.731) | TCGA-BH-A1FC-01 | Breast | breast invasive carcinoma | Female | >=65 | I/II | Unknown | Unknown | SD |
| NISCH | insertion | In_Frame_Ins | novel | c.476_477insGGG | p.Glu159_Gln160insGly | p.E159_Q160insG | Q9Y2I1 | protein_coding | TCGA-A2-A0EM-01 | Breast | breast invasive carcinoma | Female | >=65 | I/II | Hormone Therapy | tamoxiphen | SD | ||
| NISCH | insertion | Frame_Shift_Ins | novel | c.1762_1763insGATATAAATCCTTGTCAAA | p.Leu588ArgfsTer53 | p.L588Rfs*53 | Q9Y2I1 | protein_coding | TCGA-A8-A07U-01 | Breast | breast invasive carcinoma | Female | >=65 | III/IV | Chemotherapy | 5-fluorouracil | SD | ||
| NISCH | deletion | Frame_Shift_Del | novel | c.3770delN | p.Cys1257SerfsTer2 | p.C1257Sfs*2 | Q9Y2I1 | protein_coding | TCGA-EW-A2FV-01 | Breast | breast invasive carcinoma | Female | <65 | III/IV | Chemotherapy | docetaxel | SD | ||
| NISCH | SNV | Missense_Mutation | novel | c.3997G>A | p.Ala1333Thr | p.A1333T | Q9Y2I1 | protein_coding | deleterious(0) | possibly_damaging(0.79) | TCGA-2W-A8YY-01 | Cervix | cervical & endocervical cancer | Female | <65 | I/II | Chemotherapy | cisplatin | CR |
| NISCH | SNV | Missense_Mutation | novel | c.1896N>T | p.Gln632His | p.Q632H | Q9Y2I1 | protein_coding | tolerated(0.13) | benign(0) | TCGA-C5-A1M6-01 | Cervix | cervical & endocervical cancer | Female | <65 | I/II | Chemotherapy | cisplatin | PD |
| NISCH | SNV | Missense_Mutation | c.3460N>C | p.Glu1154Gln | p.E1154Q | Q9Y2I1 | protein_coding | deleterious(0.04) | probably_damaging(0.991) | TCGA-EK-A2R8-01 | Cervix | cervical & endocervical cancer | Female | <65 | I/II | Unknown | Unknown | SD |
| Page: 1 2 3 4 5 6 7 8 9 10 11 12 |
Top |
Related drugs of malignant transformation related genes |
| Identification of chemicals and drugs interact with genes involved in malignant transfromation |
| (DGIdb 4.0) |
| Entrez ID | Symbol | Category | Interaction Types | Drug Claim Name | Drug Name | PMIDs |
| Page: 1 |

Copyright 2023-Present -The University of Texas Health Science Center at Houston |