
|
|||||
|
 | |
| |
| |
| |
| |
| |
|
Gene: NIPAL3 |
Gene summary for NIPAL3 |
| Gene information | Species | Human | Gene symbol | NIPAL3 | Gene ID | 57185 |
| Gene name | NIPA like domain containing 3 | |
| Gene Alias | DJ462O23.2 | |
| Cytomap | 1p36.11 | |
| Gene Type | protein-coding | GO ID | GO:0006810 | UniProtAcc | Q6P499 |
Top |
Malignant transformation analysis |
| Identification of the aberrant gene expression in precancerous and cancerous lesions by comparing the gene expression of stem-like cells in diseased tissues with normal stem cells |
| Entrez ID | Symbol | Replicates | Species | Organ | Tissue | Adj P-value | Log2FC | Malignancy |
| 57185 | NIPAL3 | HTA11_347_2000001011 | Human | Colorectum | AD | 2.55e-14 | 5.59e-01 | -0.1954 |
| 57185 | NIPAL3 | A015-C-203 | Human | Colorectum | FAP | 1.24e-10 | -2.59e-01 | -0.1294 |
| 57185 | NIPAL3 | A002-C-201 | Human | Colorectum | FAP | 4.54e-04 | -2.40e-01 | 0.0324 |
| 57185 | NIPAL3 | A001-C-108 | Human | Colorectum | FAP | 2.86e-06 | -2.03e-01 | -0.0272 |
| 57185 | NIPAL3 | A002-C-205 | Human | Colorectum | FAP | 1.54e-09 | -3.11e-01 | -0.1236 |
| 57185 | NIPAL3 | A015-C-006 | Human | Colorectum | FAP | 5.34e-05 | -2.91e-01 | -0.0994 |
| 57185 | NIPAL3 | A015-C-106 | Human | Colorectum | FAP | 2.40e-02 | -1.34e-01 | -0.0511 |
| 57185 | NIPAL3 | A002-C-114 | Human | Colorectum | FAP | 7.80e-07 | -3.06e-01 | -0.1561 |
| 57185 | NIPAL3 | A015-C-104 | Human | Colorectum | FAP | 2.70e-13 | -2.90e-01 | -0.1899 |
| 57185 | NIPAL3 | A001-C-014 | Human | Colorectum | FAP | 1.64e-05 | -2.09e-01 | 0.0135 |
| 57185 | NIPAL3 | A002-C-016 | Human | Colorectum | FAP | 4.34e-05 | -2.49e-01 | 0.0521 |
| 57185 | NIPAL3 | A015-C-002 | Human | Colorectum | FAP | 6.72e-03 | -2.88e-01 | -0.0763 |
| 57185 | NIPAL3 | A001-C-203 | Human | Colorectum | FAP | 3.12e-02 | -1.41e-01 | -0.0481 |
| 57185 | NIPAL3 | A002-C-116 | Human | Colorectum | FAP | 1.91e-11 | -2.32e-01 | -0.0452 |
| 57185 | NIPAL3 | A014-C-008 | Human | Colorectum | FAP | 9.29e-06 | -3.32e-01 | -0.191 |
| 57185 | NIPAL3 | A018-E-020 | Human | Colorectum | FAP | 9.59e-05 | -2.06e-01 | -0.2034 |
| 57185 | NIPAL3 | F034 | Human | Colorectum | FAP | 3.22e-04 | -2.11e-01 | -0.0665 |
| 57185 | NIPAL3 | CRC-1-8810 | Human | Colorectum | CRC | 1.04e-03 | -2.37e-01 | 0.6257 |
| 57185 | NIPAL3 | CRC-3-11773 | Human | Colorectum | CRC | 3.35e-06 | -2.18e-01 | 0.2564 |
| 57185 | NIPAL3 | LZE4T | Human | Esophagus | ESCC | 1.84e-05 | 1.79e-01 | 0.0811 |
| Page: 1 2 3 4 5 6 |
| Tissue | Expression Dynamics | Abbreviation |
| Colorectum (GSE201348) |  | FAP: Familial adenomatous polyposis |
| CRC: Colorectal cancer | ||
| Colorectum (HTA11) |  | AD: Adenomas |
| SER: Sessile serrated lesions | ||
| MSI-H: Microsatellite-high colorectal cancer | ||
| MSS: Microsatellite stable colorectal cancer | ||
| Esophagus | 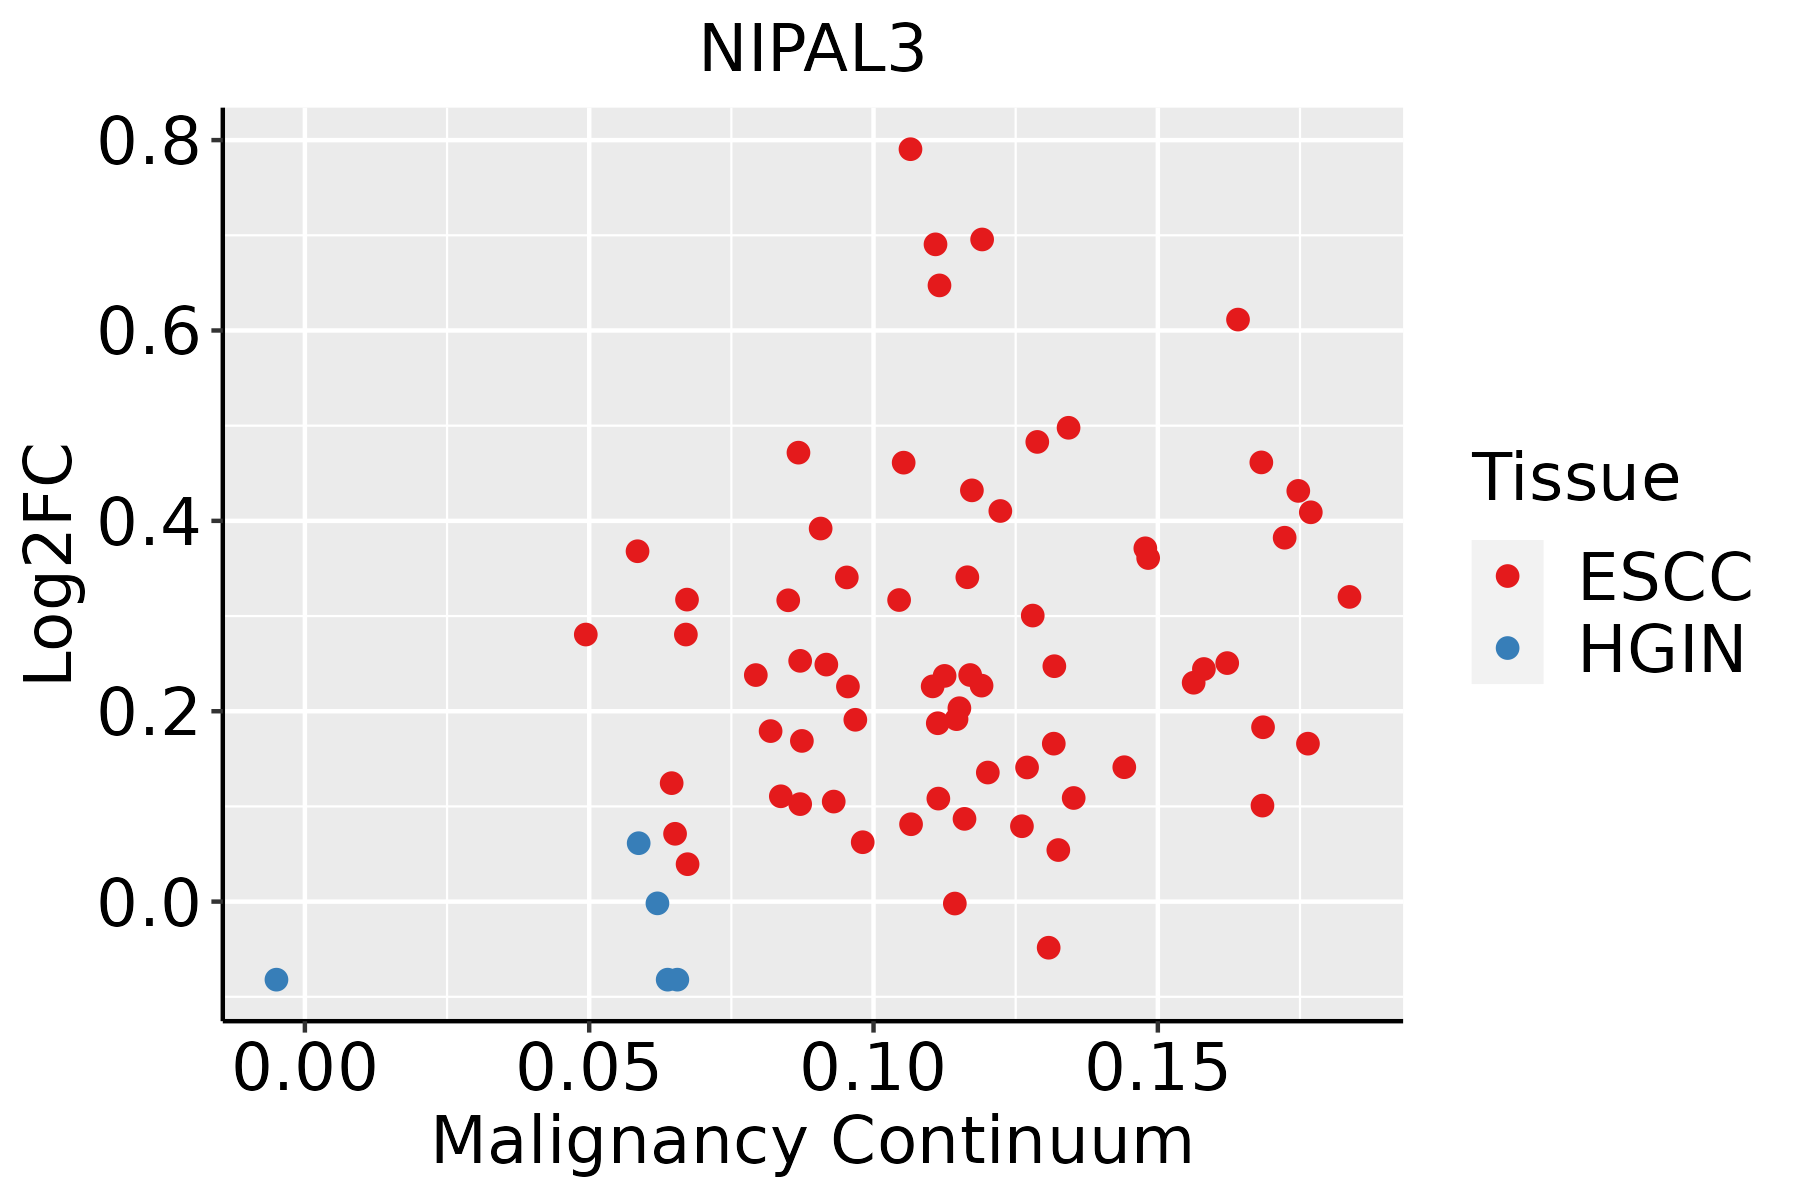 | ESCC: Esophageal squamous cell carcinoma |
| HGIN: High-grade intraepithelial neoplasias | ||
| LGIN: Low-grade intraepithelial neoplasias | ||
| Oral Cavity |  | EOLP: Erosive Oral lichen planus |
| LP: leukoplakia | ||
| NEOLP: Non-erosive oral lichen planus | ||
| OSCC: Oral squamous cell carcinoma | ||
| Thyroid | 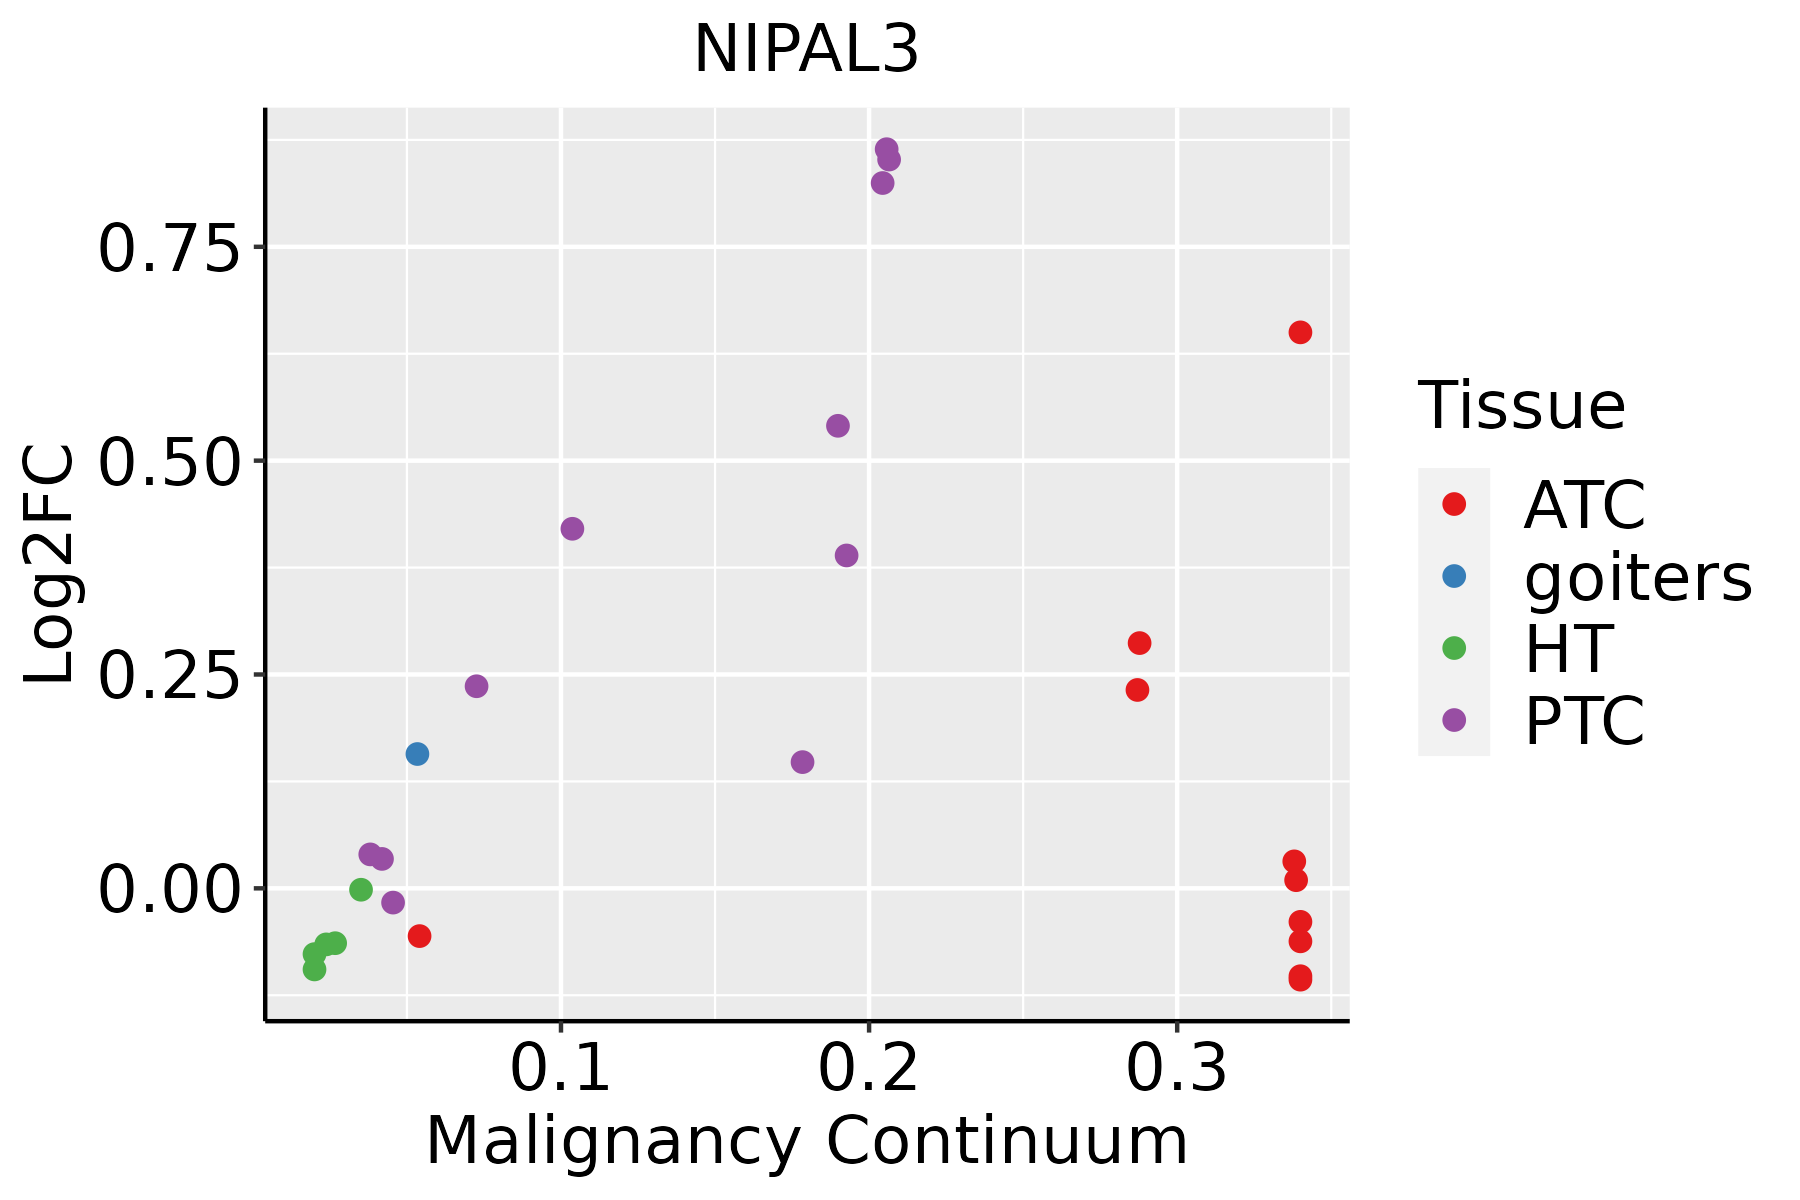 | ATC: Anaplastic thyroid cancer |
| HT: Hashimoto's thyroiditis | ||
| PTC: Papillary thyroid cancer |
| ∗log2FC in expression of this searched gene in stem-like cells from each diseased tissue sample relative to stem-like cells in normal samples in each tissue plotted against the malignancy continuum. Samples are colored based on if they are from different disease stage. |
Top |
Malignant transformation related pathway analysis |
| Find out the enriched GO biological processes and KEGG pathways involved in transition from healthy to precancer to cancer |
| Tissue | Disease Stage | Enriched GO biological Processes |
| Colorectum | AD |  |
| Colorectum | SER |  |
| Colorectum | MSS |  |
| Colorectum | MSI-H |  |
| Colorectum | FAP |  |
| ∗Top 15 enriched GO BP terms are showed in the bar plot of each disease state in each tissue. Each row represents a significant GO biological process which is colored according to the -log10(p.adjust). |
| Page: 1 2 3 4 5 6 7 8 9 |
| GO ID | Tissue | Disease Stage | Description | Gene Ratio | Bg Ratio | pvalue | p.adjust | Count |
| GO:1903830 | Colorectum | FAP | magnesium ion transmembrane transport | 7/2622 | 17/18723 | 5.62e-03 | 3.61e-02 | 7 |
| GO:0015693 | Colorectum | FAP | magnesium ion transport | 7/2622 | 18/18723 | 8.10e-03 | 4.77e-02 | 7 |
| GO:19038301 | Colorectum | CRC | magnesium ion transmembrane transport | 7/2078 | 17/18723 | 1.46e-03 | 1.57e-02 | 7 |
| GO:00156931 | Colorectum | CRC | magnesium ion transport | 7/2078 | 18/18723 | 2.16e-03 | 2.11e-02 | 7 |
| Page: 1 |
| Pathway ID | Tissue | Disease Stage | Description | Gene Ratio | Bg Ratio | pvalue | p.adjust | qvalue | Count |
| Page: 1 |
Top |
Cell-cell communication analysis |
| Identification of potential cell-cell interactions between two cell types and their ligand-receptor pairs for different disease states |
| Ligand | Receptor | LRpair | Pathway | Tissue | Disease Stage |
| Page: 1 |
Top |
Single-cell gene regulatory network inference analysis |
| Find out the significant the regulons (TFs) and the target genes of each regulon across cell types for different disease states |
| TF | Cell Type | Tissue | Disease Stage | Target Gene | RSS | Regulon Activity |
| ∗The dot plots of a searched regulon are shown for all cell subpopulations in each disease state of each tissue based on the regulon specific score inferred using pySCENIC and by calculating the average expression. |
| Page: 1 |
Top |
Somatic mutation of malignant transformation related genes |
| Annotation of somatic variants for genes involved in malignant transformation |
| Hugo Symbol | Variant Class | Variant Classification | dbSNP RS | HGVSc | HGVSp | HGVSp Short | SWISSPROT | BIOTYPE | SIFT | PolyPhen | Tumor Sample Barcode | Tissue | Histology | Sex | Age | Stage | Therapy Types | Drugs | Outcome |
| NIPAL3 | SNV | Missense_Mutation | rs150713534 | c.290N>T | p.Ala97Val | p.A97V | Q6P499 | protein_coding | deleterious(0.01) | probably_damaging(0.999) | TCGA-D8-A1JD-01 | Breast | breast invasive carcinoma | Female | <65 | I/II | Chemotherapy | adriamycin | SD |
| NIPAL3 | SNV | Missense_Mutation | c.793C>A | p.Gln265Lys | p.Q265K | Q6P499 | protein_coding | tolerated(1) | benign(0.056) | TCGA-E9-A1NC-01 | Breast | breast invasive carcinoma | Female | <65 | I/II | Chemotherapy | doxorubicin | CR | |
| NIPAL3 | SNV | Missense_Mutation | novel | c.680T>C | p.Leu227Pro | p.L227P | Q6P499 | protein_coding | deleterious(0.03) | benign(0.012) | TCGA-2W-A8YY-01 | Cervix | cervical & endocervical cancer | Female | <65 | I/II | Chemotherapy | cisplatin | CR |
| NIPAL3 | SNV | Missense_Mutation | novel | c.1117G>A | p.Glu373Lys | p.E373K | Q6P499 | protein_coding | tolerated(0.6) | probably_damaging(0.971) | TCGA-VS-A958-01 | Cervix | cervical & endocervical cancer | Female | <65 | I/II | Chemotherapy | cisplatin | CR |
| NIPAL3 | SNV | Missense_Mutation | rs141630558 | c.773N>T | p.Ala258Val | p.A258V | Q6P499 | protein_coding | deleterious(0.01) | benign(0.063) | TCGA-A6-5660-01 | Colorectum | colon adenocarcinoma | Male | >=65 | III/IV | Ancillary | leucovorin | SD |
| NIPAL3 | SNV | Missense_Mutation | c.190N>G | p.Ser64Ala | p.S64A | Q6P499 | protein_coding | tolerated(0.56) | benign(0.003) | TCGA-AA-3663-01 | Colorectum | colon adenocarcinoma | Male | <65 | I/II | Unknown | Unknown | SD | |
| NIPAL3 | SNV | Missense_Mutation | rs200419498 | c.109N>A | p.Ala37Thr | p.A37T | Q6P499 | protein_coding | tolerated(0.6) | benign(0.023) | TCGA-AA-3811-01 | Colorectum | colon adenocarcinoma | Female | >=65 | III/IV | Unknown | Unknown | PD |
| NIPAL3 | SNV | Missense_Mutation | c.799N>A | p.Tyr267Asn | p.Y267N | Q6P499 | protein_coding | deleterious(0) | probably_damaging(0.985) | TCGA-AA-3811-01 | Colorectum | colon adenocarcinoma | Female | >=65 | III/IV | Unknown | Unknown | PD | |
| NIPAL3 | SNV | Missense_Mutation | novel | c.599N>G | p.Asn200Ser | p.N200S | Q6P499 | protein_coding | tolerated(0.06) | benign(0.01) | TCGA-AA-3984-01 | Colorectum | colon adenocarcinoma | Female | <65 | I/II | Unknown | Unknown | SD |
| NIPAL3 | SNV | Missense_Mutation | c.491N>A | p.Gly164Asp | p.G164D | Q6P499 | protein_coding | deleterious(0) | possibly_damaging(0.812) | TCGA-AD-6895-01 | Colorectum | colon adenocarcinoma | Male | >=65 | III/IV | Unknown | Unknown | SD |
| Page: 1 2 3 4 5 |
Top |
Related drugs of malignant transformation related genes |
| Identification of chemicals and drugs interact with genes involved in malignant transfromation |
| (DGIdb 4.0) |
| Entrez ID | Symbol | Category | Interaction Types | Drug Claim Name | Drug Name | PMIDs |
| Page: 1 |

Copyright 2023-Present -The University of Texas Health Science Center at Houston |