
|
|||||
|
 | |
| |
| |
| |
| |
| |
|
Gene: NIPAL2 |
Gene summary for NIPAL2 |
| Gene information | Species | Human | Gene symbol | NIPAL2 | Gene ID | 79815 |
| Gene name | NIPA like domain containing 2 | |
| Gene Alias | NPAL2 | |
| Cytomap | 8q22.2 | |
| Gene Type | protein-coding | GO ID | GO:0006810 | UniProtAcc | Q9H841 |
Top |
Malignant transformation analysis |
| Identification of the aberrant gene expression in precancerous and cancerous lesions by comparing the gene expression of stem-like cells in diseased tissues with normal stem cells |
| Entrez ID | Symbol | Replicates | Species | Organ | Tissue | Adj P-value | Log2FC | Malignancy |
| 79815 | NIPAL2 | HTA11_3410_2000001011 | Human | Colorectum | AD | 4.47e-04 | -3.61e-01 | 0.0155 |
| 79815 | NIPAL2 | HTA11_1938_2000001011 | Human | Colorectum | AD | 9.58e-03 | 4.00e-01 | -0.0811 |
| 79815 | NIPAL2 | HTA11_347_2000001011 | Human | Colorectum | AD | 6.33e-05 | 4.21e-01 | -0.1954 |
| 79815 | NIPAL2 | HTA11_866_3004761011 | Human | Colorectum | AD | 7.73e-06 | -4.30e-01 | 0.096 |
| 79815 | NIPAL2 | HTA11_99999970781_79442 | Human | Colorectum | MSS | 6.10e-08 | -2.72e-01 | 0.294 |
| 79815 | NIPAL2 | HTA11_99999974143_84620 | Human | Colorectum | MSS | 6.14e-07 | -3.90e-01 | 0.3005 |
| 79815 | NIPAL2 | A015-C-203 | Human | Colorectum | FAP | 2.95e-24 | -3.86e-01 | -0.1294 |
| 79815 | NIPAL2 | A015-C-204 | Human | Colorectum | FAP | 6.20e-03 | -2.76e-01 | -0.0228 |
| 79815 | NIPAL2 | A002-C-201 | Human | Colorectum | FAP | 3.66e-07 | -3.39e-01 | 0.0324 |
| 79815 | NIPAL2 | A002-C-203 | Human | Colorectum | FAP | 1.13e-02 | -7.04e-02 | 0.2786 |
| 79815 | NIPAL2 | A001-C-119 | Human | Colorectum | FAP | 8.75e-06 | -4.12e-01 | -0.1557 |
| 79815 | NIPAL2 | A001-C-108 | Human | Colorectum | FAP | 2.40e-13 | -2.97e-01 | -0.0272 |
| 79815 | NIPAL2 | A002-C-205 | Human | Colorectum | FAP | 1.77e-13 | -4.02e-01 | -0.1236 |
| 79815 | NIPAL2 | A001-C-104 | Human | Colorectum | FAP | 4.58e-02 | -1.59e-01 | 0.0184 |
| 79815 | NIPAL2 | A015-C-005 | Human | Colorectum | FAP | 5.64e-03 | -3.10e-01 | -0.0336 |
| 79815 | NIPAL2 | A015-C-006 | Human | Colorectum | FAP | 4.15e-10 | -3.97e-01 | -0.0994 |
| 79815 | NIPAL2 | A015-C-106 | Human | Colorectum | FAP | 4.89e-11 | -2.20e-01 | -0.0511 |
| 79815 | NIPAL2 | A002-C-114 | Human | Colorectum | FAP | 4.85e-11 | -4.00e-01 | -0.1561 |
| 79815 | NIPAL2 | A015-C-104 | Human | Colorectum | FAP | 1.09e-29 | -5.05e-01 | -0.1899 |
| 79815 | NIPAL2 | A001-C-014 | Human | Colorectum | FAP | 3.85e-11 | -2.06e-01 | 0.0135 |
| Page: 1 2 3 4 5 6 |
| Tissue | Expression Dynamics | Abbreviation |
| Colorectum (GSE201348) |  | FAP: Familial adenomatous polyposis |
| CRC: Colorectal cancer | ||
| Colorectum (HTA11) |  | AD: Adenomas |
| SER: Sessile serrated lesions | ||
| MSI-H: Microsatellite-high colorectal cancer | ||
| MSS: Microsatellite stable colorectal cancer | ||
| Esophagus | 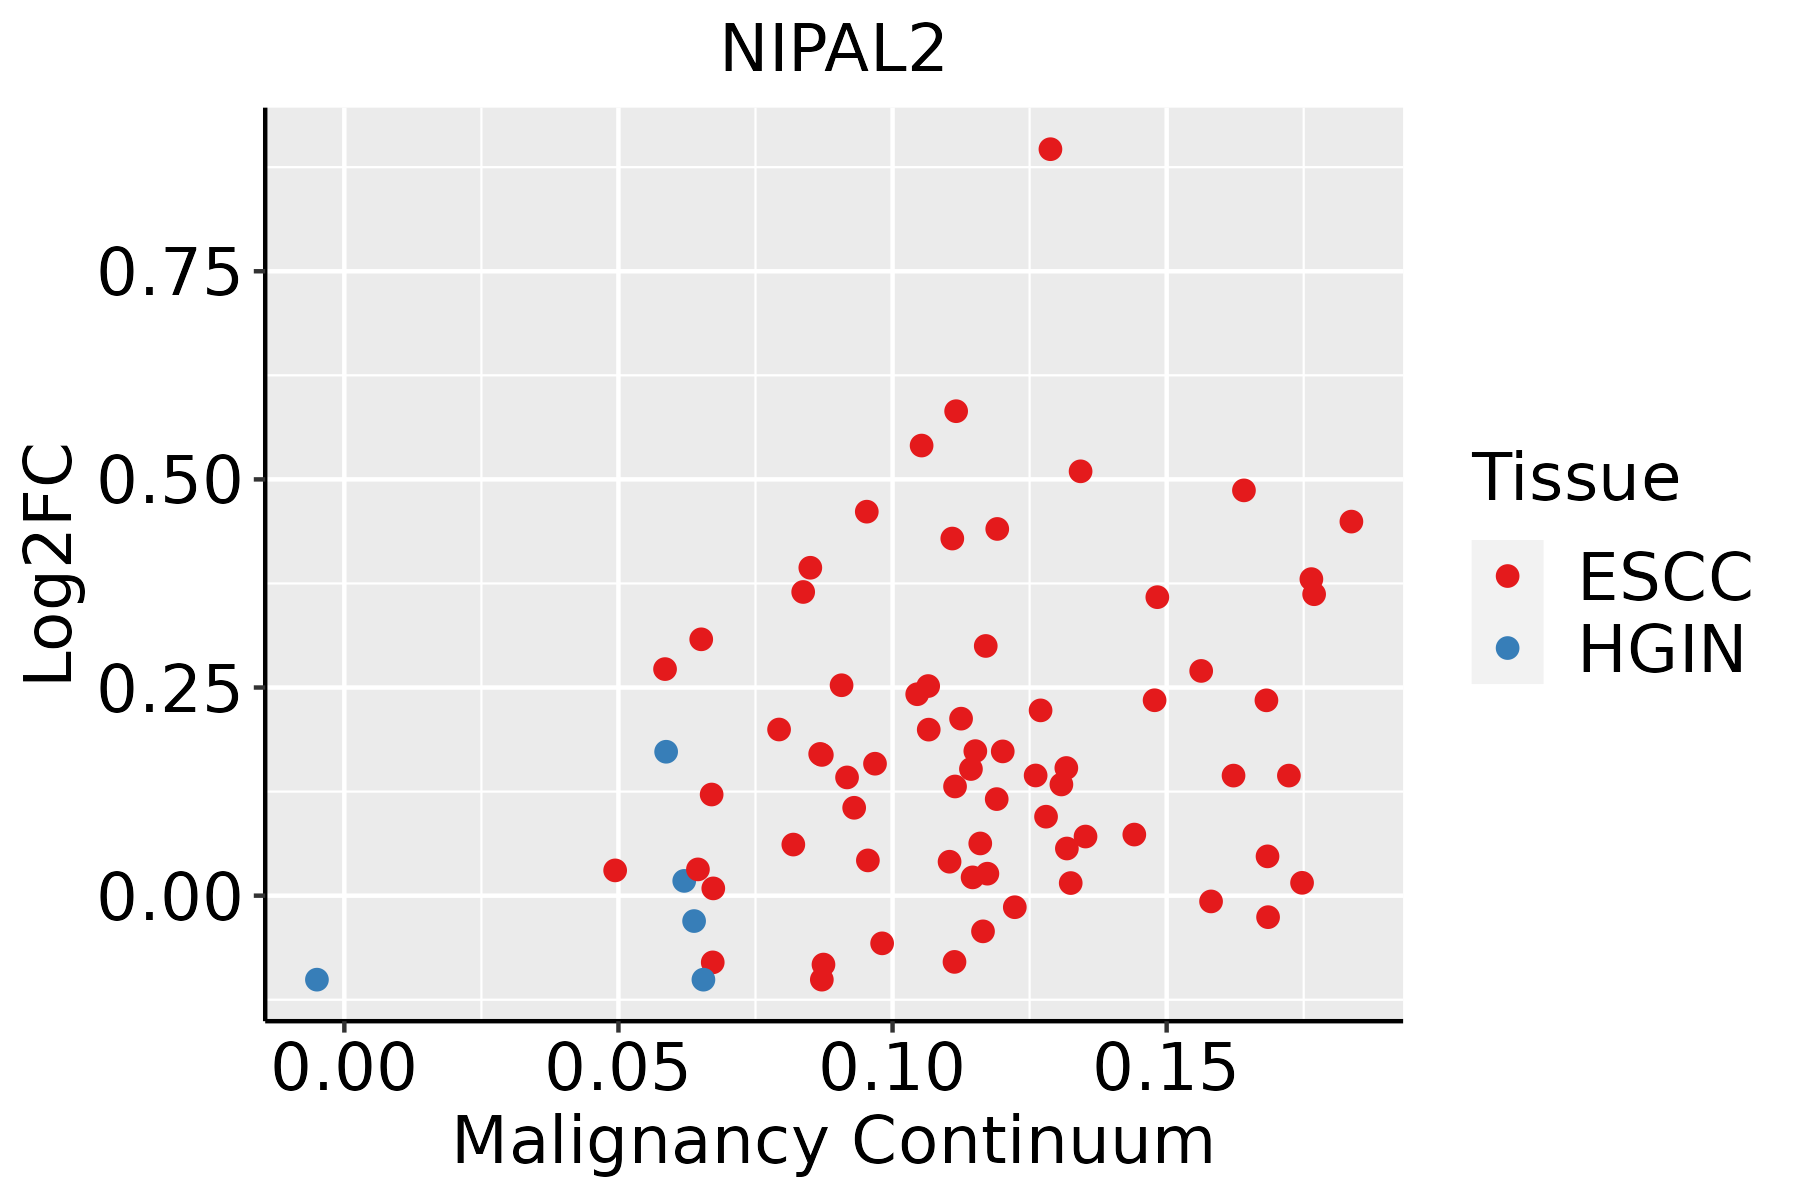 | ESCC: Esophageal squamous cell carcinoma |
| HGIN: High-grade intraepithelial neoplasias | ||
| LGIN: Low-grade intraepithelial neoplasias | ||
| Liver | 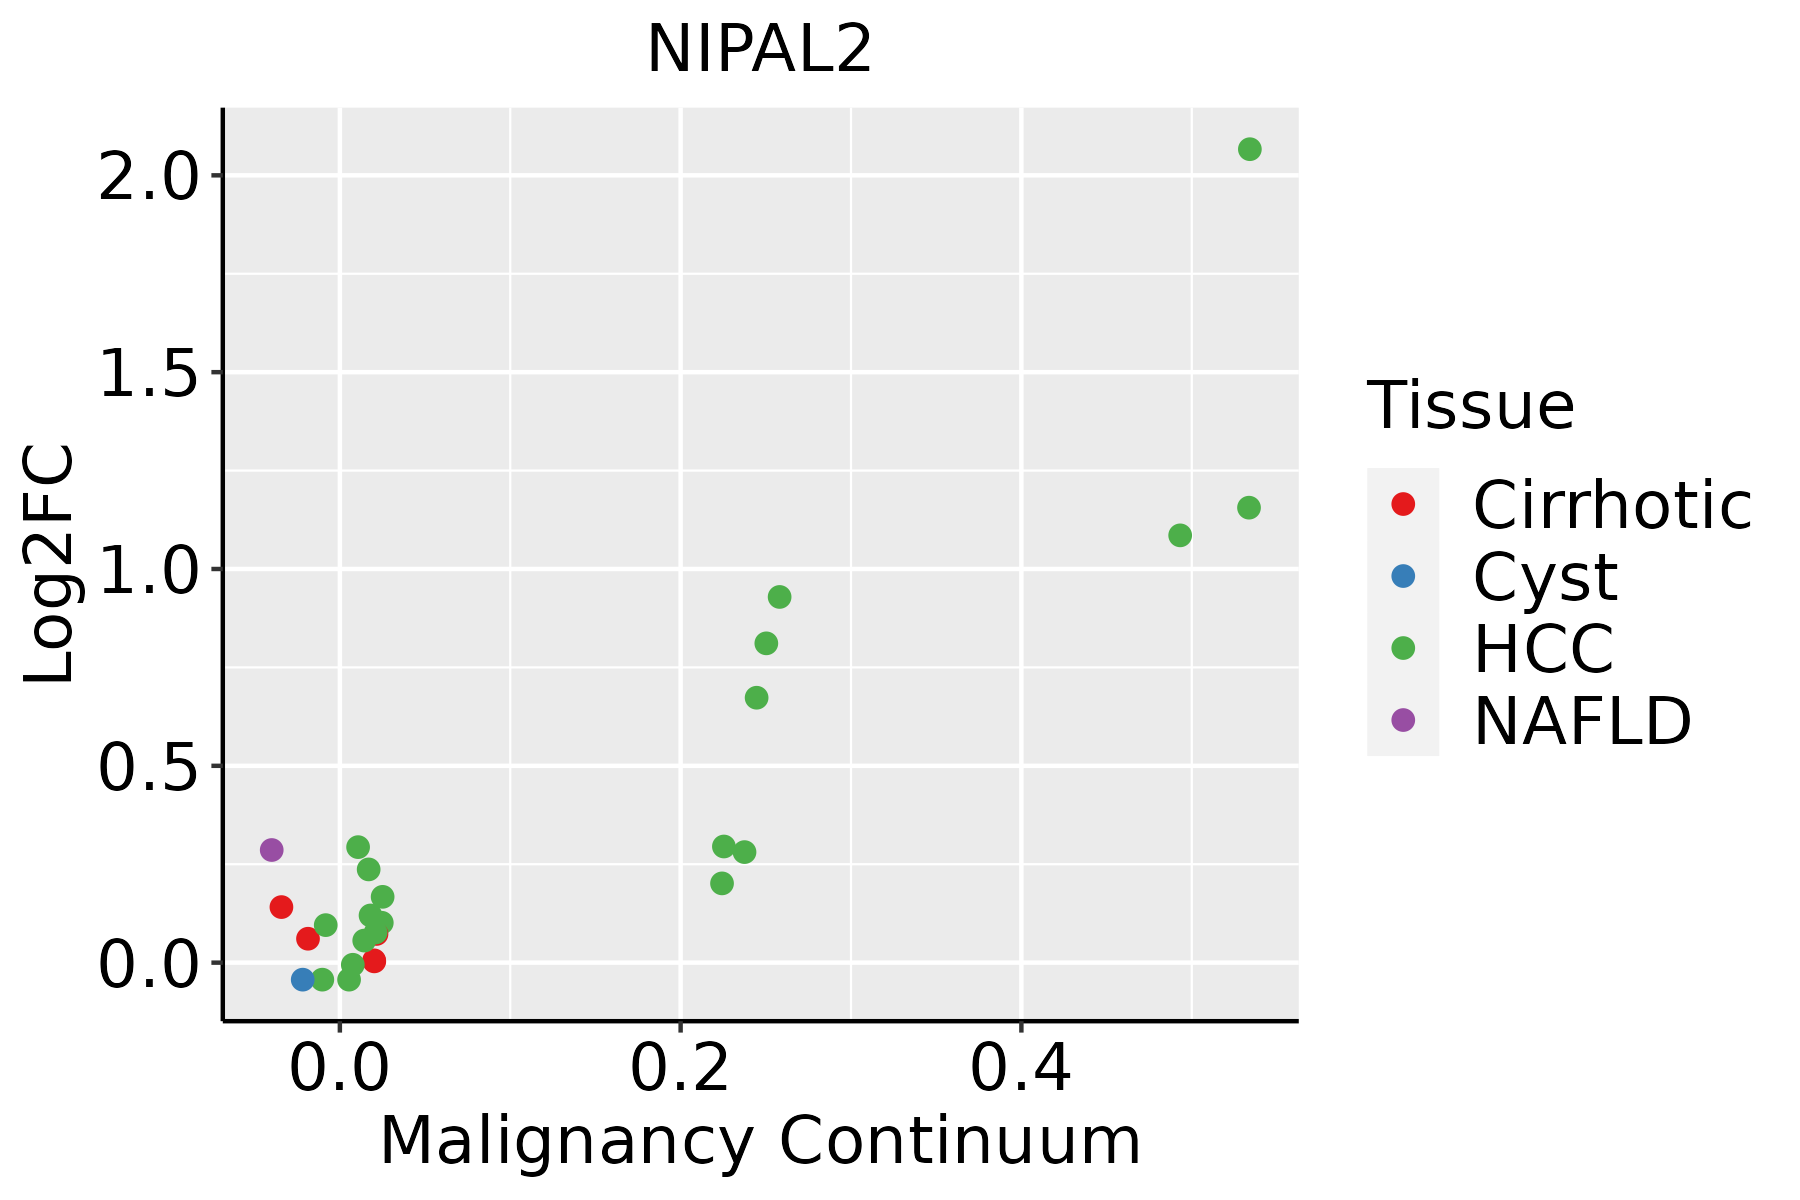 | HCC: Hepatocellular carcinoma |
| NAFLD: Non-alcoholic fatty liver disease | ||
| Oral Cavity | 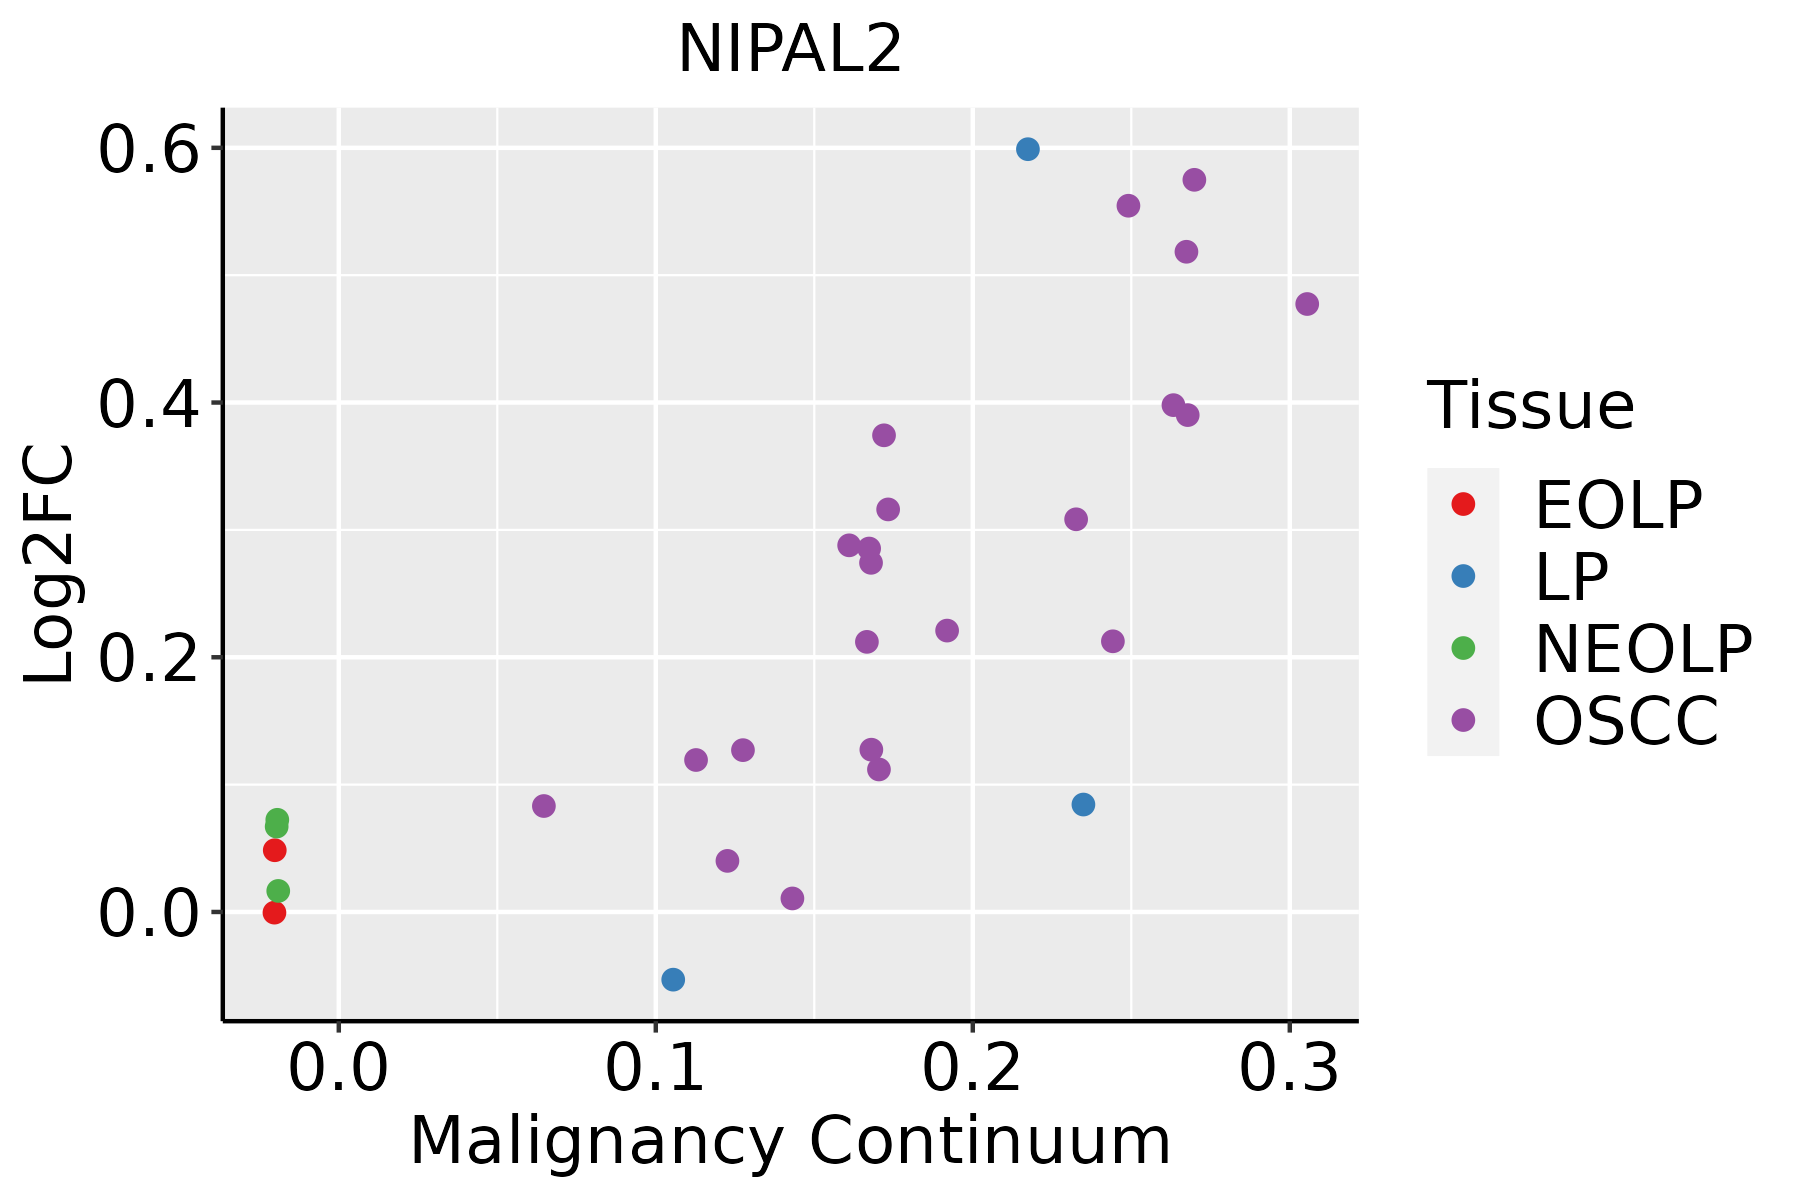 | EOLP: Erosive Oral lichen planus |
| LP: leukoplakia | ||
| NEOLP: Non-erosive oral lichen planus | ||
| OSCC: Oral squamous cell carcinoma |
| ∗log2FC in expression of this searched gene in stem-like cells from each diseased tissue sample relative to stem-like cells in normal samples in each tissue plotted against the malignancy continuum. Samples are colored based on if they are from different disease stage. |
Top |
Malignant transformation related pathway analysis |
| Find out the enriched GO biological processes and KEGG pathways involved in transition from healthy to precancer to cancer |
| Tissue | Disease Stage | Enriched GO biological Processes |
| Colorectum | AD |  |
| Colorectum | SER |  |
| Colorectum | MSS |  |
| Colorectum | MSI-H |  |
| Colorectum | FAP |  |
| ∗Top 15 enriched GO BP terms are showed in the bar plot of each disease state in each tissue. Each row represents a significant GO biological process which is colored according to the -log10(p.adjust). |
| Page: 1 2 3 4 5 6 7 8 9 |
| GO ID | Tissue | Disease Stage | Description | Gene Ratio | Bg Ratio | pvalue | p.adjust | Count |
| GO:1903830 | Colorectum | FAP | magnesium ion transmembrane transport | 7/2622 | 17/18723 | 5.62e-03 | 3.61e-02 | 7 |
| GO:0015693 | Colorectum | FAP | magnesium ion transport | 7/2622 | 18/18723 | 8.10e-03 | 4.77e-02 | 7 |
| GO:19038301 | Colorectum | CRC | magnesium ion transmembrane transport | 7/2078 | 17/18723 | 1.46e-03 | 1.57e-02 | 7 |
| GO:00156931 | Colorectum | CRC | magnesium ion transport | 7/2078 | 18/18723 | 2.16e-03 | 2.11e-02 | 7 |
| Page: 1 |
| Pathway ID | Tissue | Disease Stage | Description | Gene Ratio | Bg Ratio | pvalue | p.adjust | qvalue | Count |
| Page: 1 |
Top |
Cell-cell communication analysis |
| Identification of potential cell-cell interactions between two cell types and their ligand-receptor pairs for different disease states |
| Ligand | Receptor | LRpair | Pathway | Tissue | Disease Stage |
| Page: 1 |
Top |
Single-cell gene regulatory network inference analysis |
| Find out the significant the regulons (TFs) and the target genes of each regulon across cell types for different disease states |
| TF | Cell Type | Tissue | Disease Stage | Target Gene | RSS | Regulon Activity |
| ∗The dot plots of a searched regulon are shown for all cell subpopulations in each disease state of each tissue based on the regulon specific score inferred using pySCENIC and by calculating the average expression. |
| Page: 1 |
Top |
Somatic mutation of malignant transformation related genes |
| Annotation of somatic variants for genes involved in malignant transformation |
| Hugo Symbol | Variant Class | Variant Classification | dbSNP RS | HGVSc | HGVSp | HGVSp Short | SWISSPROT | BIOTYPE | SIFT | PolyPhen | Tumor Sample Barcode | Tissue | Histology | Sex | Age | Stage | Therapy Types | Drugs | Outcome |
| NIPAL2 | SNV | Missense_Mutation | novel | c.293N>T | p.Ala98Val | p.A98V | Q9H841 | protein_coding | tolerated(0.36) | benign(0.034) | TCGA-AN-A046-01 | Breast | breast invasive carcinoma | Female | >=65 | I/II | Unknown | Unknown | SD |
| NIPAL2 | insertion | Frame_Shift_Ins | novel | c.162_163insCAATCCAGATATATGATTTGCAAATATTTTC | p.Ile55GlnfsTer83 | p.I55Qfs*83 | Q9H841 | protein_coding | TCGA-A8-A075-01 | Breast | breast invasive carcinoma | Female | <65 | I/II | Chemotherapy | epirubicin | CR | ||
| NIPAL2 | deletion | Frame_Shift_Del | c.667_668delGT | p.Val223TyrfsTer17 | p.V223Yfs*17 | Q9H841 | protein_coding | TCGA-D8-A1XG-01 | Breast | breast invasive carcinoma | Female | >=65 | III/IV | Unknown | Unknown | SD | |||
| NIPAL2 | SNV | Missense_Mutation | c.586N>A | p.Leu196Ile | p.L196I | Q9H841 | protein_coding | deleterious(0.05) | probably_damaging(0.973) | TCGA-AA-3510-01 | Colorectum | colon adenocarcinoma | Male | >=65 | I/II | Unknown | Unknown | SD | |
| NIPAL2 | SNV | Missense_Mutation | novel | c.1093N>C | p.Thr365Pro | p.T365P | Q9H841 | protein_coding | deleterious(0) | benign(0.216) | TCGA-AA-3984-01 | Colorectum | colon adenocarcinoma | Female | <65 | I/II | Unknown | Unknown | SD |
| NIPAL2 | SNV | Missense_Mutation | c.753G>T | p.Met251Ile | p.M251I | Q9H841 | protein_coding | deleterious(0) | benign(0.11) | TCGA-AG-3878-01 | Colorectum | rectum adenocarcinoma | Male | <65 | I/II | Unknown | Unknown | SD | |
| NIPAL2 | SNV | Missense_Mutation | novel | c.723G>A | p.Met241Ile | p.M241I | Q9H841 | protein_coding | tolerated(0.08) | benign(0.044) | TCGA-A5-A0G2-01 | Endometrium | uterine corpus endometrioid carcinoma | Female | <65 | III/IV | Unknown | Unknown | SD |
| NIPAL2 | SNV | Missense_Mutation | novel | c.809N>G | p.Thr270Arg | p.T270R | Q9H841 | protein_coding | tolerated(0.06) | possibly_damaging(0.679) | TCGA-A5-A1OJ-01 | Endometrium | uterine corpus endometrioid carcinoma | Female | <65 | I/II | Unknown | Unknown | SD |
| NIPAL2 | SNV | Missense_Mutation | c.586C>A | p.Leu196Ile | p.L196I | Q9H841 | protein_coding | deleterious(0.05) | probably_damaging(0.973) | TCGA-AJ-A5DW-01 | Endometrium | uterine corpus endometrioid carcinoma | Female | <65 | I/II | Unknown | Unknown | SD | |
| NIPAL2 | SNV | Missense_Mutation | rs754625483 | c.191N>T | p.Ser64Phe | p.S64F | Q9H841 | protein_coding | deleterious(0) | probably_damaging(0.998) | TCGA-AP-A056-01 | Endometrium | uterine corpus endometrioid carcinoma | Female | <65 | I/II | Unknown | Unknown | SD |
| Page: 1 2 3 4 |
Top |
Related drugs of malignant transformation related genes |
| Identification of chemicals and drugs interact with genes involved in malignant transfromation |
| (DGIdb 4.0) |
| Entrez ID | Symbol | Category | Interaction Types | Drug Claim Name | Drug Name | PMIDs |
| Page: 1 |

Copyright 2023-Present -The University of Texas Health Science Center at Houston |