
|
|||||
|
 | |
| |
| |
| |
| |
| |
|
Gene: NIP7 |
Gene summary for NIP7 |
| Gene information | Species | Human | Gene symbol | NIP7 | Gene ID | 51388 |
| Gene name | nucleolar pre-rRNA processing protein NIP7 | |
| Gene Alias | CGI-37 | |
| Cytomap | 16q22.1 | |
| Gene Type | protein-coding | GO ID | GO:0006996 | UniProtAcc | Q9Y221 |
Top |
Malignant transformation analysis |
| Identification of the aberrant gene expression in precancerous and cancerous lesions by comparing the gene expression of stem-like cells in diseased tissues with normal stem cells |
| Entrez ID | Symbol | Replicates | Species | Organ | Tissue | Adj P-value | Log2FC | Malignancy |
| 51388 | NIP7 | LZE4T | Human | Esophagus | ESCC | 2.40e-08 | 2.68e-01 | 0.0811 |
| 51388 | NIP7 | LZE5T | Human | Esophagus | ESCC | 9.67e-03 | -1.16e-01 | 0.0514 |
| 51388 | NIP7 | LZE7T | Human | Esophagus | ESCC | 5.83e-03 | 2.86e-01 | 0.0667 |
| 51388 | NIP7 | LZE8T | Human | Esophagus | ESCC | 5.38e-06 | -1.28e-02 | 0.067 |
| 51388 | NIP7 | LZE20T | Human | Esophagus | ESCC | 4.49e-08 | 9.29e-02 | 0.0662 |
| 51388 | NIP7 | LZE22D1 | Human | Esophagus | HGIN | 3.19e-03 | -9.61e-02 | 0.0595 |
| 51388 | NIP7 | LZE24T | Human | Esophagus | ESCC | 7.35e-12 | 1.95e-01 | 0.0596 |
| 51388 | NIP7 | LZE6T | Human | Esophagus | ESCC | 8.78e-08 | -8.99e-02 | 0.0845 |
| 51388 | NIP7 | P1T-E | Human | Esophagus | ESCC | 7.94e-07 | 3.07e-01 | 0.0875 |
| 51388 | NIP7 | P2T-E | Human | Esophagus | ESCC | 3.68e-19 | 1.70e-01 | 0.1177 |
| 51388 | NIP7 | P4T-E | Human | Esophagus | ESCC | 6.33e-18 | 6.96e-01 | 0.1323 |
| 51388 | NIP7 | P5T-E | Human | Esophagus | ESCC | 3.28e-24 | 6.89e-01 | 0.1327 |
| 51388 | NIP7 | P8T-E | Human | Esophagus | ESCC | 2.45e-11 | 1.56e-01 | 0.0889 |
| 51388 | NIP7 | P9T-E | Human | Esophagus | ESCC | 8.17e-13 | 1.18e-01 | 0.1131 |
| 51388 | NIP7 | P10T-E | Human | Esophagus | ESCC | 2.55e-06 | 1.40e-01 | 0.116 |
| 51388 | NIP7 | P11T-E | Human | Esophagus | ESCC | 6.98e-13 | 6.52e-01 | 0.1426 |
| 51388 | NIP7 | P12T-E | Human | Esophagus | ESCC | 5.18e-12 | 2.55e-01 | 0.1122 |
| 51388 | NIP7 | P15T-E | Human | Esophagus | ESCC | 2.30e-15 | 3.35e-01 | 0.1149 |
| 51388 | NIP7 | P16T-E | Human | Esophagus | ESCC | 1.00e-24 | 2.83e-01 | 0.1153 |
| 51388 | NIP7 | P17T-E | Human | Esophagus | ESCC | 1.37e-02 | 2.95e-01 | 0.1278 |
| Page: 1 2 3 4 5 |
| Tissue | Expression Dynamics | Abbreviation |
| Esophagus |  | ESCC: Esophageal squamous cell carcinoma |
| HGIN: High-grade intraepithelial neoplasias | ||
| LGIN: Low-grade intraepithelial neoplasias | ||
| Liver |  | HCC: Hepatocellular carcinoma |
| NAFLD: Non-alcoholic fatty liver disease | ||
| Oral Cavity | 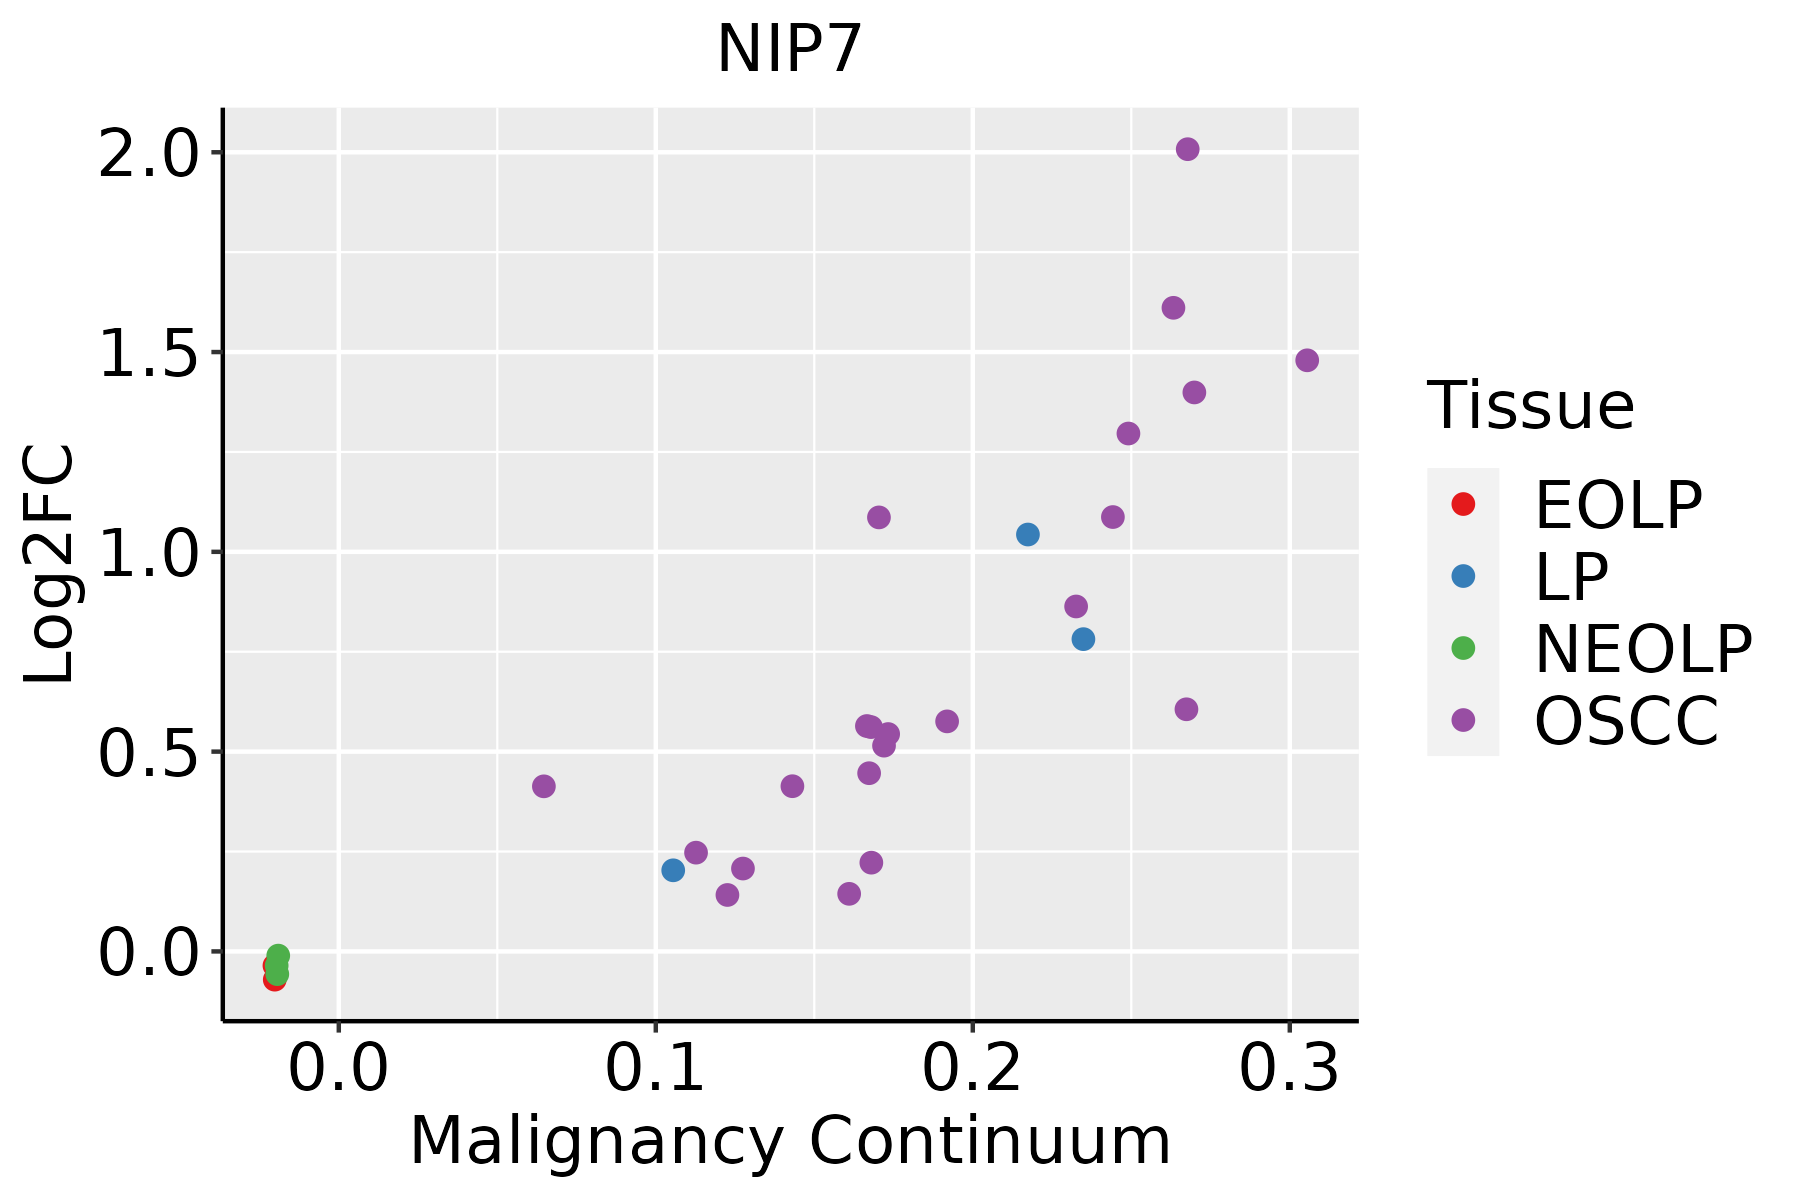 | EOLP: Erosive Oral lichen planus |
| LP: leukoplakia | ||
| NEOLP: Non-erosive oral lichen planus | ||
| OSCC: Oral squamous cell carcinoma | ||
| Skin | 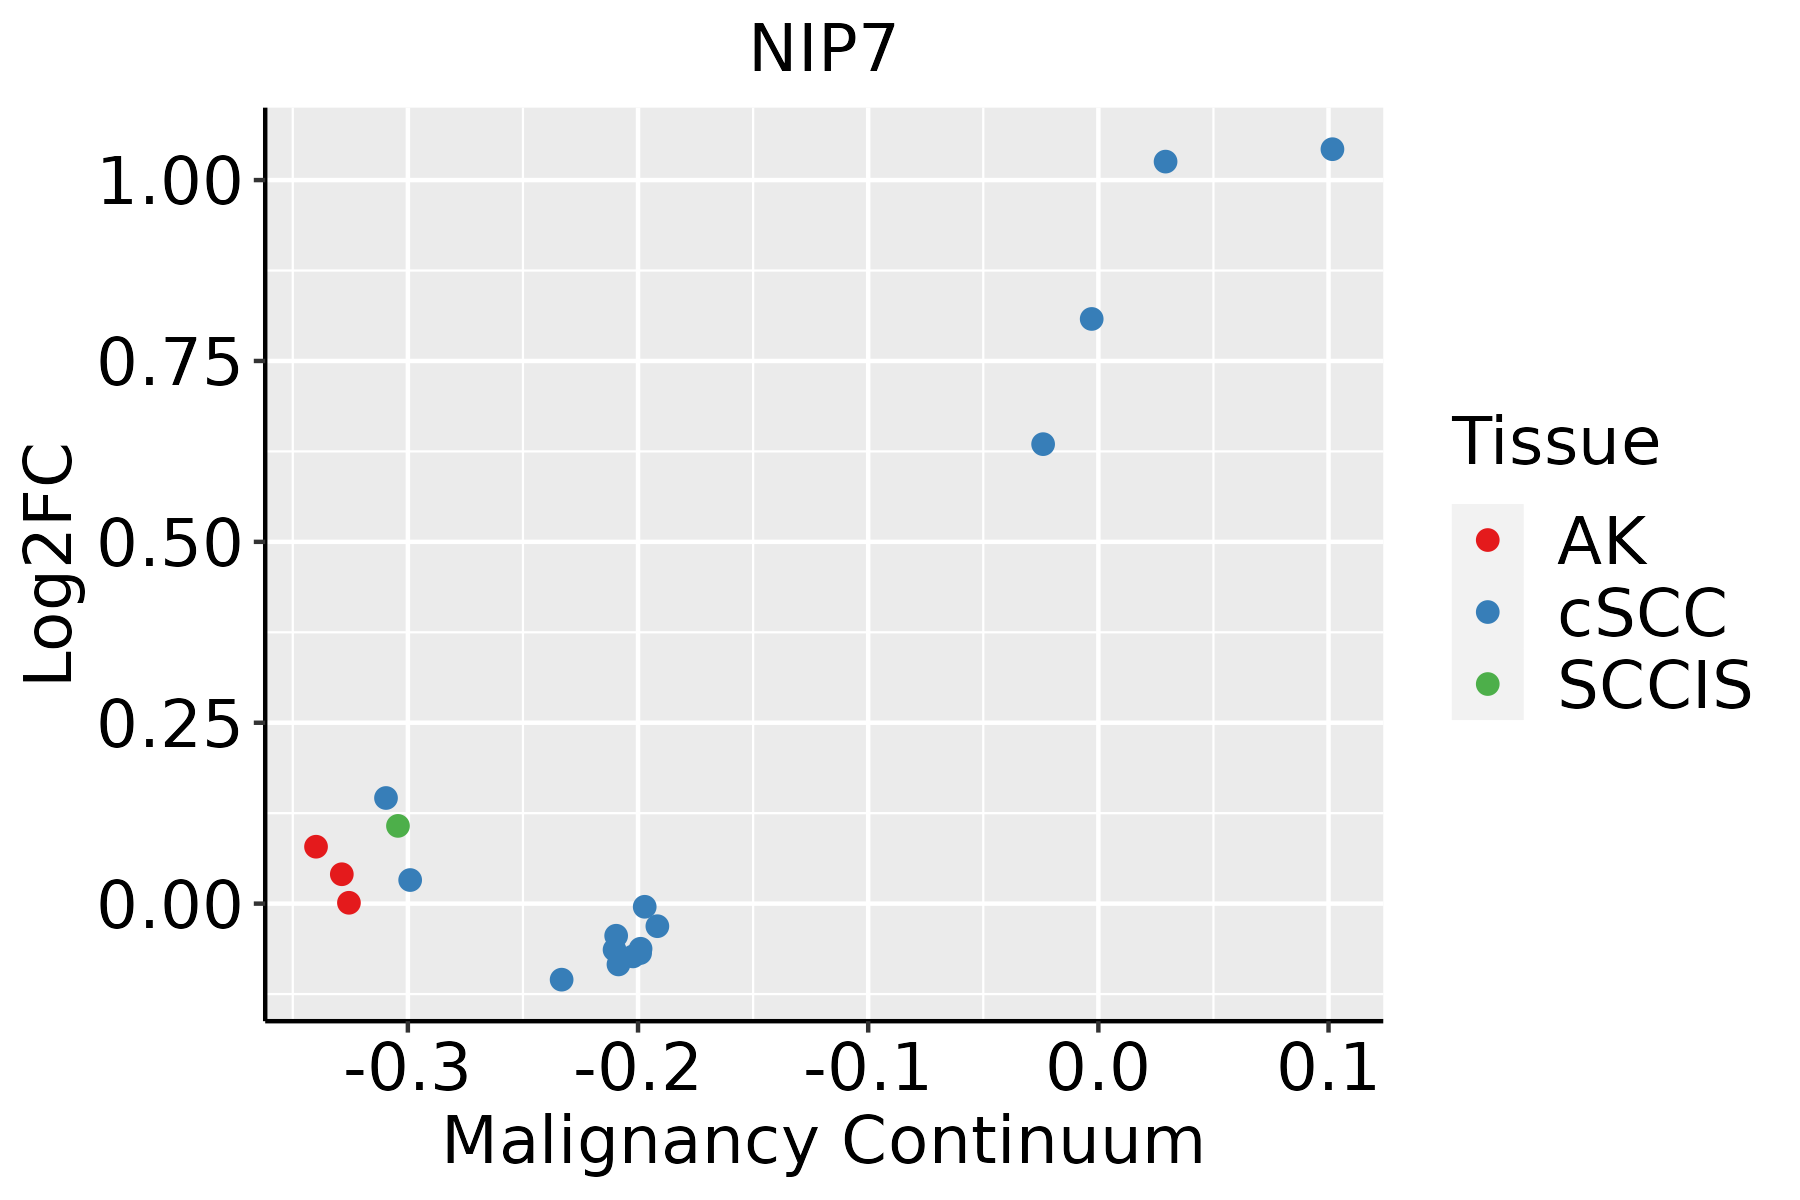 | AK: Actinic keratosis |
| cSCC: Cutaneous squamous cell carcinoma | ||
| SCCIS:squamous cell carcinoma in situ |
| ∗log2FC in expression of this searched gene in stem-like cells from each diseased tissue sample relative to stem-like cells in normal samples in each tissue plotted against the malignancy continuum. Samples are colored based on if they are from different disease stage. |
Top |
Malignant transformation related pathway analysis |
| Find out the enriched GO biological processes and KEGG pathways involved in transition from healthy to precancer to cancer |
| Tissue | Disease Stage | Enriched GO biological Processes |
| Colorectum | AD |  |
| Colorectum | SER |  |
| Colorectum | MSS |  |
| Colorectum | MSI-H |  |
| Colorectum | FAP |  |
| ∗Top 15 enriched GO BP terms are showed in the bar plot of each disease state in each tissue. Each row represents a significant GO biological process which is colored according to the -log10(p.adjust). |
| Page: 1 2 3 4 5 6 7 8 9 |
| GO ID | Tissue | Disease Stage | Description | Gene Ratio | Bg Ratio | pvalue | p.adjust | Count |
| GO:002261327 | Esophagus | HGIN | ribonucleoprotein complex biogenesis | 158/2587 | 463/18723 | 2.61e-29 | 5.23e-26 | 158 |
| GO:004225426 | Esophagus | HGIN | ribosome biogenesis | 101/2587 | 299/18723 | 8.74e-19 | 4.03e-16 | 101 |
| GO:004227326 | Esophagus | HGIN | ribosomal large subunit biogenesis | 34/2587 | 72/18723 | 8.82e-12 | 1.06e-09 | 34 |
| GO:004225527 | Esophagus | HGIN | ribosome assembly | 28/2587 | 61/18723 | 1.36e-09 | 1.07e-07 | 28 |
| GO:0022613111 | Esophagus | ESCC | ribonucleoprotein complex biogenesis | 365/8552 | 463/18723 | 1.74e-49 | 1.11e-45 | 365 |
| GO:0042254111 | Esophagus | ESCC | ribosome biogenesis | 252/8552 | 299/18723 | 3.27e-44 | 1.04e-40 | 252 |
| GO:0042273111 | Esophagus | ESCC | ribosomal large subunit biogenesis | 65/8552 | 72/18723 | 1.53e-15 | 9.82e-14 | 65 |
| GO:0042255111 | Esophagus | ESCC | ribosome assembly | 50/8552 | 61/18723 | 5.66e-09 | 1.17e-07 | 50 |
| GO:002261322 | Liver | HCC | ribonucleoprotein complex biogenesis | 355/7958 | 463/18723 | 7.76e-52 | 4.92e-48 | 355 |
| GO:004225422 | Liver | HCC | ribosome biogenesis | 246/7958 | 299/18723 | 4.99e-46 | 1.58e-42 | 246 |
| GO:004227322 | Liver | HCC | ribosomal large subunit biogenesis | 64/7958 | 72/18723 | 2.31e-16 | 2.03e-14 | 64 |
| GO:004225522 | Liver | HCC | ribosome assembly | 50/7958 | 61/18723 | 2.79e-10 | 9.50e-09 | 50 |
| GO:002261320 | Oral cavity | OSCC | ribonucleoprotein complex biogenesis | 333/7305 | 463/18723 | 8.28e-48 | 5.24e-44 | 333 |
| GO:004225420 | Oral cavity | OSCC | ribosome biogenesis | 230/7305 | 299/18723 | 3.22e-41 | 6.80e-38 | 230 |
| GO:004227320 | Oral cavity | OSCC | ribosomal large subunit biogenesis | 61/7305 | 72/18723 | 1.52e-15 | 1.06e-13 | 61 |
| GO:004225520 | Oral cavity | OSCC | ribosome assembly | 49/7305 | 61/18723 | 4.73e-11 | 1.50e-09 | 49 |
| GO:0022613110 | Oral cavity | LP | ribonucleoprotein complex biogenesis | 259/4623 | 463/18723 | 7.20e-48 | 2.25e-44 | 259 |
| GO:0042254110 | Oral cavity | LP | ribosome biogenesis | 173/4623 | 299/18723 | 8.97e-35 | 1.41e-31 | 173 |
| GO:0042273110 | Oral cavity | LP | ribosomal large subunit biogenesis | 53/4623 | 72/18723 | 3.25e-18 | 5.82e-16 | 53 |
| GO:0042255110 | Oral cavity | LP | ribosome assembly | 44/4623 | 61/18723 | 8.20e-15 | 1.05e-12 | 44 |
| Page: 1 2 |
| Pathway ID | Tissue | Disease Stage | Description | Gene Ratio | Bg Ratio | pvalue | p.adjust | qvalue | Count |
| Page: 1 |
Top |
Cell-cell communication analysis |
| Identification of potential cell-cell interactions between two cell types and their ligand-receptor pairs for different disease states |
| Ligand | Receptor | LRpair | Pathway | Tissue | Disease Stage |
| Page: 1 |
Top |
Single-cell gene regulatory network inference analysis |
| Find out the significant the regulons (TFs) and the target genes of each regulon across cell types for different disease states |
| TF | Cell Type | Tissue | Disease Stage | Target Gene | RSS | Regulon Activity |
| ∗The dot plots of a searched regulon are shown for all cell subpopulations in each disease state of each tissue based on the regulon specific score inferred using pySCENIC and by calculating the average expression. |
| Page: 1 |
Top |
Somatic mutation of malignant transformation related genes |
| Annotation of somatic variants for genes involved in malignant transformation |
| Hugo Symbol | Variant Class | Variant Classification | dbSNP RS | HGVSc | HGVSp | HGVSp Short | SWISSPROT | BIOTYPE | SIFT | PolyPhen | Tumor Sample Barcode | Tissue | Histology | Sex | Age | Stage | Therapy Types | Drugs | Outcome |
| NIP7 | SNV | Missense_Mutation | novel | c.469G>C | p.Asp157His | p.D157H | Q9Y221 | protein_coding | deleterious(0.01) | probably_damaging(0.958) | TCGA-3C-AALI-01 | Breast | breast invasive carcinoma | Female | <65 | I/II | Unspecific | Poly E | Complete Response |
| NIP7 | SNV | Missense_Mutation | c.247G>C | p.Val83Leu | p.V83L | Q9Y221 | protein_coding | deleterious(0.02) | benign(0.156) | TCGA-D8-A1JA-01 | Breast | breast invasive carcinoma | Female | <65 | III/IV | Chemotherapy | adriamycin | PD | |
| NIP7 | SNV | Missense_Mutation | novel | c.94G>C | p.Asp32His | p.D32H | Q9Y221 | protein_coding | deleterious(0) | probably_damaging(0.966) | TCGA-EA-A1QS-01 | Cervix | cervical & endocervical cancer | Female | <65 | I/II | Unknown | Unknown | SD |
| NIP7 | SNV | Missense_Mutation | novel | c.157N>G | p.Lys53Glu | p.K53E | Q9Y221 | protein_coding | deleterious(0.03) | benign(0.08) | TCGA-A6-6653-01 | Colorectum | colon adenocarcinoma | Male | >=65 | I/II | Unknown | Unknown | SD |
| NIP7 | SNV | Missense_Mutation | rs762803570 | c.301N>T | p.Pro101Ser | p.P101S | Q9Y221 | protein_coding | tolerated(0.08) | benign(0.242) | TCGA-AA-A010-01 | Colorectum | colon adenocarcinoma | Female | <65 | I/II | Chemotherapy | folinic | CR |
| NIP7 | SNV | Missense_Mutation | c.10N>G | p.Leu4Val | p.L4V | Q9Y221 | protein_coding | deleterious(0) | probably_damaging(0.924) | TCGA-AA-A01T-01 | Colorectum | colon adenocarcinoma | Female | <65 | III/IV | Chemotherapy | 5-fluorouracil | CR | |
| NIP7 | SNV | Missense_Mutation | c.472N>T | p.Pro158Ser | p.P158S | Q9Y221 | protein_coding | deleterious(0.02) | benign(0.433) | TCGA-AF-5654-01 | Colorectum | rectum adenocarcinoma | Female | >=65 | I/II | Unknown | Unknown | SD | |
| NIP7 | SNV | Missense_Mutation | novel | c.152N>G | p.Ile51Ser | p.I51S | Q9Y221 | protein_coding | deleterious(0.04) | benign(0.019) | TCGA-AP-A056-01 | Endometrium | uterine corpus endometrioid carcinoma | Female | <65 | I/II | Unknown | Unknown | SD |
| NIP7 | SNV | Missense_Mutation | c.238N>T | p.Arg80Trp | p.R80W | Q9Y221 | protein_coding | deleterious(0.01) | benign(0.007) | TCGA-AP-A059-01 | Endometrium | uterine corpus endometrioid carcinoma | Female | >=65 | I/II | Unknown | Unknown | SD | |
| NIP7 | SNV | Missense_Mutation | novel | c.91N>T | p.Pro31Ser | p.P31S | Q9Y221 | protein_coding | tolerated(0.17) | benign(0.021) | TCGA-AX-A2HC-01 | Endometrium | uterine corpus endometrioid carcinoma | Female | <65 | III/IV | Chemotherapy | paclitaxel | PD |
| Page: 1 2 |
Top |
Related drugs of malignant transformation related genes |
| Identification of chemicals and drugs interact with genes involved in malignant transfromation |
| (DGIdb 4.0) |
| Entrez ID | Symbol | Category | Interaction Types | Drug Claim Name | Drug Name | PMIDs |
| Page: 1 |

Copyright 2023-Present -The University of Texas Health Science Center at Houston |