
|
|||||
|
 | |
| |
| |
| |
| |
| |
|
Gene: NID2 |
Gene summary for NID2 |
| Gene information | Species | Human | Gene symbol | NID2 | Gene ID | 22795 |
| Gene name | nidogen 2 | |
| Gene Alias | NID-2 | |
| Cytomap | 14q22.1 | |
| Gene Type | protein-coding | GO ID | GO:0007155 | UniProtAcc | Q14112 |
Top |
Malignant transformation analysis |
| Identification of the aberrant gene expression in precancerous and cancerous lesions by comparing the gene expression of stem-like cells in diseased tissues with normal stem cells |
| Entrez ID | Symbol | Replicates | Species | Organ | Tissue | Adj P-value | Log2FC | Malignancy |
| 22795 | NID2 | Adj_PTCwithHT_6 | Human | Thyroid | HT | 3.65e-02 | -2.84e-01 | 0.02 |
| 22795 | NID2 | Adj_PTCwithHT_8 | Human | Thyroid | HT | 2.18e-03 | -2.89e-01 | 0.0267 |
| 22795 | NID2 | PTCwithHT_6 | Human | Thyroid | HT | 1.19e-03 | -2.85e-01 | 0.02 |
| 22795 | NID2 | PTCwithHT_8 | Human | Thyroid | HT | 5.43e-04 | -2.89e-01 | 0.0351 |
| 22795 | NID2 | male-WTA | Human | Thyroid | PTC | 1.57e-57 | 4.23e-01 | 0.1037 |
| 22795 | NID2 | PTC01 | Human | Thyroid | PTC | 8.99e-13 | 3.39e-03 | 0.1899 |
| 22795 | NID2 | PTC04 | Human | Thyroid | PTC | 6.94e-08 | -7.60e-02 | 0.1927 |
| 22795 | NID2 | PTC06 | Human | Thyroid | PTC | 4.83e-24 | 9.48e-01 | 0.2057 |
| 22795 | NID2 | PTC07 | Human | Thyroid | PTC | 7.73e-19 | 3.59e-01 | 0.2044 |
| 22795 | NID2 | ATC09 | Human | Thyroid | ATC | 4.01e-02 | 3.41e-01 | 0.2871 |
| 22795 | NID2 | ATC12 | Human | Thyroid | ATC | 1.50e-19 | 6.76e-01 | 0.34 |
| 22795 | NID2 | ATC13 | Human | Thyroid | ATC | 2.88e-12 | 1.91e-01 | 0.34 |
| 22795 | NID2 | ATC1 | Human | Thyroid | ATC | 2.17e-03 | 4.40e-01 | 0.2878 |
| 22795 | NID2 | ATC3 | Human | Thyroid | ATC | 3.19e-02 | -4.84e-02 | 0.338 |
| 22795 | NID2 | ATC4 | Human | Thyroid | ATC | 3.50e-26 | 8.58e-01 | 0.34 |
| 22795 | NID2 | ATC5 | Human | Thyroid | ATC | 1.19e-15 | 2.45e-01 | 0.34 |
| Page: 1 |
| Tissue | Expression Dynamics | Abbreviation |
| Thyroid | 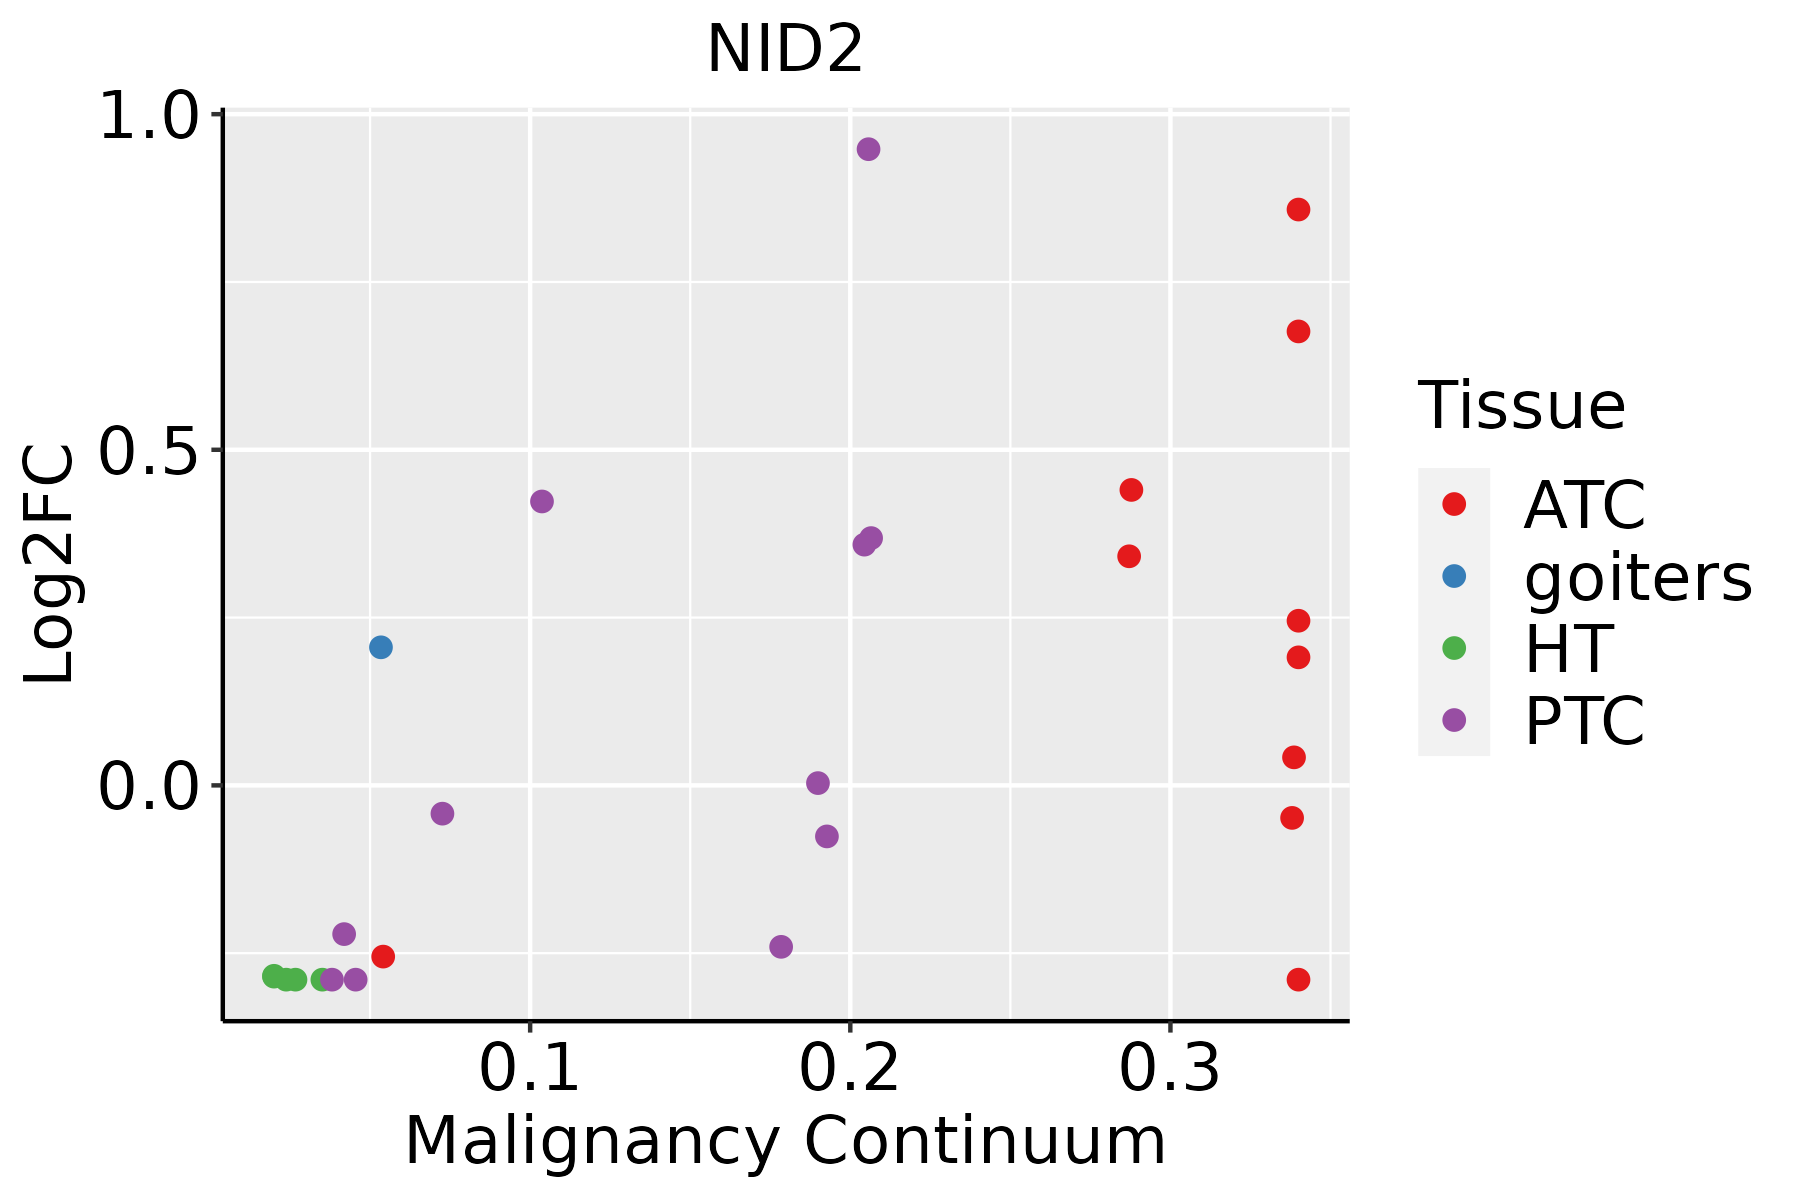 | ATC: Anaplastic thyroid cancer |
| HT: Hashimoto's thyroiditis | ||
| PTC: Papillary thyroid cancer |
| ∗log2FC in expression of this searched gene in stem-like cells from each diseased tissue sample relative to stem-like cells in normal samples in each tissue plotted against the malignancy continuum. Samples are colored based on if they are from different disease stage. |
Top |
Malignant transformation related pathway analysis |
| Find out the enriched GO biological processes and KEGG pathways involved in transition from healthy to precancer to cancer |
| Tissue | Disease Stage | Enriched GO biological Processes |
| Colorectum | AD |  |
| Colorectum | SER |  |
| Colorectum | MSS |  |
| Colorectum | MSI-H |  |
| Colorectum | FAP |  |
| ∗Top 15 enriched GO BP terms are showed in the bar plot of each disease state in each tissue. Each row represents a significant GO biological process which is colored according to the -log10(p.adjust). |
| Page: 1 2 3 4 5 6 7 8 9 |
| GO ID | Tissue | Disease Stage | Description | Gene Ratio | Bg Ratio | pvalue | p.adjust | Count |
| GO:003158927 | Thyroid | HT | cell-substrate adhesion | 41/1272 | 363/18723 | 9.54e-04 | 9.83e-03 | 41 |
| GO:0031589111 | Thyroid | PTC | cell-substrate adhesion | 169/5968 | 363/18723 | 2.73e-09 | 7.57e-08 | 169 |
| GO:000716020 | Thyroid | PTC | cell-matrix adhesion | 109/5968 | 233/18723 | 1.28e-06 | 1.84e-05 | 109 |
| GO:00301986 | Thyroid | PTC | extracellular matrix organization | 124/5968 | 301/18723 | 3.75e-04 | 2.53e-03 | 124 |
| GO:00430626 | Thyroid | PTC | extracellular structure organization | 124/5968 | 302/18723 | 4.38e-04 | 2.92e-03 | 124 |
| GO:00452296 | Thyroid | PTC | external encapsulating structure organization | 124/5968 | 304/18723 | 5.96e-04 | 3.79e-03 | 124 |
| GO:00717116 | Thyroid | PTC | basement membrane organization | 19/5968 | 31/18723 | 7.02e-04 | 4.39e-03 | 19 |
| GO:003158928 | Thyroid | ATC | cell-substrate adhesion | 195/6293 | 363/18723 | 1.58e-15 | 1.17e-13 | 195 |
| GO:0007160111 | Thyroid | ATC | cell-matrix adhesion | 128/6293 | 233/18723 | 1.49e-11 | 5.41e-10 | 128 |
| GO:003019812 | Thyroid | ATC | extracellular matrix organization | 152/6293 | 301/18723 | 8.63e-10 | 2.24e-08 | 152 |
| GO:004306212 | Thyroid | ATC | extracellular structure organization | 152/6293 | 302/18723 | 1.17e-09 | 2.94e-08 | 152 |
| GO:004522912 | Thyroid | ATC | external encapsulating structure organization | 152/6293 | 304/18723 | 2.11e-09 | 5.08e-08 | 152 |
| GO:007171113 | Thyroid | ATC | basement membrane organization | 20/6293 | 31/18723 | 4.20e-04 | 2.51e-03 | 20 |
| Page: 1 |
| Pathway ID | Tissue | Disease Stage | Description | Gene Ratio | Bg Ratio | pvalue | p.adjust | qvalue | Count |
| Page: 1 |
Top |
Cell-cell communication analysis |
| Identification of potential cell-cell interactions between two cell types and their ligand-receptor pairs for different disease states |
| Ligand | Receptor | LRpair | Pathway | Tissue | Disease Stage |
| Page: 1 |
Top |
Single-cell gene regulatory network inference analysis |
| Find out the significant the regulons (TFs) and the target genes of each regulon across cell types for different disease states |
| TF | Cell Type | Tissue | Disease Stage | Target Gene | RSS | Regulon Activity |
| ∗The dot plots of a searched regulon are shown for all cell subpopulations in each disease state of each tissue based on the regulon specific score inferred using pySCENIC and by calculating the average expression. |
| Page: 1 |
Top |
Somatic mutation of malignant transformation related genes |
| Annotation of somatic variants for genes involved in malignant transformation |
| Hugo Symbol | Variant Class | Variant Classification | dbSNP RS | HGVSc | HGVSp | HGVSp Short | SWISSPROT | BIOTYPE | SIFT | PolyPhen | Tumor Sample Barcode | Tissue | Histology | Sex | Age | Stage | Therapy Types | Drugs | Outcome |
| NID2 | SNV | Missense_Mutation | c.3276N>C | p.Met1092Ile | p.M1092I | Q14112 | protein_coding | tolerated(0.69) | benign(0) | TCGA-A2-A0SW-01 | Breast | breast invasive carcinoma | Female | >=65 | III/IV | Hormone Therapy | arimidex | PD | |
| NID2 | SNV | Missense_Mutation | c.3655N>A | p.Glu1219Lys | p.E1219K | Q14112 | protein_coding | tolerated(0.16) | benign(0.304) | TCGA-AC-A23H-01 | Breast | breast invasive carcinoma | Female | >=65 | I/II | Unknown | Unknown | PD | |
| NID2 | SNV | Missense_Mutation | novel | c.2066N>C | p.Phe689Ser | p.F689S | Q14112 | protein_coding | tolerated(0.44) | benign(0.006) | TCGA-AN-A046-01 | Breast | breast invasive carcinoma | Female | >=65 | I/II | Unknown | Unknown | SD |
| NID2 | SNV | Missense_Mutation | novel | c.592N>A | p.Leu198Ile | p.L198I | Q14112 | protein_coding | deleterious(0) | probably_damaging(0.927) | TCGA-AN-A046-01 | Breast | breast invasive carcinoma | Female | >=65 | I/II | Unknown | Unknown | SD |
| NID2 | SNV | Missense_Mutation | c.440N>G | p.Ser147Cys | p.S147C | Q14112 | protein_coding | deleterious(0.01) | benign(0.43) | TCGA-C8-A26Y-01 | Breast | breast invasive carcinoma | Female | >=65 | I/II | Unknown | Unknown | SD | |
| NID2 | SNV | Missense_Mutation | c.1840N>A | p.His614Asn | p.H614N | Q14112 | protein_coding | tolerated(0.09) | benign(0.012) | TCGA-D8-A1XK-01 | Breast | breast invasive carcinoma | Female | <65 | I/II | Chemotherapy | doxorubicine+cyclophosphamide | SD | |
| NID2 | SNV | Missense_Mutation | rs772923728 | c.2950N>A | p.Val984Met | p.V984M | Q14112 | protein_coding | deleterious(0.03) | probably_damaging(0.997) | TCGA-E2-A15H-01 | Breast | breast invasive carcinoma | Female | <65 | I/II | Chemotherapy | herceptin | SD |
| NID2 | insertion | Nonsense_Mutation | novel | c.3983_3984insAAATATGTTCTTTAGAGAATAAGACTACCCTTGATACCATGAGC | p.Phe1328LeufsTer8 | p.F1328Lfs*8 | Q14112 | protein_coding | TCGA-A8-A09Z-01 | Breast | breast invasive carcinoma | Female | >=65 | I/II | Unknown | Unknown | SD | ||
| NID2 | insertion | Nonsense_Mutation | novel | c.291_292insTTATAACTTGCTTTTTTCACAGAATA | p.Asp98LeufsTer2 | p.D98Lfs*2 | Q14112 | protein_coding | TCGA-AN-A03X-01 | Breast | breast invasive carcinoma | Female | >=65 | I/II | Unknown | Unknown | SD | ||
| NID2 | insertion | Frame_Shift_Ins | novel | c.2133_2134insCCTCATGGCTCTGCTGTTCCACAGTGGCCTCATGA | p.Ala712ProfsTer25 | p.A712Pfs*25 | Q14112 | protein_coding | TCGA-AO-A03R-01 | Breast | breast invasive carcinoma | Female | <65 | I/II | Chemotherapy | doxorubicin | SD |
| Page: 1 2 3 4 5 6 7 8 9 10 11 12 13 14 15 16 17 18 19 20 21 22 |
Top |
Related drugs of malignant transformation related genes |
| Identification of chemicals and drugs interact with genes involved in malignant transfromation |
| (DGIdb 4.0) |
| Entrez ID | Symbol | Category | Interaction Types | Drug Claim Name | Drug Name | PMIDs |
| Page: 1 |

Copyright 2023-Present -The University of Texas Health Science Center at Houston |