
|
|||||
|
 | |
| |
| |
| |
| |
| |
|
Gene: NICN1 |
Gene summary for NICN1 |
| Gene information | Species | Human | Gene symbol | NICN1 | Gene ID | 84276 |
| Gene name | nicolin 1 | |
| Gene Alias | NICN1 | |
| Cytomap | 3p21.31 | |
| Gene Type | protein-coding | GO ID | GO:0005575 | UniProtAcc | B2R7Q3 |
Top |
Malignant transformation analysis |
| Identification of the aberrant gene expression in precancerous and cancerous lesions by comparing the gene expression of stem-like cells in diseased tissues with normal stem cells |
| Entrez ID | Symbol | Replicates | Species | Organ | Tissue | Adj P-value | Log2FC | Malignancy |
| 84276 | NICN1 | HCC1_Meng | Human | Liver | HCC | 1.73e-10 | -1.78e-02 | 0.0246 |
| 84276 | NICN1 | HCC1 | Human | Liver | HCC | 5.74e-11 | 2.20e+00 | 0.5336 |
| 84276 | NICN1 | HCC2 | Human | Liver | HCC | 6.76e-13 | 1.94e+00 | 0.5341 |
| 84276 | NICN1 | HCC5 | Human | Liver | HCC | 7.52e-04 | 1.80e+00 | 0.4932 |
| Page: 1 |
| Tissue | Expression Dynamics | Abbreviation |
| Liver | 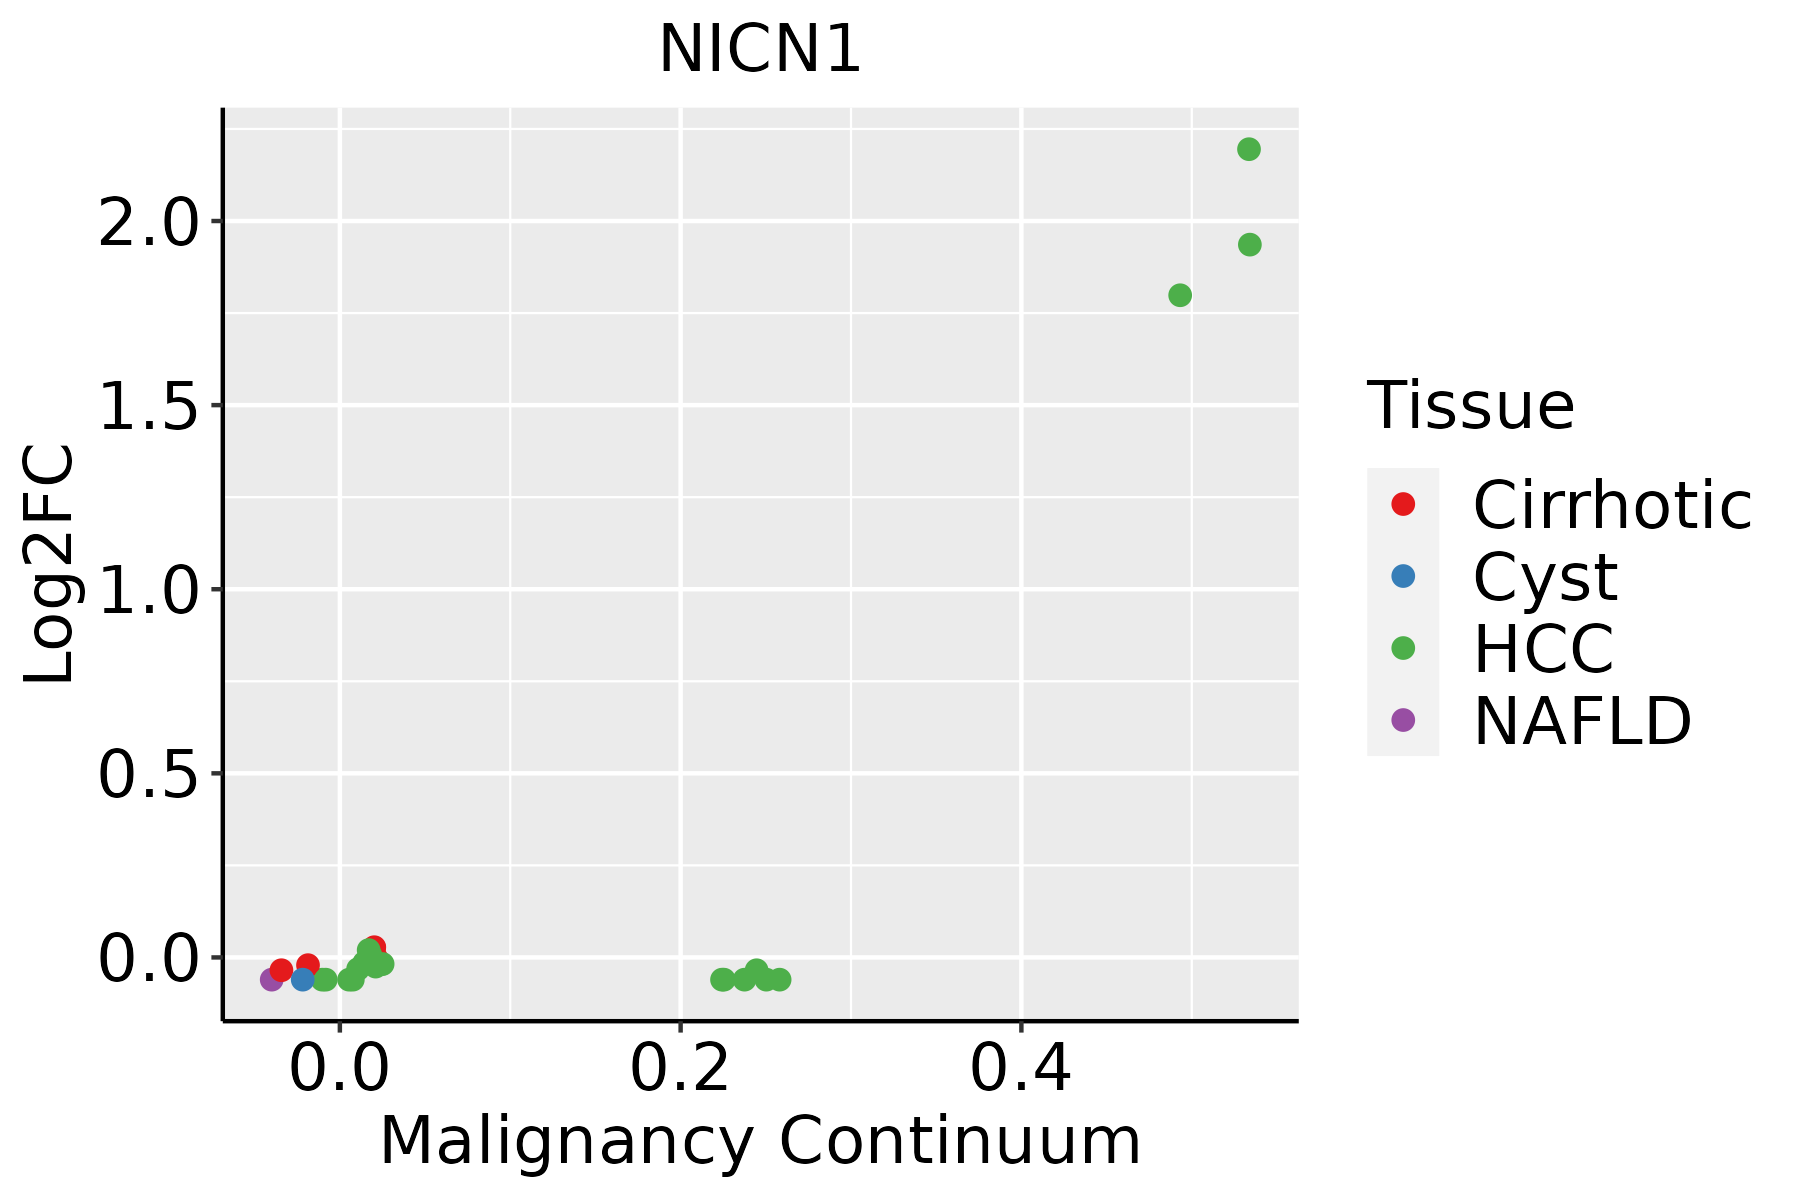 | HCC: Hepatocellular carcinoma |
| NAFLD: Non-alcoholic fatty liver disease |
| ∗log2FC in expression of this searched gene in stem-like cells from each diseased tissue sample relative to stem-like cells in normal samples in each tissue plotted against the malignancy continuum. Samples are colored based on if they are from different disease stage. |
Top |
Malignant transformation related pathway analysis |
| Find out the enriched GO biological processes and KEGG pathways involved in transition from healthy to precancer to cancer |
| Tissue | Disease Stage | Enriched GO biological Processes |
| Colorectum | AD |  |
| Colorectum | SER |  |
| Colorectum | MSS |  |
| Colorectum | MSI-H |  |
| Colorectum | FAP |  |
| ∗Top 15 enriched GO BP terms are showed in the bar plot of each disease state in each tissue. Each row represents a significant GO biological process which is colored according to the -log10(p.adjust). |
| Page: 1 2 3 4 5 6 7 8 9 |
| GO ID | Tissue | Disease Stage | Description | Gene Ratio | Bg Ratio | pvalue | p.adjust | Count |
| Page: 1 |
| Pathway ID | Tissue | Disease Stage | Description | Gene Ratio | Bg Ratio | pvalue | p.adjust | qvalue | Count |
| Page: 1 |
Top |
Cell-cell communication analysis |
| Identification of potential cell-cell interactions between two cell types and their ligand-receptor pairs for different disease states |
| Ligand | Receptor | LRpair | Pathway | Tissue | Disease Stage |
| Page: 1 |
Top |
Single-cell gene regulatory network inference analysis |
| Find out the significant the regulons (TFs) and the target genes of each regulon across cell types for different disease states |
| TF | Cell Type | Tissue | Disease Stage | Target Gene | RSS | Regulon Activity |
| ∗The dot plots of a searched regulon are shown for all cell subpopulations in each disease state of each tissue based on the regulon specific score inferred using pySCENIC and by calculating the average expression. |
| Page: 1 |
Top |
Somatic mutation of malignant transformation related genes |
| Annotation of somatic variants for genes involved in malignant transformation |
| Hugo Symbol | Variant Class | Variant Classification | dbSNP RS | HGVSc | HGVSp | HGVSp Short | SWISSPROT | BIOTYPE | SIFT | PolyPhen | Tumor Sample Barcode | Tissue | Histology | Sex | Age | Stage | Therapy Types | Drugs | Outcome |
| NICN1 | SNV | Missense_Mutation | novel | c.16N>C | p.Val6Leu | p.V6L | Q9BSH3 | protein_coding | deleterious(0.01) | benign(0.011) | TCGA-LL-A740-01 | Breast | breast invasive carcinoma | Female | <65 | I/II | Chemotherapy | adriamycin | CR |
| NICN1 | SNV | Missense_Mutation | novel | c.304N>T | p.His102Tyr | p.H102Y | Q9BSH3 | protein_coding | tolerated(0.16) | benign(0.135) | TCGA-DG-A2KJ-01 | Cervix | cervical & endocervical cancer | Female | <65 | III/IV | Chemotherapy | cisplatin | SD |
| NICN1 | SNV | Missense_Mutation | c.491N>A | p.Arg164His | p.R164H | Q9BSH3 | protein_coding | tolerated(0.6) | benign(0.121) | TCGA-A6-2672-01 | Colorectum | colon adenocarcinoma | Female | >=65 | III/IV | Unknown | Unknown | SD | |
| NICN1 | SNV | Missense_Mutation | c.580N>A | p.Ala194Thr | p.A194T | Q9BSH3 | protein_coding | tolerated(0.24) | benign(0.001) | TCGA-AA-3510-01 | Colorectum | colon adenocarcinoma | Male | >=65 | I/II | Unknown | Unknown | SD | |
| NICN1 | SNV | Missense_Mutation | c.166N>T | p.Ala56Ser | p.A56S | Q9BSH3 | protein_coding | deleterious(0.01) | probably_damaging(0.994) | TCGA-G4-6588-01 | Colorectum | colon adenocarcinoma | Female | <65 | I/II | Unknown | Unknown | SD | |
| NICN1 | SNV | Missense_Mutation | c.181N>A | p.Arg61Ser | p.R61S | Q9BSH3 | protein_coding | deleterious(0) | possibly_damaging(0.779) | TCGA-AG-A02N-01 | Colorectum | rectum adenocarcinoma | Male | >=65 | I/II | Chemotherapy | folinic | CR | |
| NICN1 | SNV | Missense_Mutation | novel | c.423N>T | p.Lys141Asn | p.K141N | Q9BSH3 | protein_coding | tolerated(0.27) | benign(0.215) | TCGA-A5-A0G2-01 | Endometrium | uterine corpus endometrioid carcinoma | Female | <65 | III/IV | Unknown | Unknown | SD |
| NICN1 | SNV | Missense_Mutation | novel | c.340C>A | p.Leu114Ile | p.L114I | Q9BSH3 | protein_coding | tolerated(0.21) | possibly_damaging(0.546) | TCGA-AP-A05O-01 | Endometrium | uterine corpus endometrioid carcinoma | Female | >=65 | I/II | Chemotherapy | carboplatin | PD |
| NICN1 | SNV | Missense_Mutation | c.153N>T | p.Lys51Asn | p.K51N | Q9BSH3 | protein_coding | deleterious(0.01) | probably_damaging(0.996) | TCGA-AX-A0J0-01 | Endometrium | uterine corpus endometrioid carcinoma | Female | <65 | I/II | Unknown | Unknown | SD | |
| NICN1 | SNV | Missense_Mutation | novel | c.628N>T | p.Leu210Phe | p.L210F | Q9BSH3 | protein_coding | deleterious(0) | probably_damaging(0.998) | TCGA-AX-A1CE-01 | Endometrium | uterine corpus endometrioid carcinoma | Female | <65 | I/II | Unspecific | Paclitaxel | SD |
| Page: 1 2 |
Top |
Related drugs of malignant transformation related genes |
| Identification of chemicals and drugs interact with genes involved in malignant transfromation |
| (DGIdb 4.0) |
| Entrez ID | Symbol | Category | Interaction Types | Drug Claim Name | Drug Name | PMIDs |
| Page: 1 |

Copyright 2023-Present -The University of Texas Health Science Center at Houston |