
|
|||||
|
 | |
| |
| |
| |
| |
| |
|
Gene: NIBAN2 |
Gene summary for NIBAN2 |
| Gene information | Species | Human | Gene symbol | NIBAN2 | Gene ID | 64855 |
| Gene name | niban apoptosis regulator 2 | |
| Gene Alias | C9orf88 | |
| Cytomap | 9q34.11 | |
| Gene Type | protein-coding | GO ID | GO:0000902 | UniProtAcc | A0A024R872 |
Top |
Malignant transformation analysis |
| Identification of the aberrant gene expression in precancerous and cancerous lesions by comparing the gene expression of stem-like cells in diseased tissues with normal stem cells |
| Entrez ID | Symbol | Replicates | Species | Organ | Tissue | Adj P-value | Log2FC | Malignancy |
| 64855 | NIBAN2 | CA_HPV_1 | Human | Cervix | CC | 8.99e-03 | -1.34e-01 | 0.0264 |
| 64855 | NIBAN2 | CCI_2 | Human | Cervix | CC | 1.99e-10 | 1.21e+00 | 0.5249 |
| 64855 | NIBAN2 | CCI_3 | Human | Cervix | CC | 1.26e-04 | 7.80e-01 | 0.516 |
| 64855 | NIBAN2 | Tumor | Human | Cervix | CC | 2.75e-23 | -4.06e-01 | 0.1241 |
| 64855 | NIBAN2 | sample3 | Human | Cervix | CC | 7.54e-06 | 2.32e-01 | 0.1387 |
| 64855 | NIBAN2 | H2 | Human | Cervix | HSIL_HPV | 7.49e-16 | 6.61e-01 | 0.0632 |
| 64855 | NIBAN2 | L1 | Human | Cervix | CC | 3.51e-07 | 3.03e-01 | 0.0802 |
| 64855 | NIBAN2 | HTA11_3410_2000001011 | Human | Colorectum | AD | 9.94e-30 | 4.97e-01 | 0.0155 |
| 64855 | NIBAN2 | HTA11_2487_2000001011 | Human | Colorectum | SER | 7.46e-50 | 1.28e+00 | -0.1808 |
| 64855 | NIBAN2 | HTA11_2951_2000001011 | Human | Colorectum | AD | 1.20e-12 | 5.85e-01 | 0.0216 |
| 64855 | NIBAN2 | HTA11_1938_2000001011 | Human | Colorectum | AD | 2.81e-48 | 1.20e+00 | -0.0811 |
| 64855 | NIBAN2 | HTA11_78_2000001011 | Human | Colorectum | AD | 8.91e-33 | 7.20e-01 | -0.1088 |
| 64855 | NIBAN2 | HTA11_347_2000001011 | Human | Colorectum | AD | 4.26e-69 | 1.11e+00 | -0.1954 |
| 64855 | NIBAN2 | HTA11_411_2000001011 | Human | Colorectum | SER | 3.87e-32 | 1.62e+00 | -0.2602 |
| 64855 | NIBAN2 | HTA11_2112_2000001011 | Human | Colorectum | SER | 7.50e-21 | 1.07e+00 | -0.2196 |
| 64855 | NIBAN2 | HTA11_3361_2000001011 | Human | Colorectum | AD | 2.22e-42 | 1.22e+00 | -0.1207 |
| 64855 | NIBAN2 | HTA11_83_2000001011 | Human | Colorectum | SER | 2.66e-34 | 9.92e-01 | -0.1526 |
| 64855 | NIBAN2 | HTA11_696_2000001011 | Human | Colorectum | AD | 2.19e-76 | 1.29e+00 | -0.1464 |
| 64855 | NIBAN2 | HTA11_866_2000001011 | Human | Colorectum | AD | 3.73e-54 | 8.91e-01 | -0.1001 |
| 64855 | NIBAN2 | HTA11_1391_2000001011 | Human | Colorectum | AD | 6.83e-56 | 1.21e+00 | -0.059 |
| Page: 1 2 3 4 |
| Tissue | Expression Dynamics | Abbreviation |
| Cervix |  | CC: Cervix cancer |
| HSIL_HPV: HPV-infected high-grade squamous intraepithelial lesions | ||
| N_HPV: HPV-infected normal cervix | ||
| Colorectum (GSE201348) |  | FAP: Familial adenomatous polyposis |
| CRC: Colorectal cancer | ||
| Colorectum (HTA11) |  | AD: Adenomas |
| SER: Sessile serrated lesions | ||
| MSI-H: Microsatellite-high colorectal cancer | ||
| MSS: Microsatellite stable colorectal cancer | ||
| Esophagus | 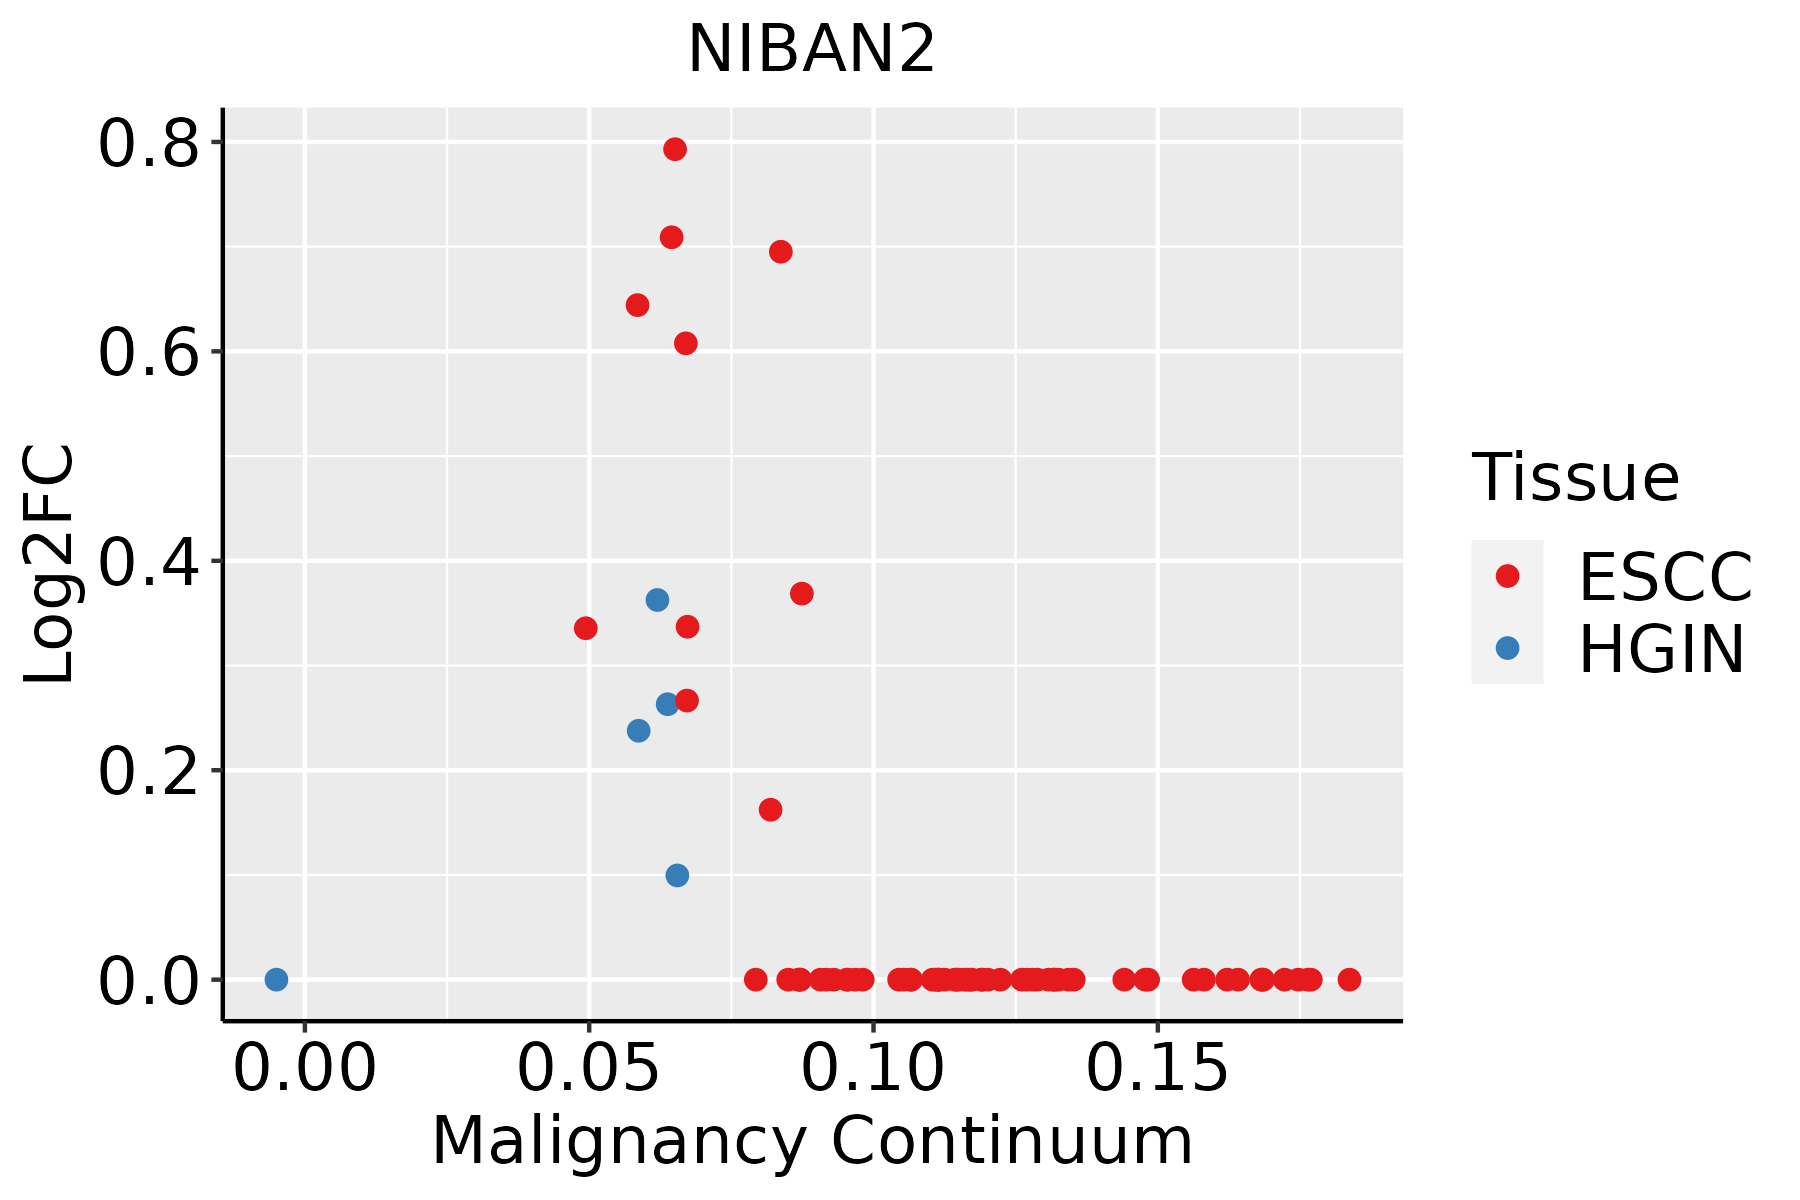 | ESCC: Esophageal squamous cell carcinoma |
| HGIN: High-grade intraepithelial neoplasias | ||
| LGIN: Low-grade intraepithelial neoplasias | ||
| Lung | 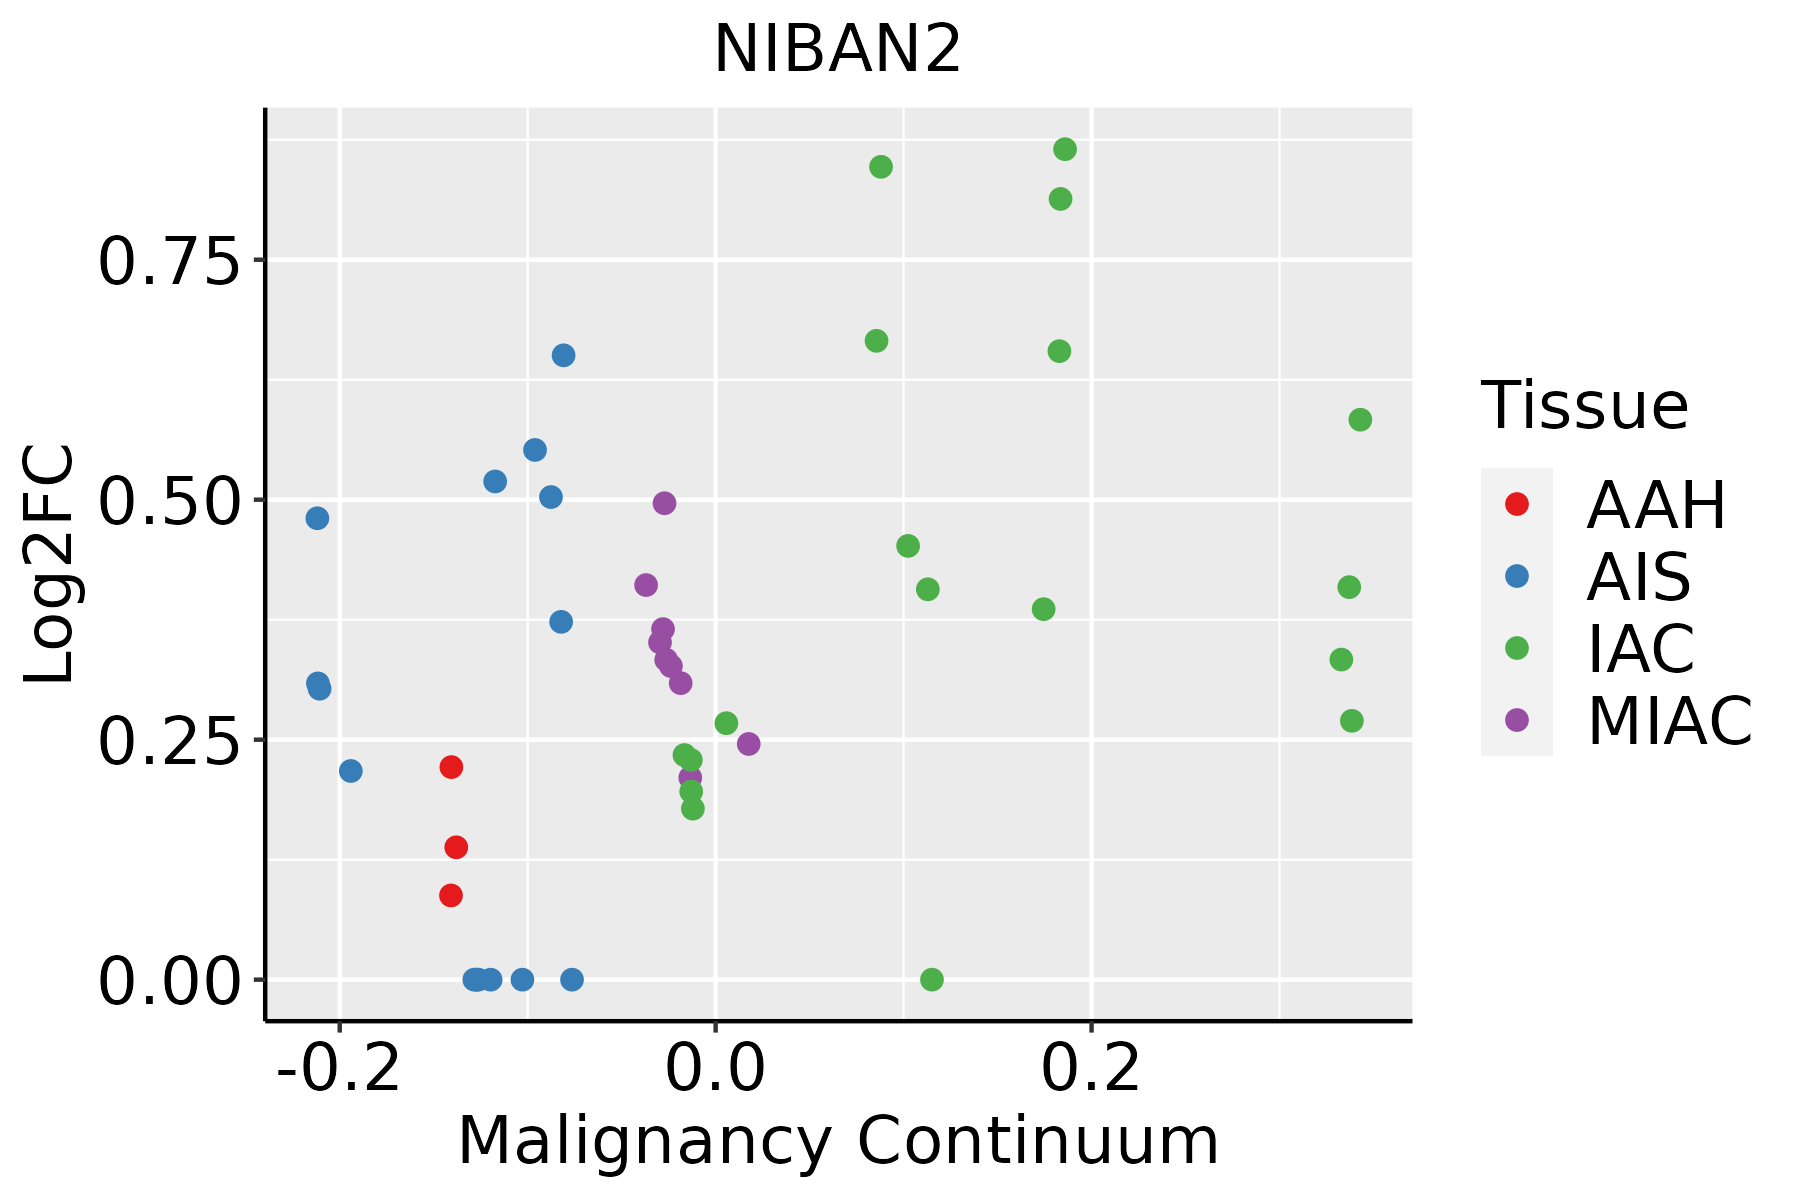 | AAH: Atypical adenomatous hyperplasia |
| AIS: Adenocarcinoma in situ | ||
| IAC: Invasive lung adenocarcinoma | ||
| MIA: Minimally invasive adenocarcinoma |
| ∗log2FC in expression of this searched gene in stem-like cells from each diseased tissue sample relative to stem-like cells in normal samples in each tissue plotted against the malignancy continuum. Samples are colored based on if they are from different disease stage. |
Top |
Malignant transformation related pathway analysis |
| Find out the enriched GO biological processes and KEGG pathways involved in transition from healthy to precancer to cancer |
| Tissue | Disease Stage | Enriched GO biological Processes |
| Colorectum | AD |  |
| Colorectum | SER |  |
| Colorectum | MSS |  |
| Colorectum | MSI-H |  |
| Colorectum | FAP |  |
| ∗Top 15 enriched GO BP terms are showed in the bar plot of each disease state in each tissue. Each row represents a significant GO biological process which is colored according to the -log10(p.adjust). |
| Page: 1 2 3 4 5 6 7 8 9 |
| GO ID | Tissue | Disease Stage | Description | Gene Ratio | Bg Ratio | pvalue | p.adjust | Count |
| GO:005109810 | Cervix | CC | regulation of binding | 80/2311 | 363/18723 | 1.32e-07 | 6.42e-06 | 80 |
| GO:00107206 | Cervix | CC | positive regulation of cell development | 64/2311 | 298/18723 | 5.69e-06 | 1.41e-04 | 64 |
| GO:005109910 | Cervix | CC | positive regulation of binding | 42/2311 | 173/18723 | 1.07e-05 | 2.33e-04 | 42 |
| GO:00615647 | Cervix | CC | axon development | 89/2311 | 467/18723 | 1.71e-05 | 3.27e-04 | 89 |
| GO:005110110 | Cervix | CC | regulation of DNA binding | 31/2311 | 118/18723 | 2.91e-05 | 4.81e-04 | 31 |
| GO:00605375 | Cervix | CC | muscle tissue development | 76/2311 | 403/18723 | 9.76e-05 | 1.27e-03 | 76 |
| GO:00072194 | Cervix | CC | Notch signaling pathway | 39/2311 | 172/18723 | 1.08e-04 | 1.38e-03 | 39 |
| GO:00074097 | Cervix | CC | axonogenesis | 78/2311 | 418/18723 | 1.14e-04 | 1.43e-03 | 78 |
| GO:00085933 | Cervix | CC | regulation of Notch signaling pathway | 25/2311 | 95/18723 | 1.61e-04 | 1.93e-03 | 25 |
| GO:00147064 | Cervix | CC | striated muscle tissue development | 72/2311 | 384/18723 | 1.76e-04 | 2.07e-03 | 72 |
| GO:00459955 | Cervix | CC | regulation of embryonic development | 19/2311 | 64/18723 | 1.78e-04 | 2.09e-03 | 19 |
| GO:00426924 | Cervix | CC | muscle cell differentiation | 69/2311 | 384/18723 | 8.12e-04 | 7.09e-03 | 69 |
| GO:00510528 | Cervix | CC | regulation of DNA metabolic process | 65/2311 | 359/18723 | 9.25e-04 | 7.84e-03 | 65 |
| GO:00433888 | Cervix | CC | positive regulation of DNA binding | 15/2311 | 56/18723 | 2.60e-03 | 1.80e-02 | 15 |
| GO:00075173 | Cervix | CC | muscle organ development | 58/2311 | 327/18723 | 2.73e-03 | 1.85e-02 | 58 |
| GO:19013423 | Cervix | CC | regulation of vasculature development | 60/2311 | 348/18723 | 4.48e-03 | 2.72e-02 | 60 |
| GO:20002789 | Cervix | CC | regulation of DNA biosynthetic process | 23/2311 | 106/18723 | 4.65e-03 | 2.81e-02 | 23 |
| GO:00457653 | Cervix | CC | regulation of angiogenesis | 59/2311 | 342/18723 | 4.73e-03 | 2.83e-02 | 59 |
| GO:00511464 | Cervix | CC | striated muscle cell differentiation | 50/2311 | 283/18723 | 5.53e-03 | 3.19e-02 | 50 |
| GO:00075192 | Cervix | CC | skeletal muscle tissue development | 30/2311 | 155/18723 | 7.97e-03 | 4.18e-02 | 30 |
| Page: 1 2 3 4 5 6 |
| Pathway ID | Tissue | Disease Stage | Description | Gene Ratio | Bg Ratio | pvalue | p.adjust | qvalue | Count |
| Page: 1 |
Top |
Cell-cell communication analysis |
| Identification of potential cell-cell interactions between two cell types and their ligand-receptor pairs for different disease states |
| Ligand | Receptor | LRpair | Pathway | Tissue | Disease Stage |
| Page: 1 |
Top |
Single-cell gene regulatory network inference analysis |
| Find out the significant the regulons (TFs) and the target genes of each regulon across cell types for different disease states |
| TF | Cell Type | Tissue | Disease Stage | Target Gene | RSS | Regulon Activity |
| ∗The dot plots of a searched regulon are shown for all cell subpopulations in each disease state of each tissue based on the regulon specific score inferred using pySCENIC and by calculating the average expression. |
| Page: 1 |
Top |
Somatic mutation of malignant transformation related genes |
| Annotation of somatic variants for genes involved in malignant transformation |
| Hugo Symbol | Variant Class | Variant Classification | dbSNP RS | HGVSc | HGVSp | HGVSp Short | SWISSPROT | BIOTYPE | SIFT | PolyPhen | Tumor Sample Barcode | Tissue | Histology | Sex | Age | Stage | Therapy Types | Drugs | Outcome |
| Page: 1 |
Top |
Related drugs of malignant transformation related genes |
| Identification of chemicals and drugs interact with genes involved in malignant transfromation |
| (DGIdb 4.0) |
| Entrez ID | Symbol | Category | Interaction Types | Drug Claim Name | Drug Name | PMIDs |
| Page: 1 |

Copyright 2023-Present -The University of Texas Health Science Center at Houston |