
|
|||||
|
 | |
| |
| |
| |
| |
| |
|
Gene: NHLRC3 |
Gene summary for NHLRC3 |
| Gene information | Species | Human | Gene symbol | NHLRC3 | Gene ID | 387921 |
| Gene name | NHL repeat containing 3 | |
| Gene Alias | NHLRC3 | |
| Cytomap | 13q13.3 | |
| Gene Type | protein-coding | GO ID | GO:0000209 | UniProtAcc | Q5JS37 |
Top |
Malignant transformation analysis |
| Identification of the aberrant gene expression in precancerous and cancerous lesions by comparing the gene expression of stem-like cells in diseased tissues with normal stem cells |
| Entrez ID | Symbol | Replicates | Species | Organ | Tissue | Adj P-value | Log2FC | Malignancy |
| 387921 | NHLRC3 | HTA11_347_2000001011 | Human | Colorectum | AD | 4.75e-02 | 2.87e-01 | -0.1954 |
| 387921 | NHLRC3 | HTA11_99999965104_69814 | Human | Colorectum | MSS | 2.74e-05 | 6.43e-01 | 0.281 |
| 387921 | NHLRC3 | HTA11_99999971662_82457 | Human | Colorectum | MSS | 1.04e-09 | 6.40e-01 | 0.3859 |
| 387921 | NHLRC3 | A015-C-203 | Human | Colorectum | FAP | 6.03e-07 | -2.15e-01 | -0.1294 |
| 387921 | NHLRC3 | A015-C-204 | Human | Colorectum | FAP | 4.92e-03 | -2.11e-01 | -0.0228 |
| 387921 | NHLRC3 | A002-C-201 | Human | Colorectum | FAP | 2.74e-04 | -1.75e-01 | 0.0324 |
| 387921 | NHLRC3 | A001-C-108 | Human | Colorectum | FAP | 2.75e-05 | -1.74e-01 | -0.0272 |
| 387921 | NHLRC3 | A002-C-205 | Human | Colorectum | FAP | 3.93e-06 | -1.79e-01 | -0.1236 |
| 387921 | NHLRC3 | A015-C-006 | Human | Colorectum | FAP | 1.05e-04 | -1.88e-01 | -0.0994 |
| 387921 | NHLRC3 | A015-C-106 | Human | Colorectum | FAP | 3.16e-02 | -1.13e-01 | -0.0511 |
| 387921 | NHLRC3 | A002-C-114 | Human | Colorectum | FAP | 3.60e-06 | -2.39e-01 | -0.1561 |
| 387921 | NHLRC3 | A015-C-104 | Human | Colorectum | FAP | 3.02e-08 | -2.07e-01 | -0.1899 |
| 387921 | NHLRC3 | A001-C-014 | Human | Colorectum | FAP | 4.03e-03 | -1.69e-01 | 0.0135 |
| 387921 | NHLRC3 | A002-C-016 | Human | Colorectum | FAP | 1.97e-06 | -1.62e-01 | 0.0521 |
| 387921 | NHLRC3 | A015-C-002 | Human | Colorectum | FAP | 2.10e-02 | -1.14e-01 | -0.0763 |
| 387921 | NHLRC3 | A002-C-116 | Human | Colorectum | FAP | 4.08e-10 | -2.27e-01 | -0.0452 |
| 387921 | NHLRC3 | A014-C-008 | Human | Colorectum | FAP | 3.20e-03 | -1.65e-01 | -0.191 |
| 387921 | NHLRC3 | A018-E-020 | Human | Colorectum | FAP | 2.30e-05 | -1.71e-01 | -0.2034 |
| 387921 | NHLRC3 | F034 | Human | Colorectum | FAP | 2.11e-05 | -1.69e-01 | -0.0665 |
| 387921 | NHLRC3 | CRC-1-8810 | Human | Colorectum | CRC | 2.21e-05 | 3.96e-01 | 0.6257 |
| Page: 1 2 3 |
| Tissue | Expression Dynamics | Abbreviation |
| Colorectum (GSE201348) | 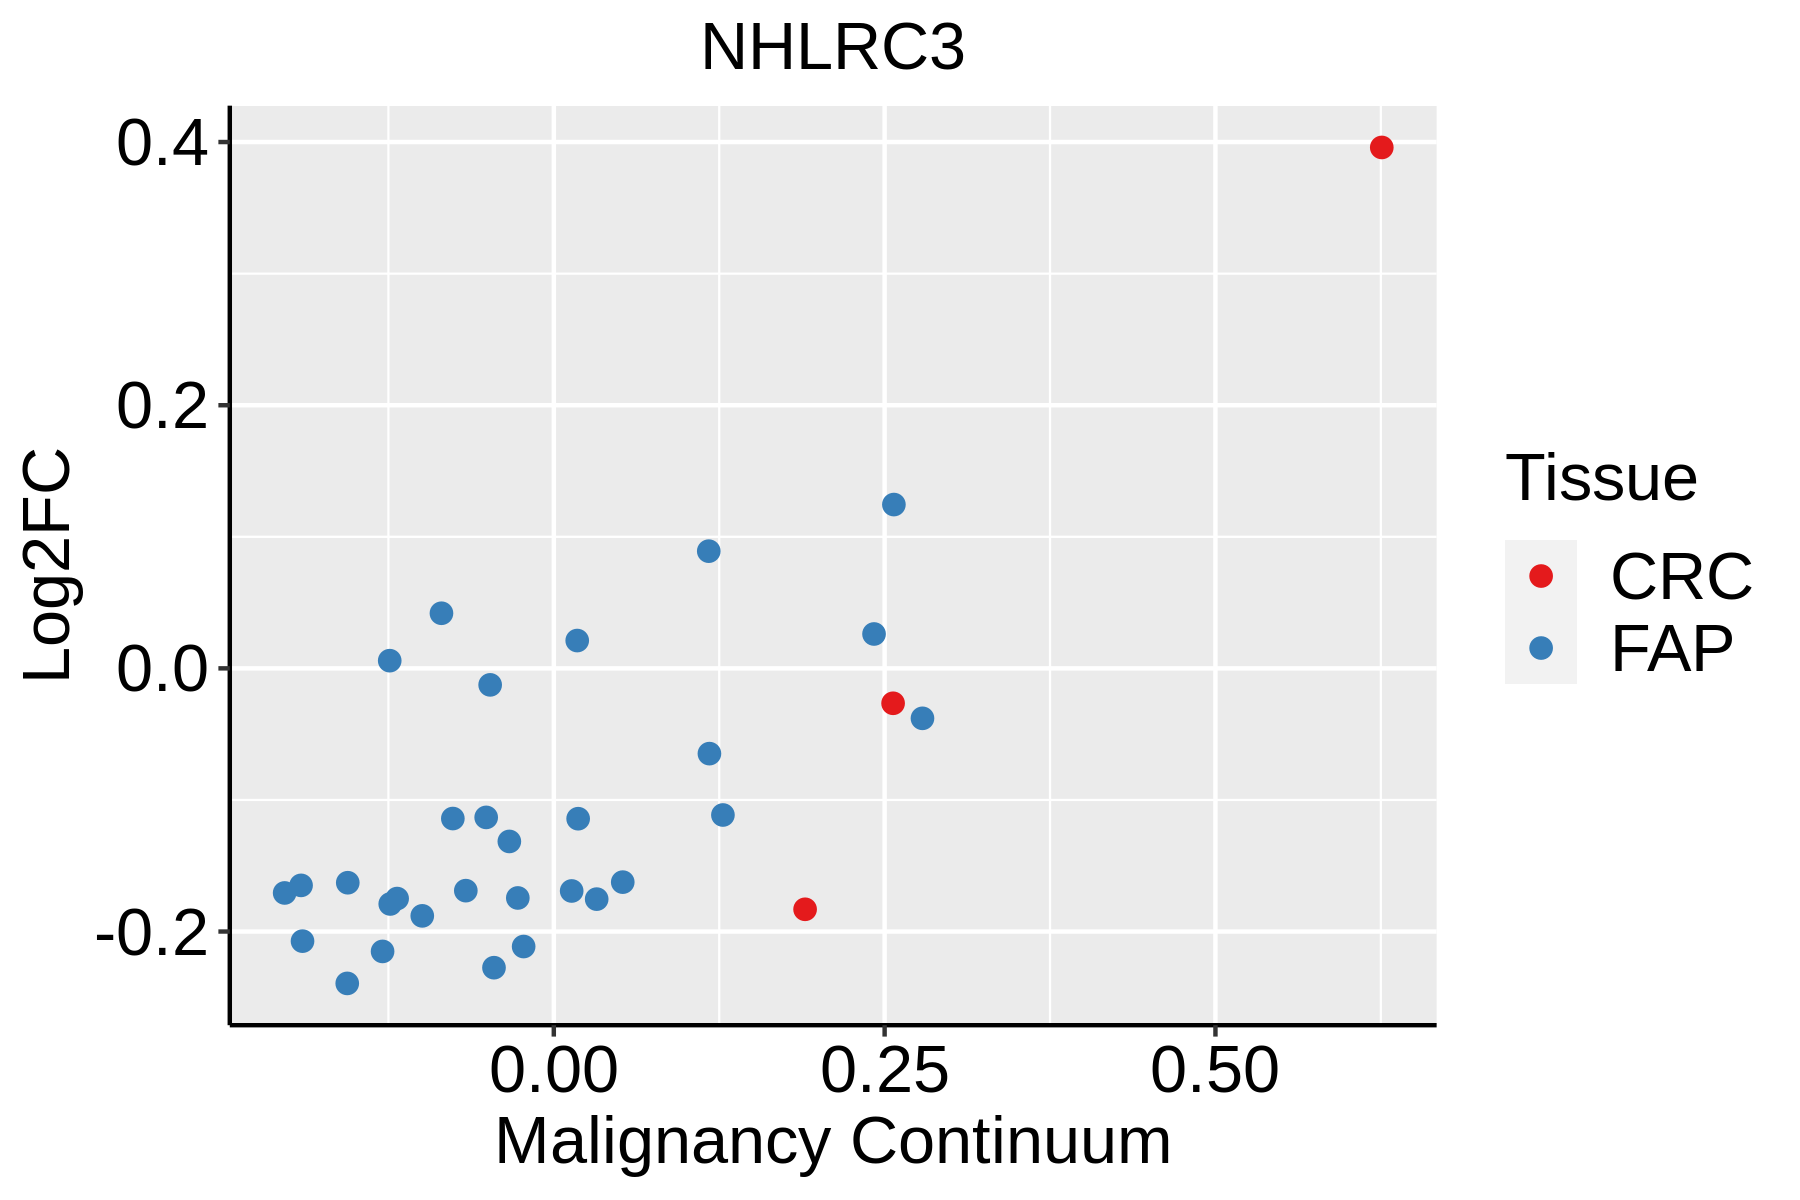 | FAP: Familial adenomatous polyposis |
| CRC: Colorectal cancer | ||
| Colorectum (HTA11) |  | AD: Adenomas |
| SER: Sessile serrated lesions | ||
| MSI-H: Microsatellite-high colorectal cancer | ||
| MSS: Microsatellite stable colorectal cancer | ||
| Oral Cavity | 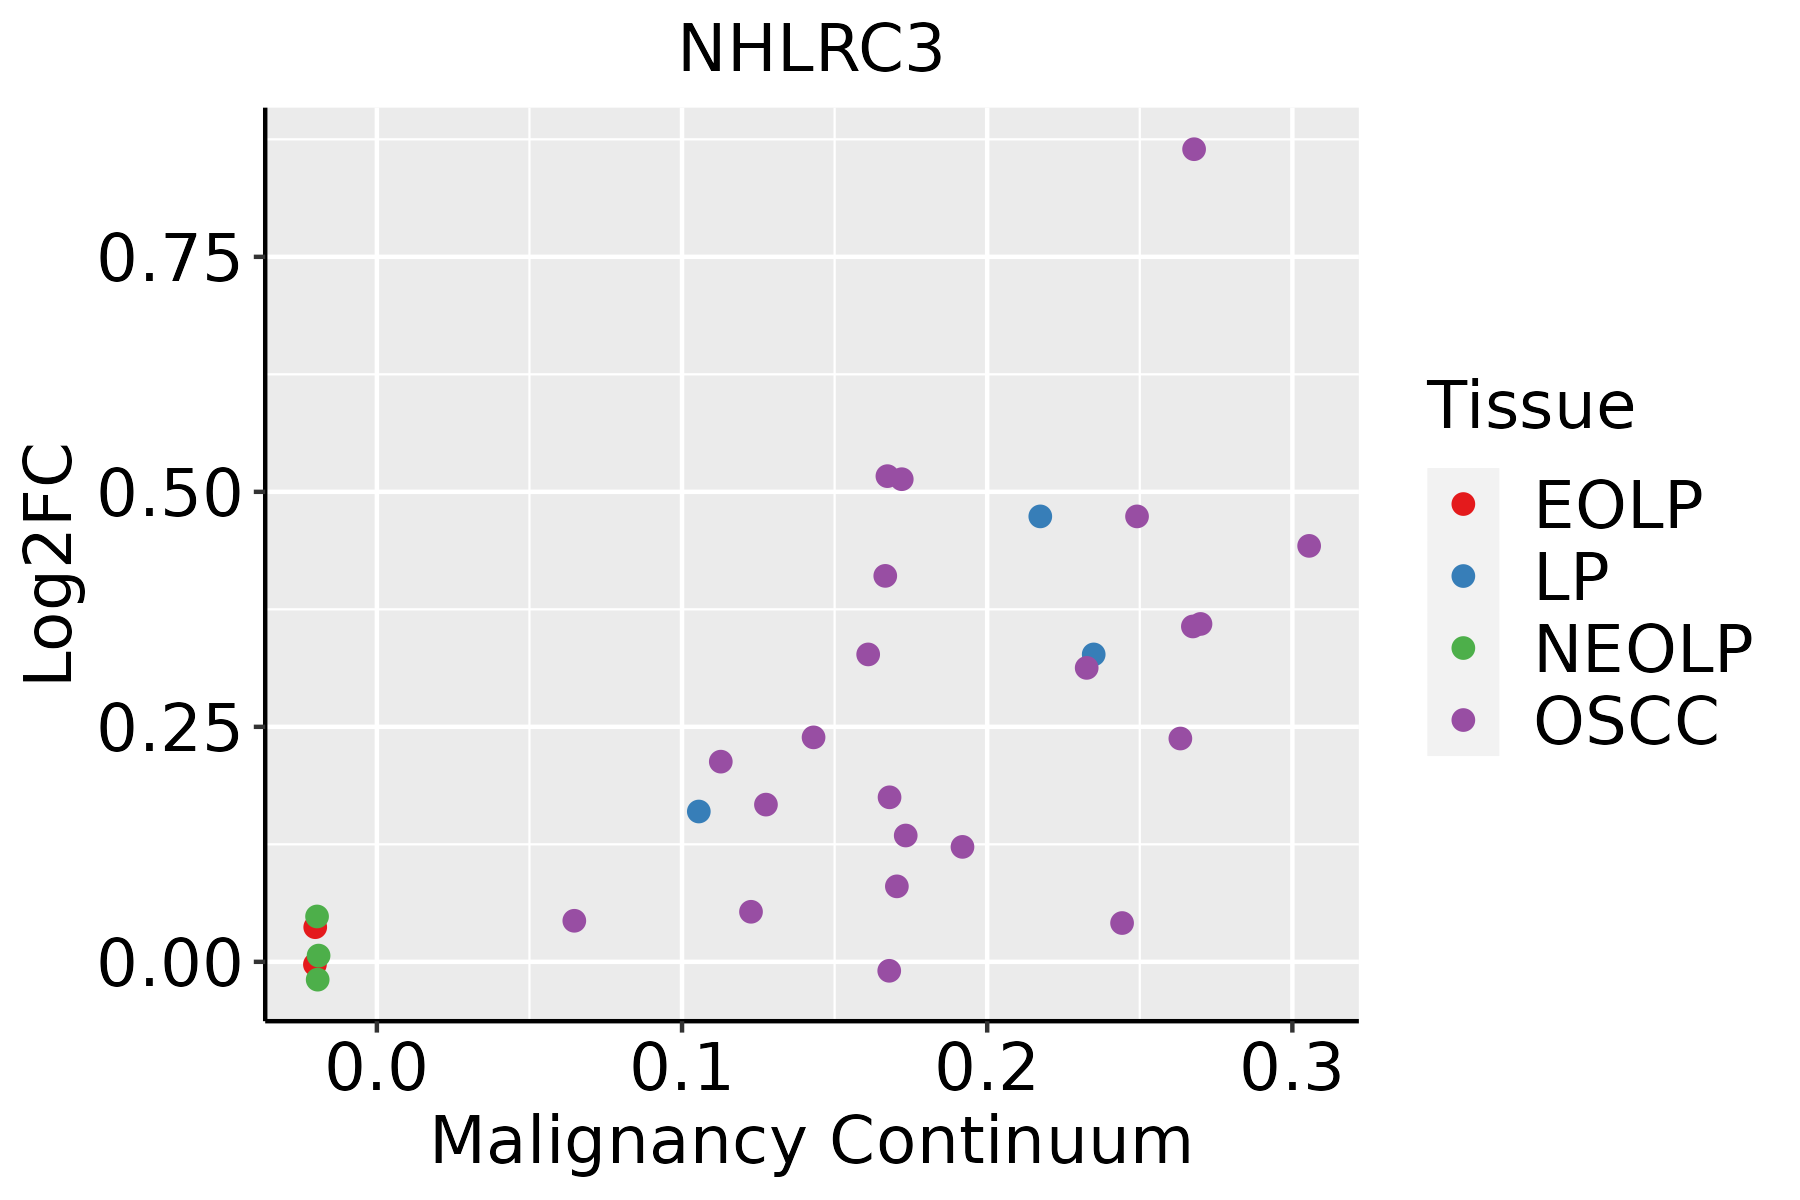 | EOLP: Erosive Oral lichen planus |
| LP: leukoplakia | ||
| NEOLP: Non-erosive oral lichen planus | ||
| OSCC: Oral squamous cell carcinoma | ||
| Thyroid |  | ATC: Anaplastic thyroid cancer |
| HT: Hashimoto's thyroiditis | ||
| PTC: Papillary thyroid cancer |
| ∗log2FC in expression of this searched gene in stem-like cells from each diseased tissue sample relative to stem-like cells in normal samples in each tissue plotted against the malignancy continuum. Samples are colored based on if they are from different disease stage. |
Top |
Malignant transformation related pathway analysis |
| Find out the enriched GO biological processes and KEGG pathways involved in transition from healthy to precancer to cancer |
| Tissue | Disease Stage | Enriched GO biological Processes |
| Colorectum | AD |  |
| Colorectum | SER |  |
| Colorectum | MSS |  |
| Colorectum | MSI-H |  |
| Colorectum | FAP |  |
| ∗Top 15 enriched GO BP terms are showed in the bar plot of each disease state in each tissue. Each row represents a significant GO biological process which is colored according to the -log10(p.adjust). |
| Page: 1 2 3 4 5 6 7 8 9 |
| GO ID | Tissue | Disease Stage | Description | Gene Ratio | Bg Ratio | pvalue | p.adjust | Count |
| GO:0010498 | Colorectum | AD | proteasomal protein catabolic process | 174/3918 | 490/18723 | 3.18e-14 | 7.66e-12 | 174 |
| GO:0043161 | Colorectum | AD | proteasome-mediated ubiquitin-dependent protein catabolic process | 141/3918 | 412/18723 | 1.77e-10 | 1.68e-08 | 141 |
| GO:0000209 | Colorectum | AD | protein polyubiquitination | 78/3918 | 236/18723 | 8.71e-06 | 2.06e-04 | 78 |
| GO:00104982 | Colorectum | MSS | proteasomal protein catabolic process | 157/3467 | 490/18723 | 2.39e-13 | 5.25e-11 | 157 |
| GO:00431612 | Colorectum | MSS | proteasome-mediated ubiquitin-dependent protein catabolic process | 127/3467 | 412/18723 | 7.70e-10 | 6.32e-08 | 127 |
| GO:00002092 | Colorectum | MSS | protein polyubiquitination | 72/3467 | 236/18723 | 5.19e-06 | 1.42e-04 | 72 |
| GO:00431614 | Colorectum | FAP | proteasome-mediated ubiquitin-dependent protein catabolic process | 98/2622 | 412/18723 | 5.41e-08 | 4.20e-06 | 98 |
| GO:00104984 | Colorectum | FAP | proteasomal protein catabolic process | 110/2622 | 490/18723 | 2.12e-07 | 1.26e-05 | 110 |
| GO:00002093 | Colorectum | FAP | protein polyubiquitination | 59/2622 | 236/18723 | 4.53e-06 | 1.52e-04 | 59 |
| GO:00002094 | Colorectum | CRC | protein polyubiquitination | 46/2078 | 236/18723 | 9.91e-05 | 1.98e-03 | 46 |
| GO:00431615 | Colorectum | CRC | proteasome-mediated ubiquitin-dependent protein catabolic process | 69/2078 | 412/18723 | 3.16e-04 | 4.90e-03 | 69 |
| GO:00104985 | Colorectum | CRC | proteasomal protein catabolic process | 77/2078 | 490/18723 | 1.03e-03 | 1.21e-02 | 77 |
| GO:001049820 | Oral cavity | OSCC | proteasomal protein catabolic process | 336/7305 | 490/18723 | 5.45e-41 | 8.63e-38 | 336 |
| GO:004316120 | Oral cavity | OSCC | proteasome-mediated ubiquitin-dependent protein catabolic process | 285/7305 | 412/18723 | 5.68e-36 | 5.99e-33 | 285 |
| GO:000020910 | Oral cavity | OSCC | protein polyubiquitination | 150/7305 | 236/18723 | 1.59e-14 | 9.27e-13 | 150 |
| GO:0010498110 | Oral cavity | LP | proteasomal protein catabolic process | 224/4623 | 490/18723 | 9.57e-25 | 4.00e-22 | 224 |
| GO:0043161110 | Oral cavity | LP | proteasome-mediated ubiquitin-dependent protein catabolic process | 190/4623 | 412/18723 | 1.08e-21 | 2.93e-19 | 190 |
| GO:000020915 | Oral cavity | LP | protein polyubiquitination | 82/4623 | 236/18723 | 3.23e-04 | 3.26e-03 | 82 |
| GO:0010498113 | Thyroid | PTC | proteasomal protein catabolic process | 297/5968 | 490/18723 | 4.58e-40 | 9.63e-37 | 297 |
| GO:0043161113 | Thyroid | PTC | proteasome-mediated ubiquitin-dependent protein catabolic process | 254/5968 | 412/18723 | 3.91e-36 | 4.54e-33 | 254 |
| Page: 1 2 |
| Pathway ID | Tissue | Disease Stage | Description | Gene Ratio | Bg Ratio | pvalue | p.adjust | qvalue | Count |
| Page: 1 |
Top |
Cell-cell communication analysis |
| Identification of potential cell-cell interactions between two cell types and their ligand-receptor pairs for different disease states |
| Ligand | Receptor | LRpair | Pathway | Tissue | Disease Stage |
| Page: 1 |
Top |
Single-cell gene regulatory network inference analysis |
| Find out the significant the regulons (TFs) and the target genes of each regulon across cell types for different disease states |
| TF | Cell Type | Tissue | Disease Stage | Target Gene | RSS | Regulon Activity |
| ∗The dot plots of a searched regulon are shown for all cell subpopulations in each disease state of each tissue based on the regulon specific score inferred using pySCENIC and by calculating the average expression. |
| Page: 1 |
Top |
Somatic mutation of malignant transformation related genes |
| Annotation of somatic variants for genes involved in malignant transformation |
| Hugo Symbol | Variant Class | Variant Classification | dbSNP RS | HGVSc | HGVSp | HGVSp Short | SWISSPROT | BIOTYPE | SIFT | PolyPhen | Tumor Sample Barcode | Tissue | Histology | Sex | Age | Stage | Therapy Types | Drugs | Outcome |
| NHLRC3 | insertion | In_Frame_Ins | novel | c.928_929insTTA | p.Pro310delinsLeuThr | p.P310delinsLT | Q5JS37 | protein_coding | TCGA-A2-A0CX-01 | Breast | breast invasive carcinoma | Female | <65 | I/II | Chemotherapy | adriamycin | SD | ||
| NHLRC3 | insertion | Frame_Shift_Ins | novel | c.929_930insCATCATGG | p.His311IlefsTer6 | p.H311Ifs*6 | Q5JS37 | protein_coding | TCGA-A2-A0CX-01 | Breast | breast invasive carcinoma | Female | <65 | I/II | Chemotherapy | adriamycin | SD | ||
| NHLRC3 | insertion | Nonsense_Mutation | novel | c.26_27insAAATTGAGATTCAGAAAAACTCTTTTTATTAAAAAGAAAAAACACT | p.Gly10AsnfsTer2 | p.G10Nfs*2 | Q5JS37 | protein_coding | TCGA-A8-A06P-01 | Breast | breast invasive carcinoma | Female | <65 | III/IV | Unspecific | SD | |||
| NHLRC3 | SNV | Missense_Mutation | c.184N>C | p.Thr62Pro | p.T62P | Q5JS37 | protein_coding | tolerated(0.33) | benign(0) | TCGA-FU-A3HZ-01 | Cervix | cervical & endocervical cancer | Female | <65 | I/II | Chemotherapy | cisplatin | CR | |
| NHLRC3 | SNV | Missense_Mutation | c.558N>C | p.Leu186Phe | p.L186F | Q5JS37 | protein_coding | deleterious(0.01) | possibly_damaging(0.466) | TCGA-Q1-A5R2-01 | Cervix | cervical & endocervical cancer | Female | <65 | I/II | Chemotherapy | cisplatin | PR | |
| NHLRC3 | SNV | Missense_Mutation | c.973G>C | p.Ala325Pro | p.A325P | Q5JS37 | protein_coding | deleterious(0) | probably_damaging(0.98) | TCGA-AA-3664-01 | Colorectum | colon adenocarcinoma | Female | >=65 | I/II | Unknown | Unknown | SD | |
| NHLRC3 | SNV | Missense_Mutation | c.673N>A | p.Gly225Ser | p.G225S | Q5JS37 | protein_coding | deleterious(0.01) | possibly_damaging(0.487) | TCGA-AA-3713-01 | Colorectum | colon adenocarcinoma | Male | >=65 | III/IV | Chemotherapy | 5-fluorouracil | PR | |
| NHLRC3 | SNV | Missense_Mutation | c.961N>A | p.Ala321Thr | p.A321T | Q5JS37 | protein_coding | deleterious(0.02) | possibly_damaging(0.885) | TCGA-AA-3977-01 | Colorectum | colon adenocarcinoma | Male | >=65 | I/II | Unknown | Unknown | SD | |
| NHLRC3 | SNV | Missense_Mutation | c.390C>A | p.Phe130Leu | p.F130L | Q5JS37 | protein_coding | tolerated(0.28) | benign(0.001) | TCGA-AA-A010-01 | Colorectum | colon adenocarcinoma | Female | <65 | I/II | Chemotherapy | folinic | CR | |
| NHLRC3 | SNV | Missense_Mutation | c.316N>G | p.Thr106Ala | p.T106A | Q5JS37 | protein_coding | tolerated(0.16) | benign(0.031) | TCGA-AD-6964-01 | Colorectum | colon adenocarcinoma | Male | <65 | III/IV | Chemotherapy | folfox | PD |
| Page: 1 2 3 4 5 |
Top |
Related drugs of malignant transformation related genes |
| Identification of chemicals and drugs interact with genes involved in malignant transfromation |
| (DGIdb 4.0) |
| Entrez ID | Symbol | Category | Interaction Types | Drug Claim Name | Drug Name | PMIDs |
| Page: 1 |

Copyright 2023-Present -The University of Texas Health Science Center at Houston |