
|
|||||
|
 | |
| |
| |
| |
| |
| |
|
Gene: NGRN |
Gene summary for NGRN |
| Gene information | Species | Human | Gene symbol | NGRN | Gene ID | 51335 |
| Gene name | neugrin, neurite outgrowth associated | |
| Gene Alias | DSC92 | |
| Cytomap | 15q26.1 | |
| Gene Type | protein-coding | GO ID | GO:0006412 | UniProtAcc | Q9NPE2 |
Top |
Malignant transformation analysis |
| Identification of the aberrant gene expression in precancerous and cancerous lesions by comparing the gene expression of stem-like cells in diseased tissues with normal stem cells |
| Entrez ID | Symbol | Replicates | Species | Organ | Tissue | Adj P-value | Log2FC | Malignancy |
| 51335 | NGRN | sample1 | Human | Cervix | CC | 2.92e-03 | 3.21e-01 | 0.0959 |
| 51335 | NGRN | sample3 | Human | Cervix | CC | 5.05e-30 | 5.02e-01 | 0.1387 |
| 51335 | NGRN | H2 | Human | Cervix | HSIL_HPV | 1.13e-08 | 2.45e-01 | 0.0632 |
| 51335 | NGRN | T1 | Human | Cervix | CC | 5.48e-09 | 3.18e-01 | 0.0918 |
| 51335 | NGRN | T2 | Human | Cervix | CC | 2.29e-03 | 3.73e-01 | 0.0709 |
| 51335 | NGRN | T3 | Human | Cervix | CC | 1.34e-27 | 5.17e-01 | 0.1389 |
| 51335 | NGRN | LZE2T | Human | Esophagus | ESCC | 2.41e-09 | 1.09e+00 | 0.082 |
| 51335 | NGRN | LZE4T | Human | Esophagus | ESCC | 2.22e-38 | 1.04e+00 | 0.0811 |
| 51335 | NGRN | LZE5T | Human | Esophagus | ESCC | 1.08e-10 | 8.50e-01 | 0.0514 |
| 51335 | NGRN | LZE7T | Human | Esophagus | ESCC | 8.10e-38 | 1.93e+00 | 0.0667 |
| 51335 | NGRN | LZE8T | Human | Esophagus | ESCC | 6.10e-32 | 9.64e-01 | 0.067 |
| 51335 | NGRN | LZE20T | Human | Esophagus | ESCC | 9.80e-25 | 7.72e-01 | 0.0662 |
| 51335 | NGRN | LZE22D1 | Human | Esophagus | HGIN | 3.91e-08 | 4.76e-01 | 0.0595 |
| 51335 | NGRN | LZE22T | Human | Esophagus | ESCC | 2.02e-17 | 1.13e+00 | 0.068 |
| 51335 | NGRN | LZE24T | Human | Esophagus | ESCC | 2.78e-50 | 1.22e+00 | 0.0596 |
| 51335 | NGRN | LZE22D3 | Human | Esophagus | HGIN | 2.46e-02 | 7.35e-01 | 0.0653 |
| 51335 | NGRN | LZE21T | Human | Esophagus | ESCC | 4.66e-18 | 9.43e-01 | 0.0655 |
| 51335 | NGRN | LZE6T | Human | Esophagus | ESCC | 8.16e-31 | 1.28e+00 | 0.0845 |
| 51335 | NGRN | P1T-E | Human | Esophagus | ESCC | 9.39e-25 | 1.57e+00 | 0.0875 |
| 51335 | NGRN | P2T-E | Human | Esophagus | ESCC | 4.68e-106 | 1.73e+00 | 0.1177 |
| Page: 1 2 3 4 5 6 |
| Tissue | Expression Dynamics | Abbreviation |
| Cervix | 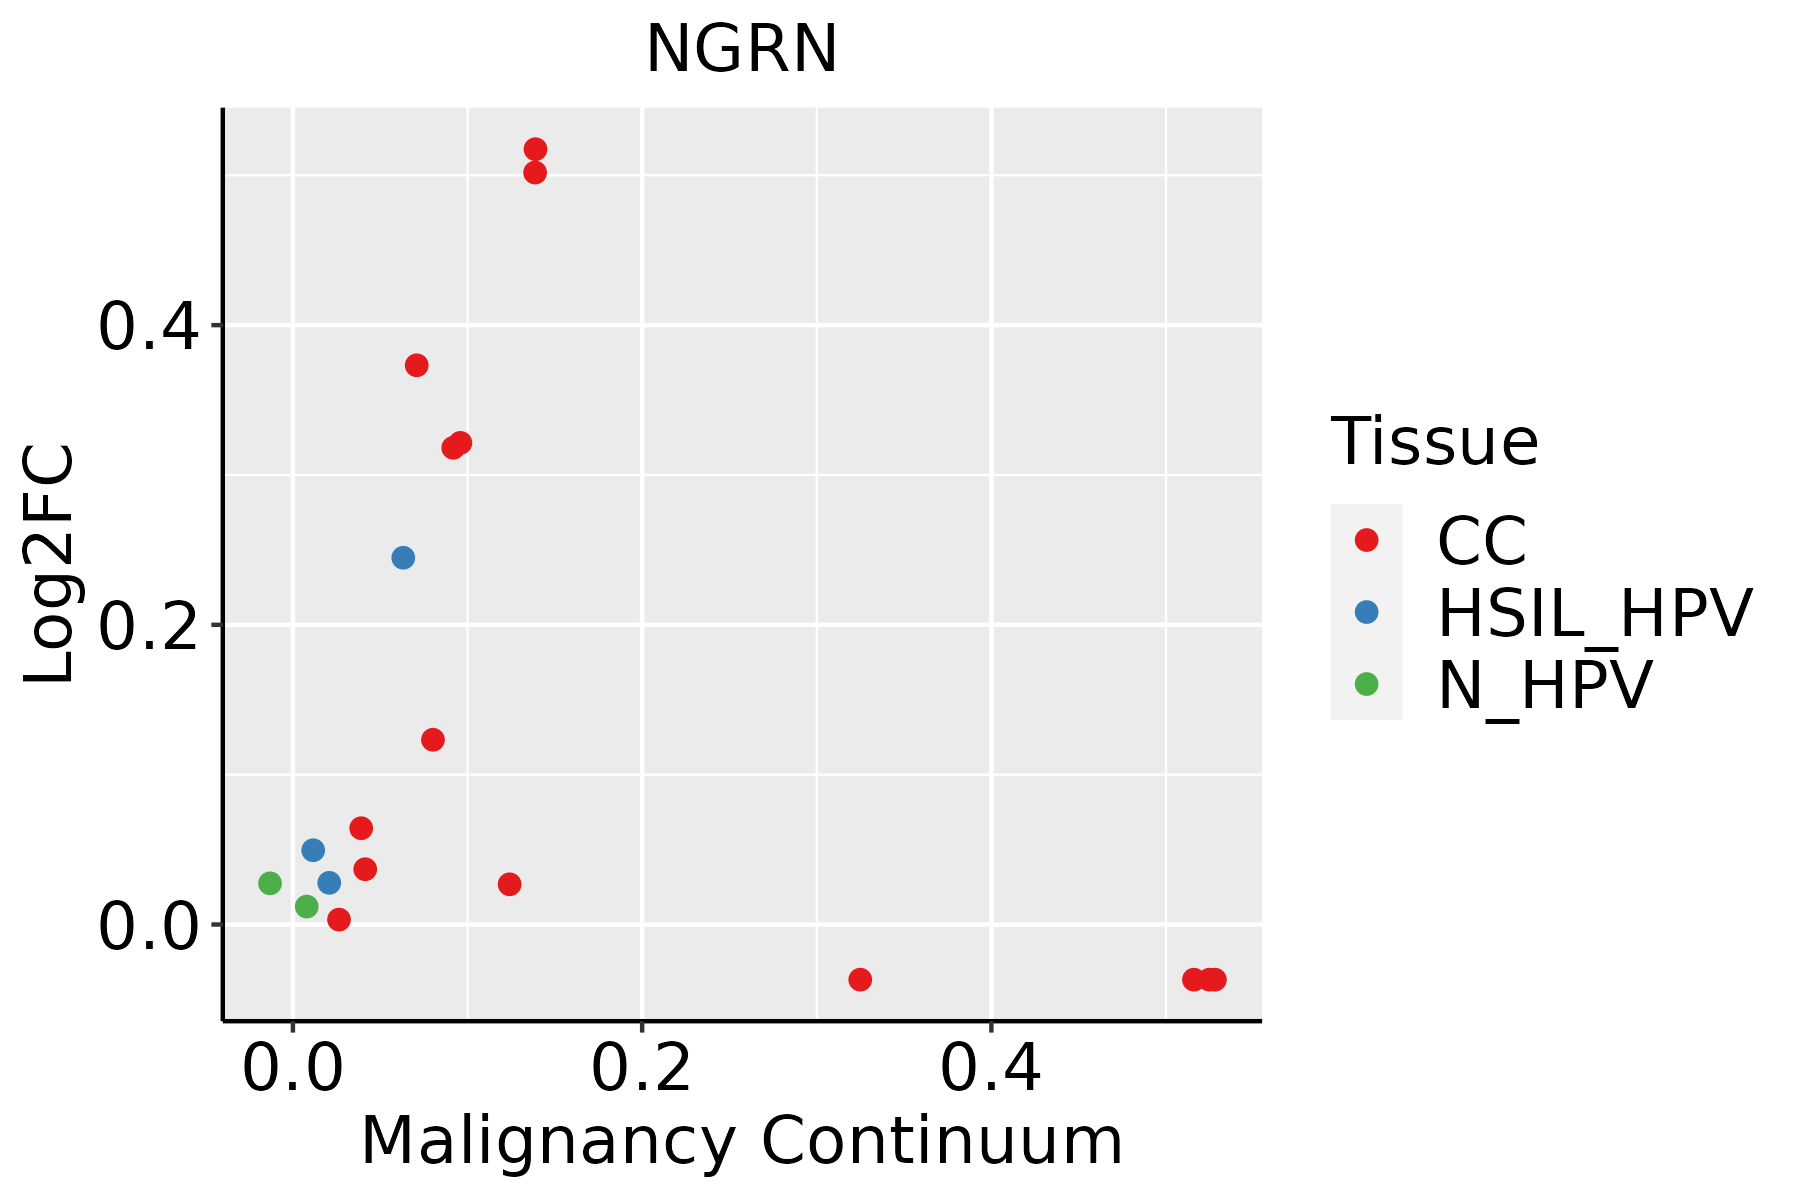 | CC: Cervix cancer |
| HSIL_HPV: HPV-infected high-grade squamous intraepithelial lesions | ||
| N_HPV: HPV-infected normal cervix | ||
| Esophagus | 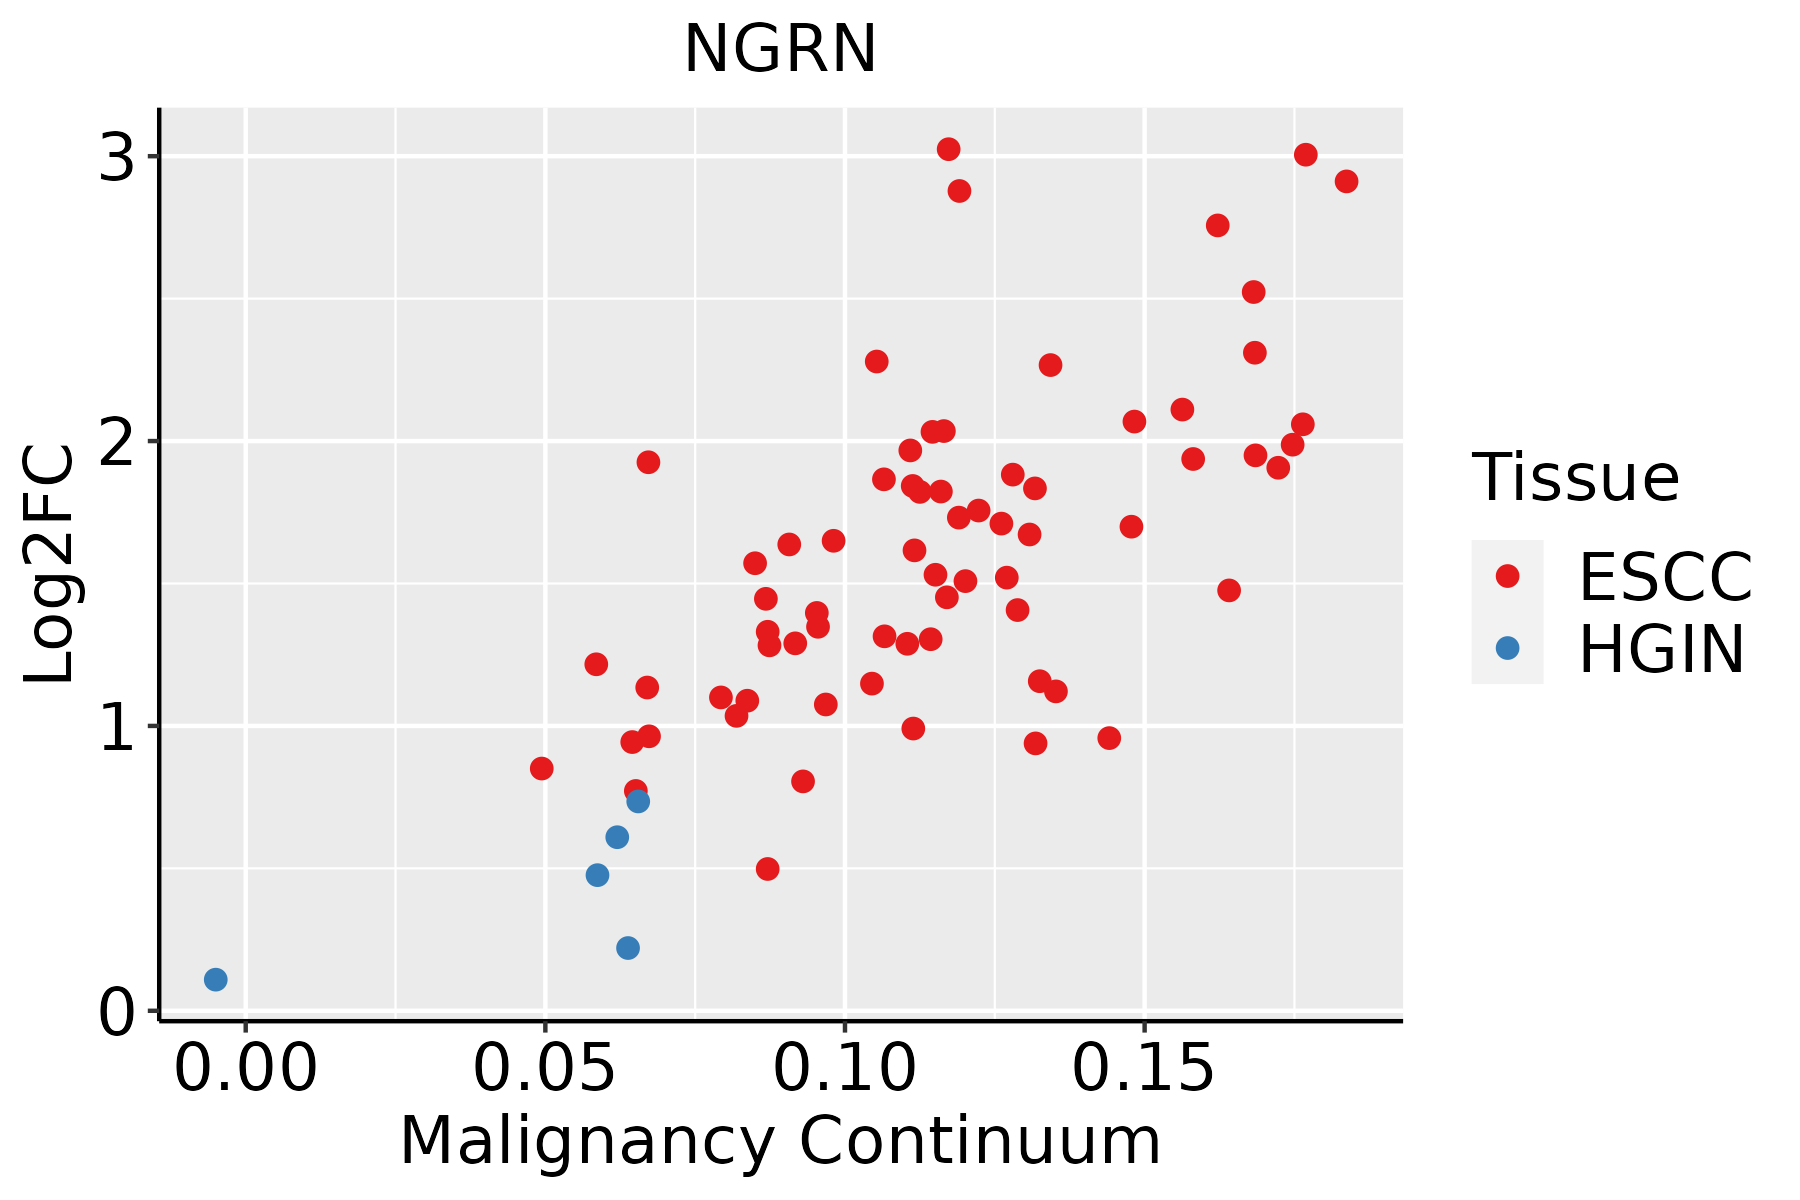 | ESCC: Esophageal squamous cell carcinoma |
| HGIN: High-grade intraepithelial neoplasias | ||
| LGIN: Low-grade intraepithelial neoplasias | ||
| Liver |  | HCC: Hepatocellular carcinoma |
| NAFLD: Non-alcoholic fatty liver disease | ||
| Prostate | 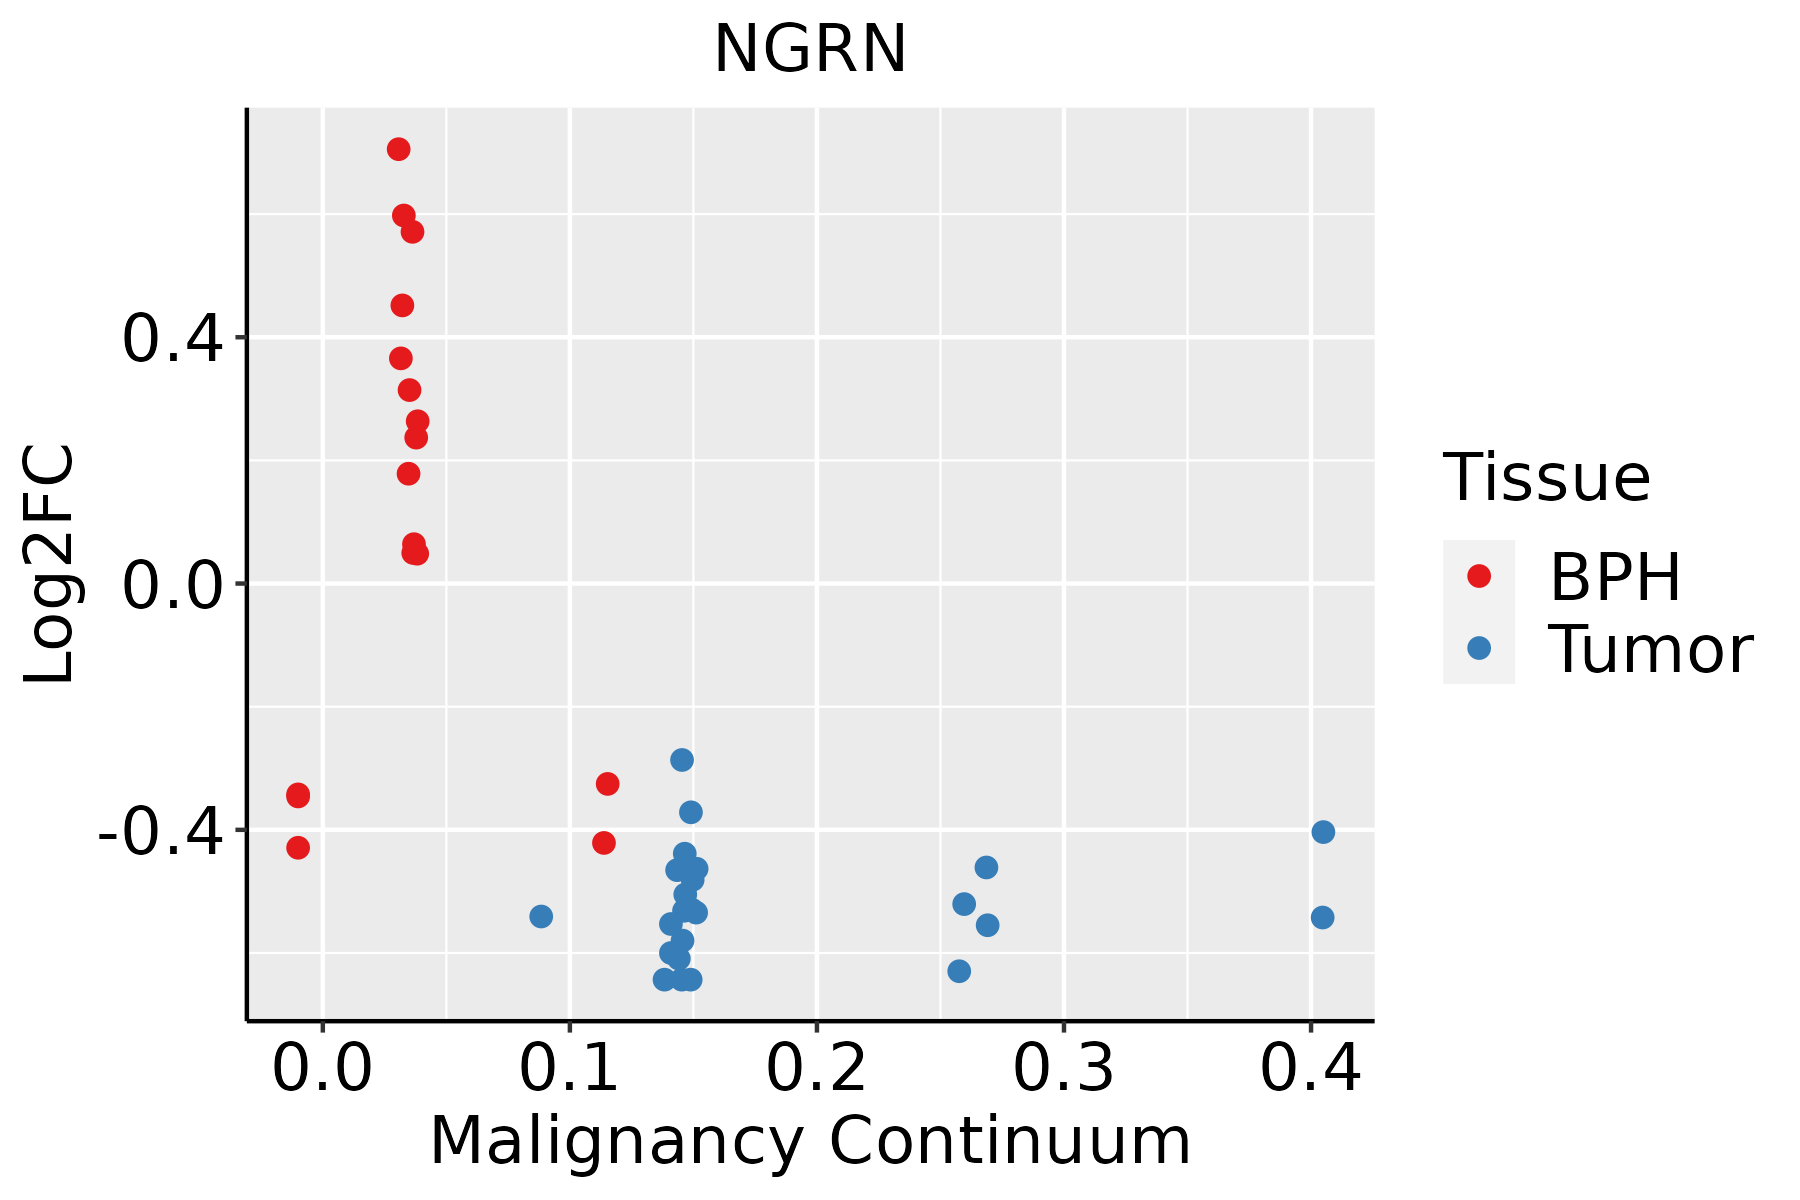 | BPH: Benign Prostatic Hyperplasia |
| ∗log2FC in expression of this searched gene in stem-like cells from each diseased tissue sample relative to stem-like cells in normal samples in each tissue plotted against the malignancy continuum. Samples are colored based on if they are from different disease stage. |
Top |
Malignant transformation related pathway analysis |
| Find out the enriched GO biological processes and KEGG pathways involved in transition from healthy to precancer to cancer |
| Tissue | Disease Stage | Enriched GO biological Processes |
| Colorectum | AD |  |
| Colorectum | SER |  |
| Colorectum | MSS |  |
| Colorectum | MSI-H |  |
| Colorectum | FAP |  |
| ∗Top 15 enriched GO BP terms are showed in the bar plot of each disease state in each tissue. Each row represents a significant GO biological process which is colored according to the -log10(p.adjust). |
| Page: 1 2 3 4 5 6 7 8 9 |
| GO ID | Tissue | Disease Stage | Description | Gene Ratio | Bg Ratio | pvalue | p.adjust | Count |
| GO:003425010 | Cervix | CC | positive regulation of cellular amide metabolic process | 40/2311 | 162/18723 | 1.11e-05 | 2.41e-04 | 40 |
| GO:000641710 | Cervix | CC | regulation of translation | 89/2311 | 468/18723 | 1.86e-05 | 3.46e-04 | 89 |
| GO:004572710 | Cervix | CC | positive regulation of translation | 33/2311 | 136/18723 | 9.09e-05 | 1.20e-03 | 33 |
| GO:000641715 | Cervix | HSIL_HPV | regulation of translation | 34/737 | 468/18723 | 4.66e-04 | 6.83e-03 | 34 |
| GO:000641727 | Esophagus | HGIN | regulation of translation | 139/2587 | 468/18723 | 1.46e-19 | 7.98e-17 | 139 |
| GO:004572720 | Esophagus | HGIN | positive regulation of translation | 49/2587 | 136/18723 | 5.88e-11 | 6.30e-09 | 49 |
| GO:003425020 | Esophagus | HGIN | positive regulation of cellular amide metabolic process | 53/2587 | 162/18723 | 6.01e-10 | 5.15e-08 | 53 |
| GO:00325435 | Esophagus | HGIN | mitochondrial translation | 23/2587 | 76/18723 | 1.61e-04 | 3.16e-03 | 23 |
| GO:01400534 | Esophagus | HGIN | mitochondrial gene expression | 27/2587 | 108/18723 | 1.34e-03 | 1.57e-02 | 27 |
| GO:014005313 | Esophagus | ESCC | mitochondrial gene expression | 93/8552 | 108/18723 | 1.96e-18 | 2.03e-16 | 93 |
| GO:0006417111 | Esophagus | ESCC | regulation of translation | 304/8552 | 468/18723 | 1.53e-17 | 1.33e-15 | 304 |
| GO:003254314 | Esophagus | ESCC | mitochondrial translation | 68/8552 | 76/18723 | 1.02e-15 | 6.86e-14 | 68 |
| GO:0045727111 | Esophagus | ESCC | positive regulation of translation | 107/8552 | 136/18723 | 2.79e-15 | 1.68e-13 | 107 |
| GO:0034250111 | Esophagus | ESCC | positive regulation of cellular amide metabolic process | 123/8552 | 162/18723 | 3.32e-15 | 1.93e-13 | 123 |
| GO:00701292 | Esophagus | ESCC | regulation of mitochondrial translation | 22/8552 | 24/18723 | 2.82e-06 | 3.21e-05 | 22 |
| GO:00621252 | Esophagus | ESCC | regulation of mitochondrial gene expression | 24/8552 | 28/18723 | 1.37e-05 | 1.25e-04 | 24 |
| GO:00701312 | Esophagus | ESCC | positive regulation of mitochondrial translation | 14/8552 | 15/18723 | 1.47e-04 | 9.85e-04 | 14 |
| GO:000641722 | Liver | HCC | regulation of translation | 287/7958 | 468/18723 | 8.79e-17 | 8.08e-15 | 287 |
| GO:01400531 | Liver | HCC | mitochondrial gene expression | 82/7958 | 108/18723 | 1.49e-12 | 7.20e-11 | 82 |
| GO:00325431 | Liver | HCC | mitochondrial translation | 62/7958 | 76/18723 | 2.95e-12 | 1.34e-10 | 62 |
| Page: 1 2 |
| Pathway ID | Tissue | Disease Stage | Description | Gene Ratio | Bg Ratio | pvalue | p.adjust | qvalue | Count |
| Page: 1 |
Top |
Cell-cell communication analysis |
| Identification of potential cell-cell interactions between two cell types and their ligand-receptor pairs for different disease states |
| Ligand | Receptor | LRpair | Pathway | Tissue | Disease Stage |
| Page: 1 |
Top |
Single-cell gene regulatory network inference analysis |
| Find out the significant the regulons (TFs) and the target genes of each regulon across cell types for different disease states |
| TF | Cell Type | Tissue | Disease Stage | Target Gene | RSS | Regulon Activity |
| ∗The dot plots of a searched regulon are shown for all cell subpopulations in each disease state of each tissue based on the regulon specific score inferred using pySCENIC and by calculating the average expression. |
| Page: 1 |
Top |
Somatic mutation of malignant transformation related genes |
| Annotation of somatic variants for genes involved in malignant transformation |
| Hugo Symbol | Variant Class | Variant Classification | dbSNP RS | HGVSc | HGVSp | HGVSp Short | SWISSPROT | BIOTYPE | SIFT | PolyPhen | Tumor Sample Barcode | Tissue | Histology | Sex | Age | Stage | Therapy Types | Drugs | Outcome |
| NGRN | insertion | Frame_Shift_Ins | novel | c.474_475insCTCTC | p.Thr159LeufsTer35 | p.T159Lfs*35 | Q9NPE2 | protein_coding | TCGA-A8-A07J-01 | Breast | breast invasive carcinoma | Female | <65 | I/II | Chemotherapy | 5-fluorouracil | CR | ||
| NGRN | SNV | Missense_Mutation | c.74G>T | p.Arg25Leu | p.R25L | Q9NPE2 | protein_coding | deleterious(0.01) | benign(0.245) | TCGA-C5-A3HE-01 | Cervix | cervical & endocervical cancer | Female | <65 | I/II | Unknown | Unknown | PD | |
| NGRN | insertion | In_Frame_Ins | novel | c.668_669insCTGGCA | p.Pro223_Val224insTrpHis | p.P223_V224insWH | Q9NPE2 | protein_coding | TCGA-DS-A1OD-01 | Cervix | cervical & endocervical cancer | Female | <65 | I/II | Chemotherapy | cisplatin | SD | ||
| NGRN | SNV | Missense_Mutation | novel | c.631A>C | p.Asn211His | p.N211H | Q9NPE2 | protein_coding | tolerated(0.06) | possibly_damaging(0.905) | TCGA-EI-6917-01 | Colorectum | rectum adenocarcinoma | Male | <65 | III/IV | Chemotherapy | 5fluorouracil+oxaciplatina+l-folinian | SD |
| NGRN | SNV | Missense_Mutation | novel | c.840N>A | p.Phe280Leu | p.F280L | Q9NPE2 | protein_coding | tolerated(0.08) | benign(0.287) | TCGA-F5-6814-01 | Colorectum | rectum adenocarcinoma | Male | <65 | I/II | Unknown | Unknown | SD |
| NGRN | SNV | Missense_Mutation | novel | c.833N>A | p.Arg278Gln | p.R278Q | Q9NPE2 | protein_coding | tolerated(0.11) | benign(0.266) | TCGA-A5-A0G2-01 | Endometrium | uterine corpus endometrioid carcinoma | Female | <65 | III/IV | Unknown | Unknown | SD |
| NGRN | SNV | Missense_Mutation | c.201G>T | p.Gln67His | p.Q67H | Q9NPE2 | protein_coding | tolerated(0.23) | benign(0.046) | TCGA-AP-A0LM-01 | Endometrium | uterine corpus endometrioid carcinoma | Female | <65 | III/IV | Chemotherapy | cisplatin | SD | |
| NGRN | SNV | Missense_Mutation | novel | c.580N>T | p.Ile194Leu | p.I194L | Q9NPE2 | protein_coding | tolerated(0.47) | benign(0.001) | TCGA-AP-A1DK-01 | Endometrium | uterine corpus endometrioid carcinoma | Female | <65 | I/II | Unknown | Unknown | SD |
| NGRN | SNV | Missense_Mutation | novel | c.512G>A | p.Gly171Asp | p.G171D | Q9NPE2 | protein_coding | tolerated(0.22) | benign(0.088) | TCGA-AP-A1E0-01 | Endometrium | uterine corpus endometrioid carcinoma | Female | <65 | III/IV | Chemotherapy | paclitaxel | SD |
| NGRN | SNV | Missense_Mutation | novel | c.277N>C | p.Tyr93His | p.Y93H | Q9NPE2 | protein_coding | tolerated(0.07) | possibly_damaging(0.823) | TCGA-AX-A0J1-01 | Endometrium | uterine corpus endometrioid carcinoma | Female | >=65 | I/II | Unknown | Unknown | SD |
| Page: 1 2 3 |
Top |
Related drugs of malignant transformation related genes |
| Identification of chemicals and drugs interact with genes involved in malignant transfromation |
| (DGIdb 4.0) |
| Entrez ID | Symbol | Category | Interaction Types | Drug Claim Name | Drug Name | PMIDs |
| Page: 1 |

Copyright 2023-Present -The University of Texas Health Science Center at Houston |