
|
|||||
|
 | |
| |
| |
| |
| |
| |
|
Gene: NGLY1 |
Gene summary for NGLY1 |
| Gene information | Species | Human | Gene symbol | NGLY1 | Gene ID | 55768 |
| Gene name | N-glycanase 1 | |
| Gene Alias | CDDG | |
| Cytomap | 3p24.2 | |
| Gene Type | protein-coding | GO ID | GO:0006457 | UniProtAcc | Q96IV0 |
Top |
Malignant transformation analysis |
| Identification of the aberrant gene expression in precancerous and cancerous lesions by comparing the gene expression of stem-like cells in diseased tissues with normal stem cells |
| Entrez ID | Symbol | Replicates | Species | Organ | Tissue | Adj P-value | Log2FC | Malignancy |
| 55768 | NGLY1 | LZE4T | Human | Esophagus | ESCC | 3.76e-05 | 1.75e-01 | 0.0811 |
| 55768 | NGLY1 | LZE7T | Human | Esophagus | ESCC | 3.28e-04 | 2.27e-01 | 0.0667 |
| 55768 | NGLY1 | LZE24T | Human | Esophagus | ESCC | 4.31e-10 | 4.16e-01 | 0.0596 |
| 55768 | NGLY1 | P1T-E | Human | Esophagus | ESCC | 7.93e-04 | 1.47e-01 | 0.0875 |
| 55768 | NGLY1 | P2T-E | Human | Esophagus | ESCC | 6.93e-17 | 1.87e-01 | 0.1177 |
| 55768 | NGLY1 | P4T-E | Human | Esophagus | ESCC | 7.24e-17 | 4.56e-01 | 0.1323 |
| 55768 | NGLY1 | P5T-E | Human | Esophagus | ESCC | 1.53e-14 | 1.59e-01 | 0.1327 |
| 55768 | NGLY1 | P8T-E | Human | Esophagus | ESCC | 3.10e-10 | 1.98e-01 | 0.0889 |
| 55768 | NGLY1 | P9T-E | Human | Esophagus | ESCC | 1.98e-10 | 1.77e-01 | 0.1131 |
| 55768 | NGLY1 | P10T-E | Human | Esophagus | ESCC | 6.38e-14 | 2.14e-01 | 0.116 |
| 55768 | NGLY1 | P11T-E | Human | Esophagus | ESCC | 2.44e-06 | 2.92e-01 | 0.1426 |
| 55768 | NGLY1 | P12T-E | Human | Esophagus | ESCC | 3.32e-02 | 1.27e-01 | 0.1122 |
| 55768 | NGLY1 | P15T-E | Human | Esophagus | ESCC | 6.78e-15 | 2.59e-01 | 0.1149 |
| 55768 | NGLY1 | P16T-E | Human | Esophagus | ESCC | 1.83e-13 | 1.63e-01 | 0.1153 |
| 55768 | NGLY1 | P17T-E | Human | Esophagus | ESCC | 3.56e-02 | 2.28e-01 | 0.1278 |
| 55768 | NGLY1 | P20T-E | Human | Esophagus | ESCC | 5.40e-14 | 3.07e-01 | 0.1124 |
| 55768 | NGLY1 | P21T-E | Human | Esophagus | ESCC | 1.10e-18 | 3.33e-01 | 0.1617 |
| 55768 | NGLY1 | P22T-E | Human | Esophagus | ESCC | 8.44e-16 | 2.15e-01 | 0.1236 |
| 55768 | NGLY1 | P23T-E | Human | Esophagus | ESCC | 7.21e-11 | 2.13e-01 | 0.108 |
| 55768 | NGLY1 | P24T-E | Human | Esophagus | ESCC | 1.70e-11 | 2.81e-01 | 0.1287 |
| Page: 1 2 3 4 5 |
| Tissue | Expression Dynamics | Abbreviation |
| Esophagus | 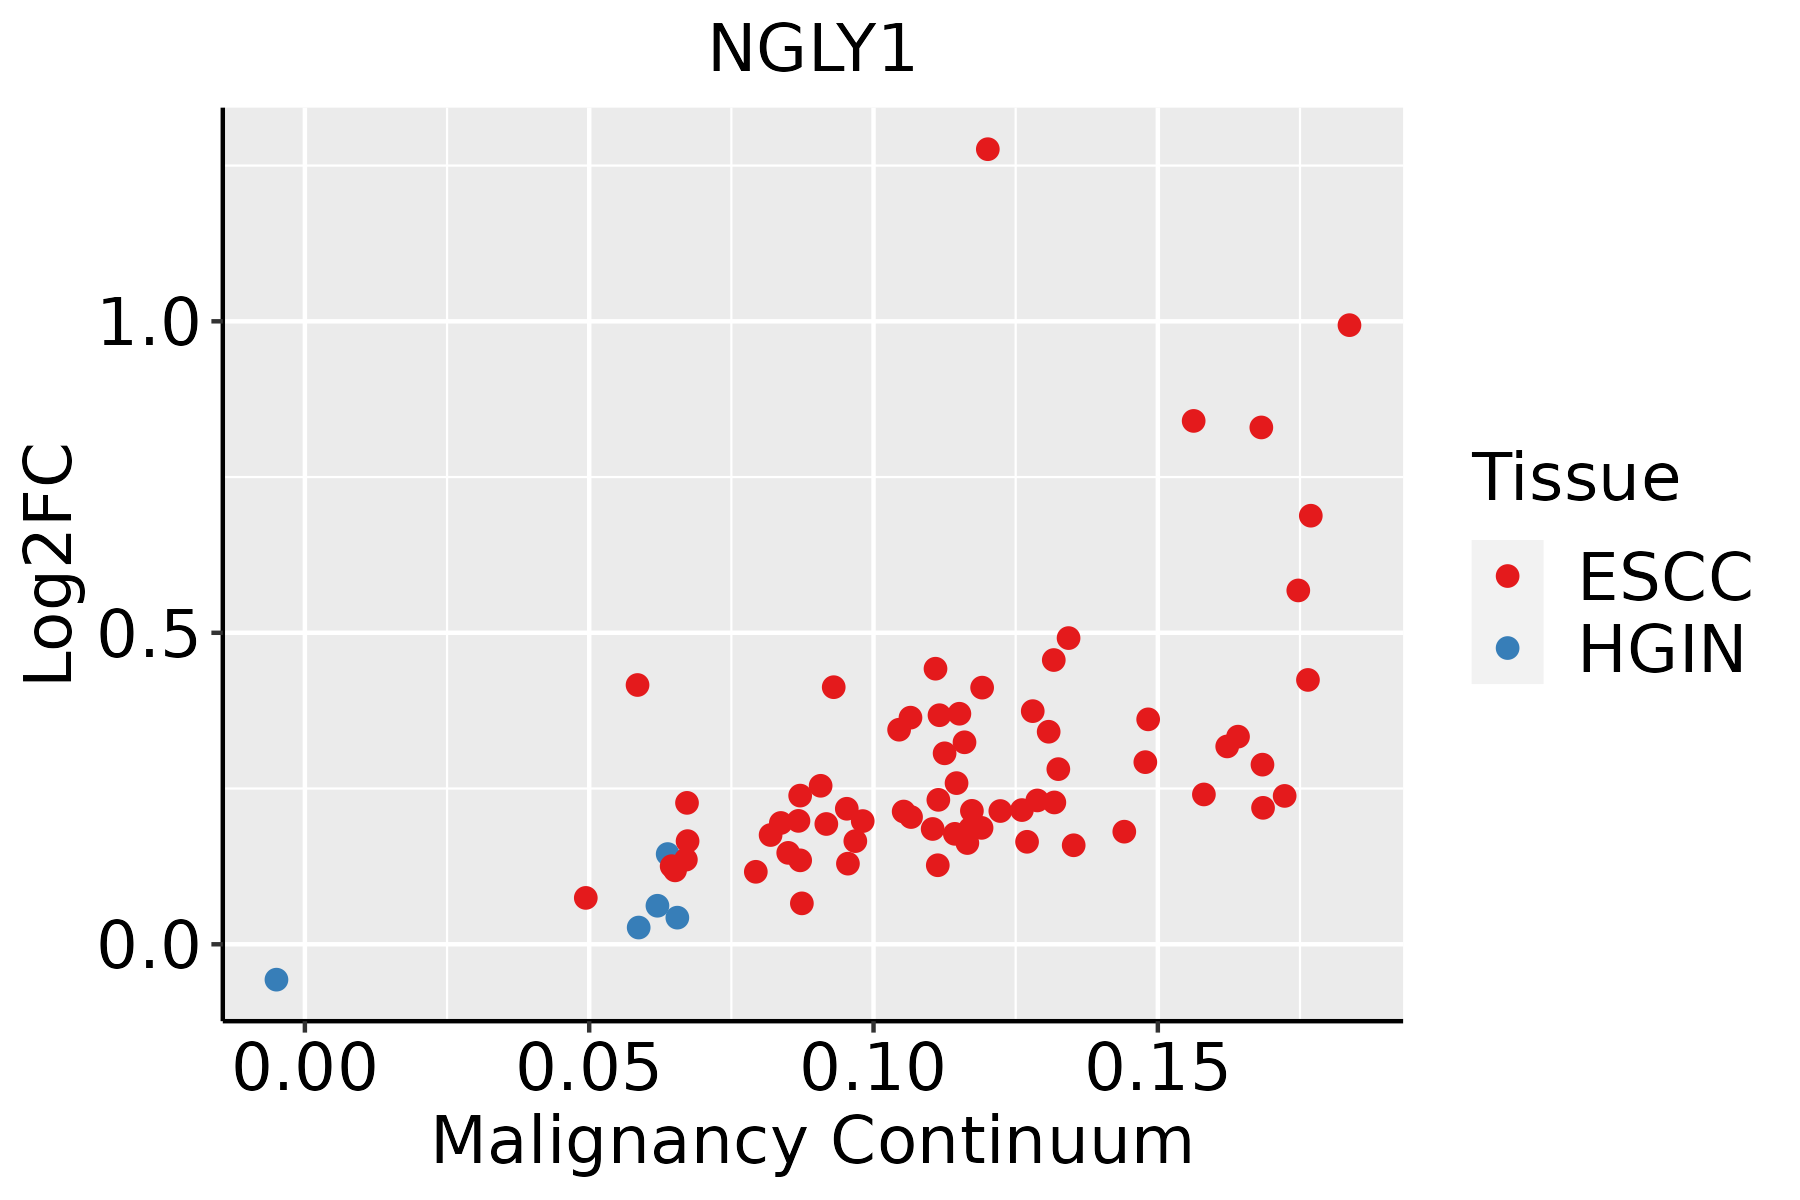 | ESCC: Esophageal squamous cell carcinoma |
| HGIN: High-grade intraepithelial neoplasias | ||
| LGIN: Low-grade intraepithelial neoplasias | ||
| Liver | 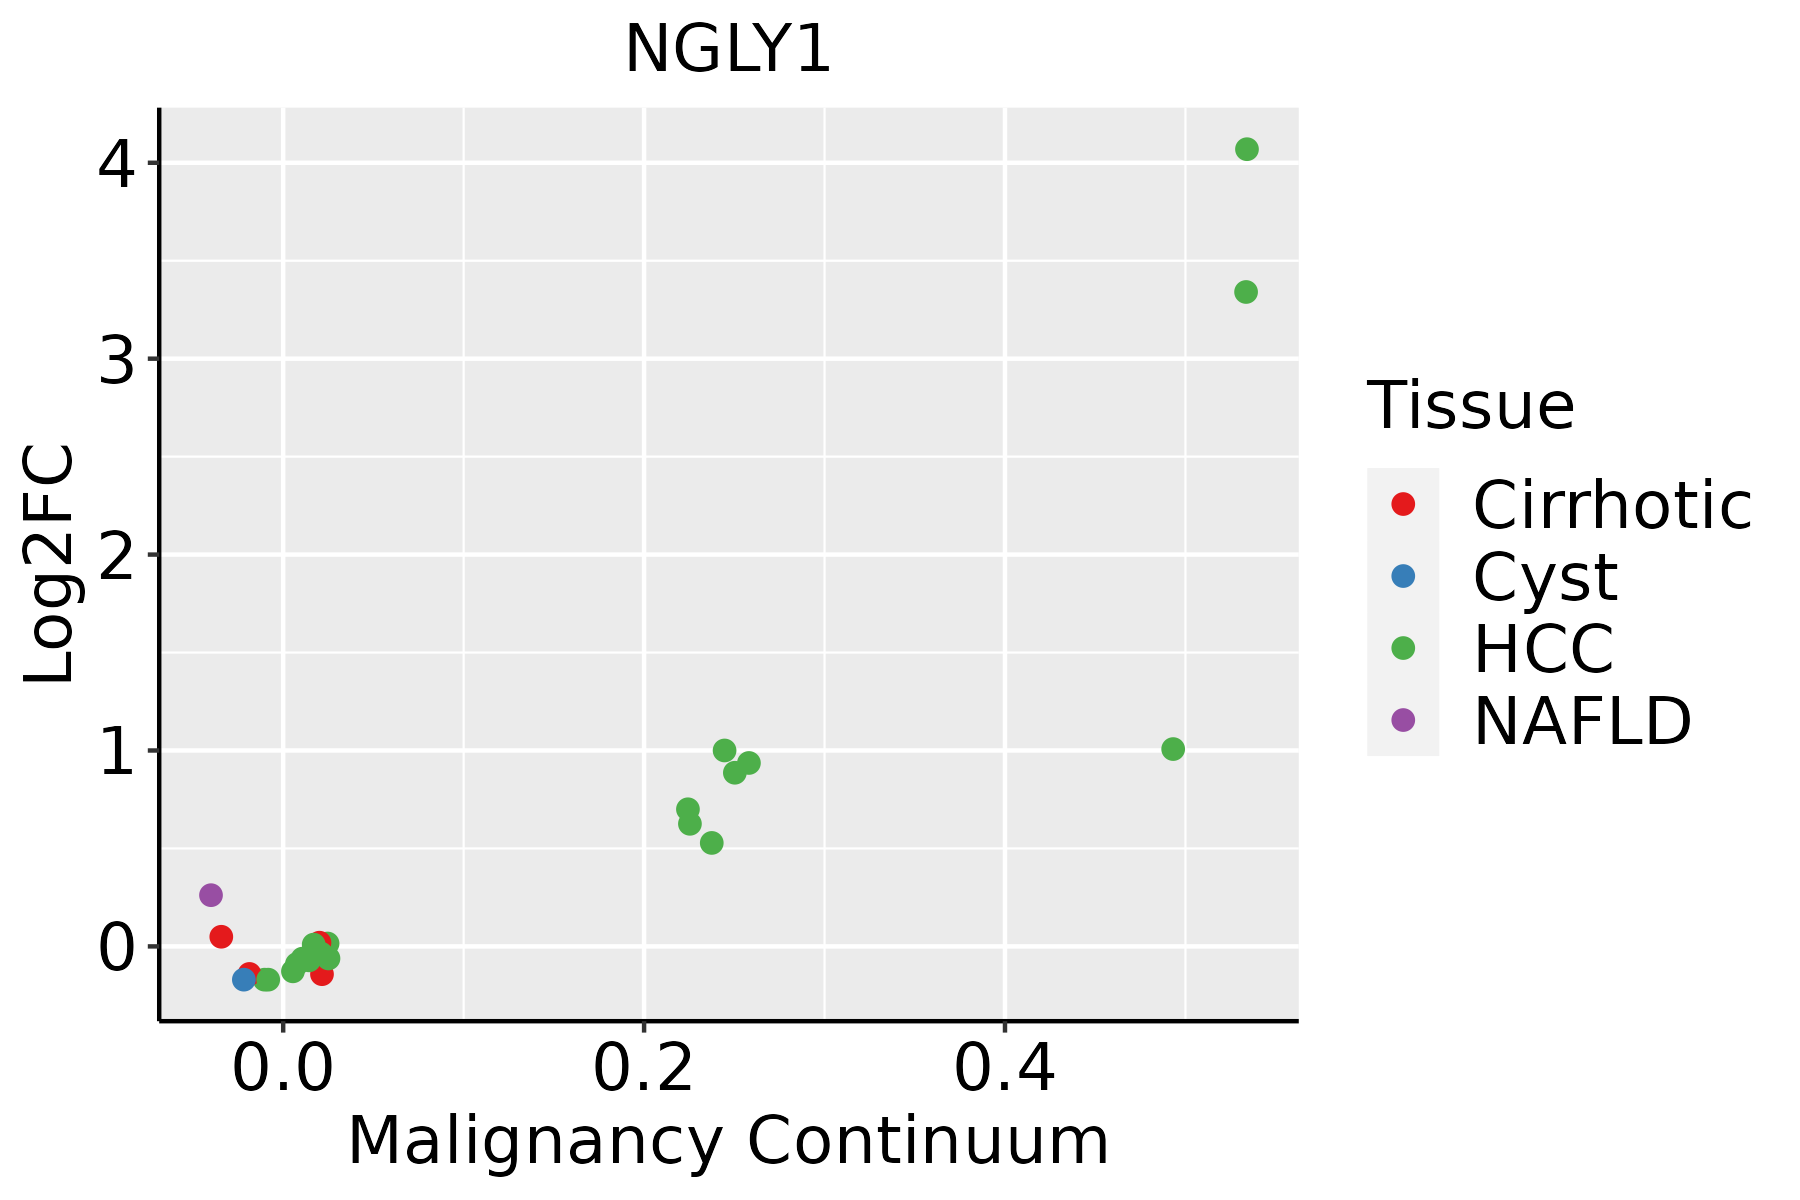 | HCC: Hepatocellular carcinoma |
| NAFLD: Non-alcoholic fatty liver disease | ||
| Thyroid | 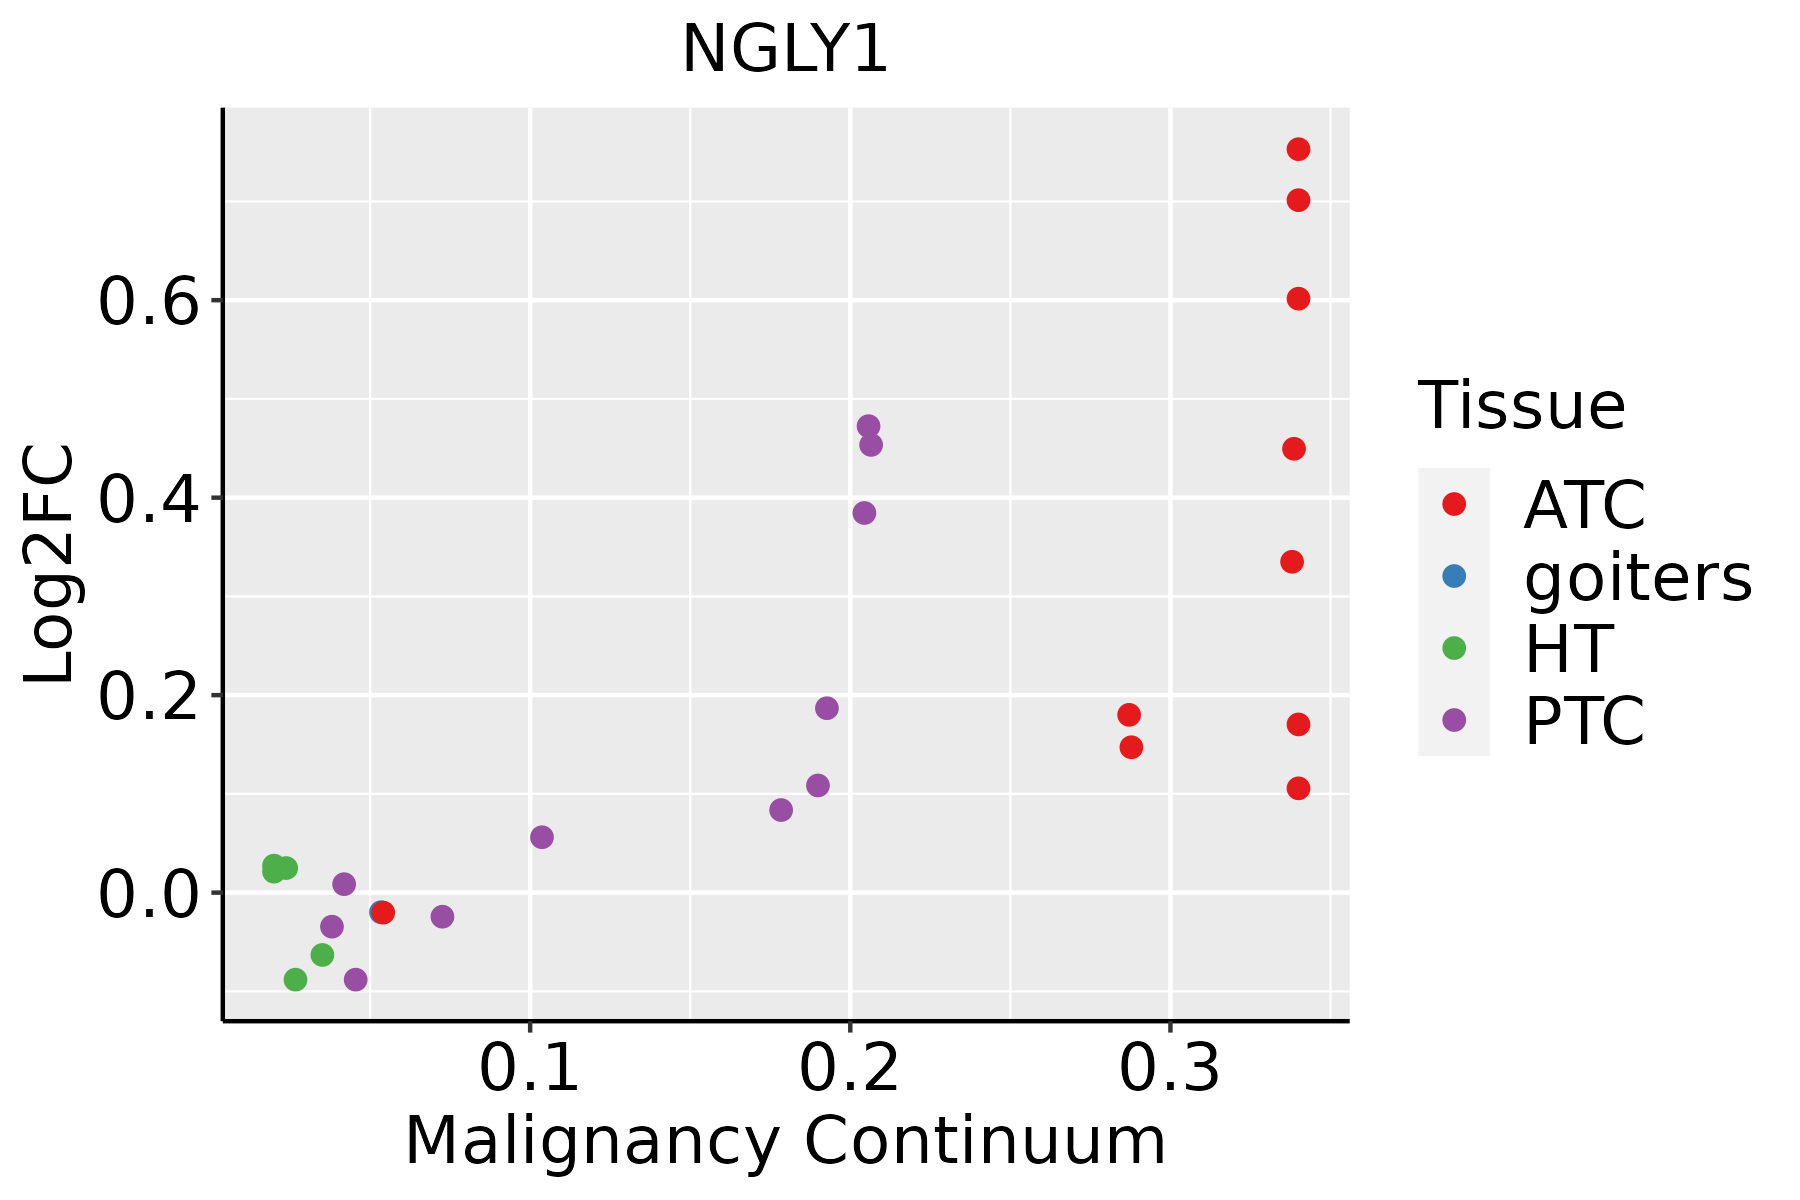 | ATC: Anaplastic thyroid cancer |
| HT: Hashimoto's thyroiditis | ||
| PTC: Papillary thyroid cancer |
| ∗log2FC in expression of this searched gene in stem-like cells from each diseased tissue sample relative to stem-like cells in normal samples in each tissue plotted against the malignancy continuum. Samples are colored based on if they are from different disease stage. |
Top |
Malignant transformation related pathway analysis |
| Find out the enriched GO biological processes and KEGG pathways involved in transition from healthy to precancer to cancer |
| Tissue | Disease Stage | Enriched GO biological Processes |
| Colorectum | AD |  |
| Colorectum | SER |  |
| Colorectum | MSS |  |
| Colorectum | MSI-H |  |
| Colorectum | FAP |  |
| ∗Top 15 enriched GO BP terms are showed in the bar plot of each disease state in each tissue. Each row represents a significant GO biological process which is colored according to the -log10(p.adjust). |
| Page: 1 2 3 4 5 6 7 8 9 |
| GO ID | Tissue | Disease Stage | Description | Gene Ratio | Bg Ratio | pvalue | p.adjust | Count |
| GO:0010498111 | Esophagus | ESCC | proteasomal protein catabolic process | 369/8552 | 490/18723 | 1.13e-41 | 1.80e-38 | 369 |
| GO:0034976111 | Esophagus | ESCC | response to endoplasmic reticulum stress | 192/8552 | 256/18723 | 7.15e-22 | 1.30e-19 | 192 |
| GO:0006457110 | Esophagus | ESCC | protein folding | 163/8552 | 212/18723 | 1.13e-20 | 1.74e-18 | 163 |
| GO:0035966111 | Esophagus | ESCC | response to topologically incorrect protein | 125/8552 | 159/18723 | 1.44e-17 | 1.27e-15 | 125 |
| GO:0035967111 | Esophagus | ESCC | cellular response to topologically incorrect protein | 90/8552 | 116/18723 | 1.94e-12 | 8.11e-11 | 90 |
| GO:003650315 | Esophagus | ESCC | ERAD pathway | 82/8552 | 107/18723 | 5.80e-11 | 1.84e-09 | 82 |
| GO:00091002 | Esophagus | ESCC | glycoprotein metabolic process | 226/8552 | 387/18723 | 2.64e-07 | 3.94e-06 | 226 |
| GO:007171211 | Esophagus | ESCC | ER-associated misfolded protein catabolic process | 12/8552 | 12/18723 | 8.21e-05 | 6.01e-04 | 12 |
| GO:00517884 | Esophagus | ESCC | response to misfolded protein | 21/8552 | 25/18723 | 9.12e-05 | 6.54e-04 | 21 |
| GO:00712184 | Esophagus | ESCC | cellular response to misfolded protein | 19/8552 | 23/18723 | 3.12e-04 | 1.85e-03 | 19 |
| GO:19011362 | Esophagus | ESCC | carbohydrate derivative catabolic process | 99/8552 | 172/18723 | 1.11e-03 | 5.54e-03 | 99 |
| GO:00065154 | Esophagus | ESCC | protein quality control for misfolded or incompletely synthesized proteins | 21/8552 | 28/18723 | 1.57e-03 | 7.33e-03 | 21 |
| GO:00065173 | Esophagus | ESCC | protein deglycosylation | 19/8552 | 26/18723 | 4.31e-03 | 1.71e-02 | 19 |
| GO:0006516 | Esophagus | ESCC | glycoprotein catabolic process | 19/8552 | 28/18723 | 1.49e-02 | 4.84e-02 | 19 |
| GO:001049822 | Liver | HCC | proteasomal protein catabolic process | 351/7958 | 490/18723 | 6.92e-40 | 1.46e-36 | 351 |
| GO:003497612 | Liver | HCC | response to endoplasmic reticulum stress | 189/7958 | 256/18723 | 1.43e-24 | 4.06e-22 | 189 |
| GO:000645712 | Liver | HCC | protein folding | 160/7958 | 212/18723 | 1.07e-22 | 1.88e-20 | 160 |
| GO:003596612 | Liver | HCC | response to topologically incorrect protein | 123/7958 | 159/18723 | 2.60e-19 | 3.44e-17 | 123 |
| GO:003650311 | Liver | HCC | ERAD pathway | 88/7958 | 107/18723 | 2.87e-17 | 2.85e-15 | 88 |
| GO:003596712 | Liver | HCC | cellular response to topologically incorrect protein | 89/7958 | 116/18723 | 5.61e-14 | 3.39e-12 | 89 |
| Page: 1 2 3 |
| Pathway ID | Tissue | Disease Stage | Description | Gene Ratio | Bg Ratio | pvalue | p.adjust | qvalue | Count |
| hsa04141211 | Esophagus | ESCC | Protein processing in endoplasmic reticulum | 147/4205 | 174/8465 | 3.29e-22 | 1.10e-19 | 5.64e-20 | 147 |
| hsa04141310 | Esophagus | ESCC | Protein processing in endoplasmic reticulum | 147/4205 | 174/8465 | 3.29e-22 | 1.10e-19 | 5.64e-20 | 147 |
| hsa0414122 | Liver | HCC | Protein processing in endoplasmic reticulum | 146/4020 | 174/8465 | 7.34e-24 | 2.46e-21 | 1.37e-21 | 146 |
| hsa0414132 | Liver | HCC | Protein processing in endoplasmic reticulum | 146/4020 | 174/8465 | 7.34e-24 | 2.46e-21 | 1.37e-21 | 146 |
| Page: 1 |
Top |
Cell-cell communication analysis |
| Identification of potential cell-cell interactions between two cell types and their ligand-receptor pairs for different disease states |
| Ligand | Receptor | LRpair | Pathway | Tissue | Disease Stage |
| Page: 1 |
Top |
Single-cell gene regulatory network inference analysis |
| Find out the significant the regulons (TFs) and the target genes of each regulon across cell types for different disease states |
| TF | Cell Type | Tissue | Disease Stage | Target Gene | RSS | Regulon Activity |
| ∗The dot plots of a searched regulon are shown for all cell subpopulations in each disease state of each tissue based on the regulon specific score inferred using pySCENIC and by calculating the average expression. |
| Page: 1 |
Top |
Somatic mutation of malignant transformation related genes |
| Annotation of somatic variants for genes involved in malignant transformation |
| Hugo Symbol | Variant Class | Variant Classification | dbSNP RS | HGVSc | HGVSp | HGVSp Short | SWISSPROT | BIOTYPE | SIFT | PolyPhen | Tumor Sample Barcode | Tissue | Histology | Sex | Age | Stage | Therapy Types | Drugs | Outcome |
| NGLY1 | SNV | Missense_Mutation | c.1654N>C | p.Ser552Pro | p.S552P | Q96IV0 | protein_coding | deleterious(0) | probably_damaging(0.99) | TCGA-AO-A0J6-01 | Breast | breast invasive carcinoma | Female | <65 | I/II | Chemotherapy | doxorubicin | SD | |
| NGLY1 | SNV | Missense_Mutation | rs767547861 | c.41N>T | p.Ser14Phe | p.S14F | Q96IV0 | protein_coding | deleterious(0) | probably_damaging(0.999) | TCGA-BH-A18V-01 | Breast | breast invasive carcinoma | Female | <65 | I/II | Unknown | Unknown | SD |
| NGLY1 | SNV | Missense_Mutation | novel | c.983N>T | p.Arg328Leu | p.R328L | Q96IV0 | protein_coding | deleterious(0) | probably_damaging(1) | TCGA-E9-A1RG-01 | Breast | breast invasive carcinoma | Female | <65 | III/IV | Hormone Therapy | tamoxiphen | SD |
| NGLY1 | deletion | Frame_Shift_Del | novel | c.344delN | p.Gly115AlafsTer8 | p.G115Afs*8 | Q96IV0 | protein_coding | TCGA-D8-A27V-01 | Breast | breast invasive carcinoma | Female | <65 | I/II | Hormone Therapy | tamoxiphen | SD | ||
| NGLY1 | deletion | Frame_Shift_Del | novel | c.301delN | p.Ile101PhefsTer4 | p.I101Ffs*4 | Q96IV0 | protein_coding | TCGA-EW-A2FV-01 | Breast | breast invasive carcinoma | Female | <65 | III/IV | Chemotherapy | docetaxel | SD | ||
| NGLY1 | SNV | Missense_Mutation | novel | c.1586N>C | p.Arg529Thr | p.R529T | Q96IV0 | protein_coding | deleterious(0) | probably_damaging(1) | TCGA-EA-A3Y4-01 | Cervix | cervical & endocervical cancer | Female | <65 | I/II | Unknown | Unknown | SD |
| NGLY1 | insertion | Nonsense_Mutation | novel | c.1550_1551insAGGCA | p.Trp517Ter | p.W517* | Q96IV0 | protein_coding | TCGA-DS-A1OD-01 | Cervix | cervical & endocervical cancer | Female | <65 | I/II | Chemotherapy | cisplatin | SD | ||
| NGLY1 | SNV | Missense_Mutation | rs142766875 | c.1232N>A | p.Arg411Gln | p.R411Q | Q96IV0 | protein_coding | tolerated(0.14) | benign(0.232) | TCGA-A6-2672-01 | Colorectum | colon adenocarcinoma | Female | >=65 | III/IV | Unknown | Unknown | SD |
| NGLY1 | SNV | Missense_Mutation | c.1697N>T | p.Ser566Ile | p.S566I | Q96IV0 | protein_coding | deleterious(0.01) | benign(0.157) | TCGA-AA-3663-01 | Colorectum | colon adenocarcinoma | Male | <65 | I/II | Unknown | Unknown | SD | |
| NGLY1 | SNV | Missense_Mutation | rs375732599 | c.304N>T | p.Arg102Cys | p.R102C | Q96IV0 | protein_coding | deleterious(0) | probably_damaging(0.999) | TCGA-AA-3984-01 | Colorectum | colon adenocarcinoma | Female | <65 | I/II | Unknown | Unknown | SD |
| Page: 1 2 3 4 5 6 7 |
Top |
Related drugs of malignant transformation related genes |
| Identification of chemicals and drugs interact with genes involved in malignant transfromation |
| (DGIdb 4.0) |
| Entrez ID | Symbol | Category | Interaction Types | Drug Claim Name | Drug Name | PMIDs |
| Page: 1 |

Copyright 2023-Present -The University of Texas Health Science Center at Houston |