
|
|||||
|
 | |
| |
| |
| |
| |
| |
|
Gene: NGFR |
Gene summary for NGFR |
| Gene information | Species | Human | Gene symbol | NGFR | Gene ID | 4804 |
| Gene name | nerve growth factor receptor | |
| Gene Alias | CD271 | |
| Cytomap | 17q21.33 | |
| Gene Type | protein-coding | GO ID | GO:0000902 | UniProtAcc | P08138 |
Top |
Malignant transformation analysis |
| Identification of the aberrant gene expression in precancerous and cancerous lesions by comparing the gene expression of stem-like cells in diseased tissues with normal stem cells |
| Entrez ID | Symbol | Replicates | Species | Organ | Tissue | Adj P-value | Log2FC | Malignancy |
| 4804 | NGFR | LZE8T | Human | Esophagus | ESCC | 1.09e-03 | 1.52e-01 | 0.067 |
| 4804 | NGFR | LZE24T | Human | Esophagus | ESCC | 1.63e-04 | 2.52e-01 | 0.0596 |
| 4804 | NGFR | LZE21T | Human | Esophagus | ESCC | 4.41e-02 | 1.28e-01 | 0.0655 |
| 4804 | NGFR | P2T-E | Human | Esophagus | ESCC | 1.04e-70 | 1.77e+00 | 0.1177 |
| 4804 | NGFR | P4T-E | Human | Esophagus | ESCC | 1.54e-02 | 3.89e-01 | 0.1323 |
| 4804 | NGFR | P8T-E | Human | Esophagus | ESCC | 9.91e-05 | 1.91e-01 | 0.0889 |
| 4804 | NGFR | P10T-E | Human | Esophagus | ESCC | 4.65e-07 | 1.44e-01 | 0.116 |
| 4804 | NGFR | P11T-E | Human | Esophagus | ESCC | 4.98e-31 | 2.05e+00 | 0.1426 |
| 4804 | NGFR | P12T-E | Human | Esophagus | ESCC | 1.16e-02 | 2.31e-01 | 0.1122 |
| 4804 | NGFR | P15T-E | Human | Esophagus | ESCC | 9.44e-16 | 5.14e-01 | 0.1149 |
| 4804 | NGFR | P16T-E | Human | Esophagus | ESCC | 2.56e-32 | 7.57e-01 | 0.1153 |
| 4804 | NGFR | P17T-E | Human | Esophagus | ESCC | 7.47e-03 | 1.19e+00 | 0.1278 |
| 4804 | NGFR | P19T-E | Human | Esophagus | ESCC | 6.05e-07 | 2.10e+00 | 0.1662 |
| 4804 | NGFR | P20T-E | Human | Esophagus | ESCC | 9.36e-09 | 4.11e-01 | 0.1124 |
| 4804 | NGFR | P21T-E | Human | Esophagus | ESCC | 5.40e-41 | 1.01e+00 | 0.1617 |
| 4804 | NGFR | P22T-E | Human | Esophagus | ESCC | 1.44e-08 | 1.54e-01 | 0.1236 |
| 4804 | NGFR | P23T-E | Human | Esophagus | ESCC | 3.06e-04 | 1.26e-01 | 0.108 |
| 4804 | NGFR | P24T-E | Human | Esophagus | ESCC | 5.73e-06 | 9.12e-01 | 0.1287 |
| 4804 | NGFR | P26T-E | Human | Esophagus | ESCC | 2.66e-26 | 5.44e-01 | 0.1276 |
| 4804 | NGFR | P27T-E | Human | Esophagus | ESCC | 1.19e-17 | 4.32e-01 | 0.1055 |
| Page: 1 2 3 |
| Tissue | Expression Dynamics | Abbreviation |
| Esophagus |  | ESCC: Esophageal squamous cell carcinoma |
| HGIN: High-grade intraepithelial neoplasias | ||
| LGIN: Low-grade intraepithelial neoplasias | ||
| Oral Cavity | 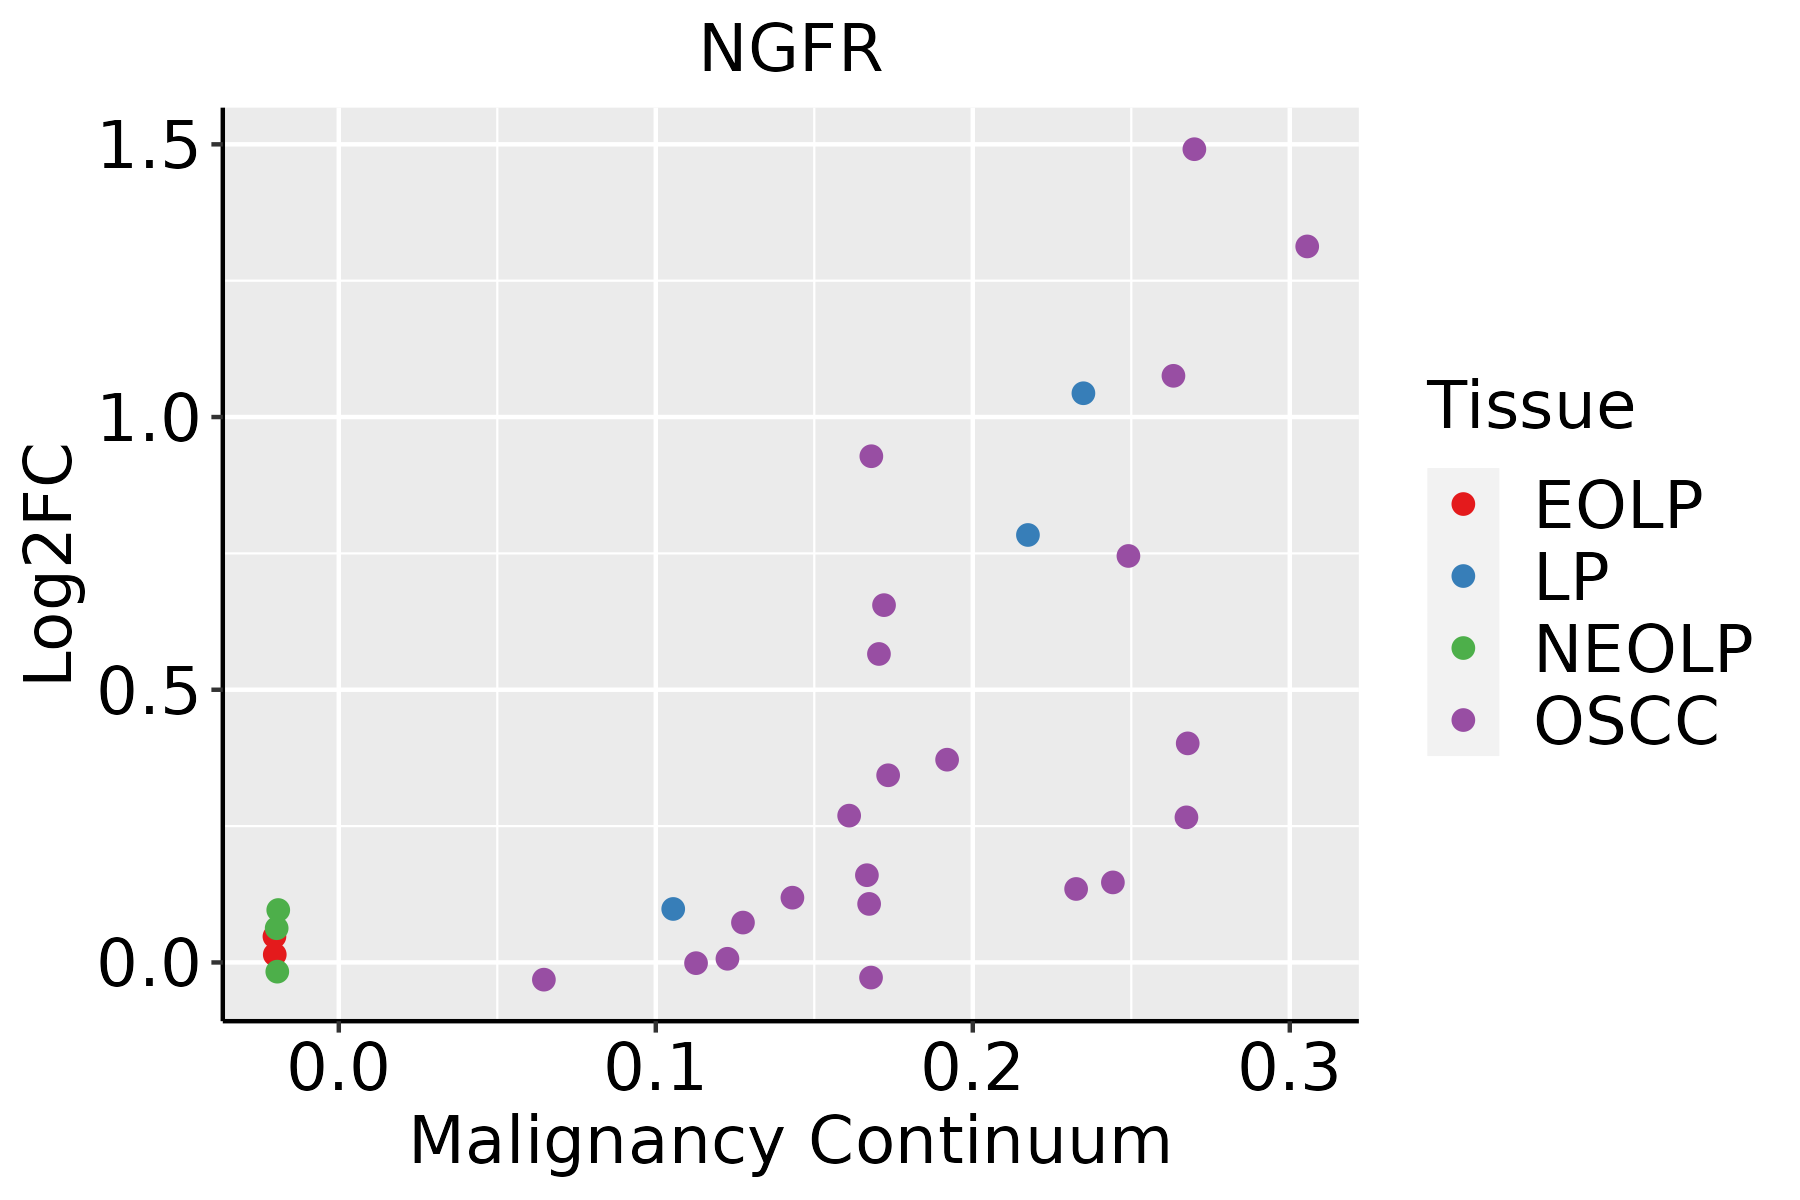 | EOLP: Erosive Oral lichen planus |
| LP: leukoplakia | ||
| NEOLP: Non-erosive oral lichen planus | ||
| OSCC: Oral squamous cell carcinoma |
| ∗log2FC in expression of this searched gene in stem-like cells from each diseased tissue sample relative to stem-like cells in normal samples in each tissue plotted against the malignancy continuum. Samples are colored based on if they are from different disease stage. |
Top |
Malignant transformation related pathway analysis |
| Find out the enriched GO biological processes and KEGG pathways involved in transition from healthy to precancer to cancer |
| Tissue | Disease Stage | Enriched GO biological Processes |
| Colorectum | AD |  |
| Colorectum | SER |  |
| Colorectum | MSS |  |
| Colorectum | MSI-H |  |
| Colorectum | FAP |  |
| ∗Top 15 enriched GO BP terms are showed in the bar plot of each disease state in each tissue. Each row represents a significant GO biological process which is colored according to the -log10(p.adjust). |
| Page: 1 2 3 4 5 6 7 8 9 |
| GO ID | Tissue | Disease Stage | Description | Gene Ratio | Bg Ratio | pvalue | p.adjust | Count |
| GO:2001233111 | Esophagus | ESCC | regulation of apoptotic signaling pathway | 256/8552 | 356/18723 | 4.11e-24 | 1.04e-21 | 256 |
| GO:003450418 | Esophagus | ESCC | protein localization to nucleus | 211/8552 | 290/18723 | 4.06e-21 | 6.60e-19 | 211 |
| GO:0045862111 | Esophagus | ESCC | positive regulation of proteolysis | 256/8552 | 372/18723 | 7.88e-20 | 9.43e-18 | 256 |
| GO:1903829111 | Esophagus | ESCC | positive regulation of cellular protein localization | 199/8552 | 276/18723 | 2.99e-19 | 3.45e-17 | 199 |
| GO:190018018 | Esophagus | ESCC | regulation of protein localization to nucleus | 102/8552 | 136/18723 | 2.84e-12 | 1.13e-10 | 102 |
| GO:2000116111 | Esophagus | ESCC | regulation of cysteine-type endopeptidase activity | 158/8552 | 235/18723 | 1.67e-11 | 5.90e-10 | 158 |
| GO:0043281111 | Esophagus | ESCC | regulation of cysteine-type endopeptidase activity involved in apoptotic process | 143/8552 | 209/18723 | 2.12e-11 | 7.31e-10 | 143 |
| GO:190018217 | Esophagus | ESCC | positive regulation of protein localization to nucleus | 70/8552 | 87/18723 | 2.63e-11 | 8.99e-10 | 70 |
| GO:2001235110 | Esophagus | ESCC | positive regulation of apoptotic signaling pathway | 92/8552 | 126/18723 | 3.91e-10 | 1.05e-08 | 92 |
| GO:0010952111 | Esophagus | ESCC | positive regulation of peptidase activity | 133/8552 | 197/18723 | 4.31e-10 | 1.14e-08 | 133 |
| GO:0052547111 | Esophagus | ESCC | regulation of peptidase activity | 275/8552 | 461/18723 | 7.54e-10 | 1.88e-08 | 275 |
| GO:0070997111 | Esophagus | ESCC | neuron death | 216/8552 | 361/18723 | 3.49e-08 | 6.45e-07 | 216 |
| GO:0052548111 | Esophagus | ESCC | regulation of endopeptidase activity | 253/8552 | 432/18723 | 3.68e-08 | 6.78e-07 | 253 |
| GO:00435888 | Esophagus | ESCC | skin development | 163/8552 | 263/18723 | 6.48e-08 | 1.14e-06 | 163 |
| GO:000726510 | Esophagus | ESCC | Ras protein signal transduction | 201/8552 | 337/18723 | 1.44e-07 | 2.30e-06 | 201 |
| GO:0010950111 | Esophagus | ESCC | positive regulation of endopeptidase activity | 116/8552 | 179/18723 | 1.77e-07 | 2.79e-06 | 116 |
| GO:000854410 | Esophagus | ESCC | epidermis development | 193/8552 | 324/18723 | 2.87e-07 | 4.19e-06 | 193 |
| GO:190165319 | Esophagus | ESCC | cellular response to peptide | 208/8552 | 359/18723 | 1.68e-06 | 2.01e-05 | 208 |
| GO:0051402110 | Esophagus | ESCC | neuron apoptotic process | 148/8552 | 246/18723 | 3.08e-06 | 3.47e-05 | 148 |
| GO:004814414 | Esophagus | ESCC | fibroblast proliferation | 57/8552 | 81/18723 | 5.83e-06 | 6.03e-05 | 57 |
| Page: 1 2 3 4 5 6 |
| Pathway ID | Tissue | Disease Stage | Description | Gene Ratio | Bg Ratio | pvalue | p.adjust | qvalue | Count |
| hsa0472225 | Esophagus | ESCC | Neurotrophin signaling pathway | 80/4205 | 119/8465 | 7.33e-05 | 3.07e-04 | 1.57e-04 | 80 |
| hsa042156 | Esophagus | ESCC | Apoptosis - multiple species | 25/4205 | 32/8465 | 9.13e-04 | 2.92e-03 | 1.49e-03 | 25 |
| hsa052028 | Esophagus | ESCC | Transcriptional misregulation in cancer | 116/4205 | 193/8465 | 2.08e-03 | 5.95e-03 | 3.05e-03 | 116 |
| hsa041517 | Esophagus | ESCC | PI3K-Akt signaling pathway | 197/4205 | 354/8465 | 1.24e-02 | 2.83e-02 | 1.45e-02 | 197 |
| hsa04722111 | Esophagus | ESCC | Neurotrophin signaling pathway | 80/4205 | 119/8465 | 7.33e-05 | 3.07e-04 | 1.57e-04 | 80 |
| hsa0421511 | Esophagus | ESCC | Apoptosis - multiple species | 25/4205 | 32/8465 | 9.13e-04 | 2.92e-03 | 1.49e-03 | 25 |
| hsa0520213 | Esophagus | ESCC | Transcriptional misregulation in cancer | 116/4205 | 193/8465 | 2.08e-03 | 5.95e-03 | 3.05e-03 | 116 |
| hsa0415114 | Esophagus | ESCC | PI3K-Akt signaling pathway | 197/4205 | 354/8465 | 1.24e-02 | 2.83e-02 | 1.45e-02 | 197 |
| hsa0472220 | Oral cavity | OSCC | Neurotrophin signaling pathway | 74/3704 | 119/8465 | 3.55e-05 | 1.49e-04 | 7.58e-05 | 74 |
| hsa0401014 | Oral cavity | OSCC | MAPK signaling pathway | 165/3704 | 302/8465 | 7.11e-05 | 2.74e-04 | 1.40e-04 | 165 |
| hsa04215 | Oral cavity | OSCC | Apoptosis - multiple species | 25/3704 | 32/8465 | 7.74e-05 | 2.88e-04 | 1.47e-04 | 25 |
| hsa041516 | Oral cavity | OSCC | PI3K-Akt signaling pathway | 185/3704 | 354/8465 | 6.26e-04 | 1.86e-03 | 9.49e-04 | 185 |
| hsa0401518 | Oral cavity | OSCC | Rap1 signaling pathway | 107/3704 | 210/8465 | 2.01e-02 | 4.34e-02 | 2.21e-02 | 107 |
| hsa04722110 | Oral cavity | OSCC | Neurotrophin signaling pathway | 74/3704 | 119/8465 | 3.55e-05 | 1.49e-04 | 7.58e-05 | 74 |
| hsa0401015 | Oral cavity | OSCC | MAPK signaling pathway | 165/3704 | 302/8465 | 7.11e-05 | 2.74e-04 | 1.40e-04 | 165 |
| hsa042151 | Oral cavity | OSCC | Apoptosis - multiple species | 25/3704 | 32/8465 | 7.74e-05 | 2.88e-04 | 1.47e-04 | 25 |
| hsa0415113 | Oral cavity | OSCC | PI3K-Akt signaling pathway | 185/3704 | 354/8465 | 6.26e-04 | 1.86e-03 | 9.49e-04 | 185 |
| hsa0401519 | Oral cavity | OSCC | Rap1 signaling pathway | 107/3704 | 210/8465 | 2.01e-02 | 4.34e-02 | 2.21e-02 | 107 |
| hsa0472224 | Oral cavity | LP | Neurotrophin signaling pathway | 46/2418 | 119/8465 | 1.07e-02 | 3.77e-02 | 2.43e-02 | 46 |
| hsa0472234 | Oral cavity | LP | Neurotrophin signaling pathway | 46/2418 | 119/8465 | 1.07e-02 | 3.77e-02 | 2.43e-02 | 46 |
| Page: 1 |
Top |
Cell-cell communication analysis |
| Identification of potential cell-cell interactions between two cell types and their ligand-receptor pairs for different disease states |
| Ligand | Receptor | LRpair | Pathway | Tissue | Disease Stage |
| NGF | NGFR | NGF_NGFR | NGF | Liver | Healthy |
| Page: 1 |
Top |
Single-cell gene regulatory network inference analysis |
| Find out the significant the regulons (TFs) and the target genes of each regulon across cell types for different disease states |
| TF | Cell Type | Tissue | Disease Stage | Target Gene | RSS | Regulon Activity |
| ∗The dot plots of a searched regulon are shown for all cell subpopulations in each disease state of each tissue based on the regulon specific score inferred using pySCENIC and by calculating the average expression. |
| Page: 1 |
Top |
Somatic mutation of malignant transformation related genes |
| Annotation of somatic variants for genes involved in malignant transformation |
| Hugo Symbol | Variant Class | Variant Classification | dbSNP RS | HGVSc | HGVSp | HGVSp Short | SWISSPROT | BIOTYPE | SIFT | PolyPhen | Tumor Sample Barcode | Tissue | Histology | Sex | Age | Stage | Therapy Types | Drugs | Outcome |
| NGFR | insertion | Frame_Shift_Ins | novel | c.482_483insC | p.Asp162GlyfsTer55 | p.D162Gfs*55 | P08138 | protein_coding | TCGA-DS-A1OC-01 | Cervix | cervical & endocervical cancer | Female | <65 | I/II | Chemotherapy | gemcitabine | SD | ||
| NGFR | insertion | Frame_Shift_Ins | novel | c.484_485dupGA | p.Asp162GlufsTer64 | p.D162Efs*64 | P08138 | protein_coding | TCGA-DS-A1OC-01 | Cervix | cervical & endocervical cancer | Female | <65 | I/II | Chemotherapy | gemcitabine | SD | ||
| NGFR | SNV | Missense_Mutation | rs764232409 | c.377N>A | p.Arg126His | p.R126H | P08138 | protein_coding | tolerated(0.13) | benign(0.436) | TCGA-A6-5660-01 | Colorectum | colon adenocarcinoma | Male | >=65 | III/IV | Ancillary | leucovorin | SD |
| NGFR | SNV | Missense_Mutation | rs534528579 | c.1198G>A | p.Ala400Thr | p.A400T | P08138 | protein_coding | tolerated(0.25) | benign(0.139) | TCGA-AA-3666-01 | Colorectum | colon adenocarcinoma | Male | >=65 | III/IV | Unknown | Unknown | PD |
| NGFR | SNV | Missense_Mutation | rs116828180 | c.974N>T | p.Ser325Leu | p.S325L | P08138 | protein_coding | tolerated(0.28) | benign(0) | TCGA-AZ-4315-01 | Colorectum | colon adenocarcinoma | Male | <65 | I/II | Unknown | Unknown | SD |
| NGFR | SNV | Missense_Mutation | c.925N>A | p.Val309Met | p.V309M | P08138 | protein_coding | deleterious(0) | probably_damaging(0.999) | TCGA-CM-6162-01 | Colorectum | colon adenocarcinoma | Female | <65 | III/IV | Chemotherapy | oxaliplatin | SD | |
| NGFR | SNV | Missense_Mutation | rs759353737 | c.353N>T | p.Thr118Met | p.T118M | P08138 | protein_coding | tolerated(0.11) | benign(0.031) | TCGA-D5-6920-01 | Colorectum | colon adenocarcinoma | Female | >=65 | I/II | Unknown | Unknown | SD |
| NGFR | SNV | Missense_Mutation | c.1120N>T | p.Asp374Tyr | p.D374Y | P08138 | protein_coding | deleterious(0.02) | probably_damaging(0.951) | TCGA-AG-A002-01 | Colorectum | rectum adenocarcinoma | Male | <65 | I/II | Unknown | Unknown | SD | |
| NGFR | deletion | Frame_Shift_Del | c.1251delN | p.Cys418AlafsTer48 | p.C418Afs*48 | P08138 | protein_coding | TCGA-AZ-6598-01 | Colorectum | colon adenocarcinoma | Female | >=65 | I/II | Unknown | Unknown | SD | |||
| NGFR | SNV | Missense_Mutation | rs143067054 | c.1151N>A | p.Arg384His | p.R384H | P08138 | protein_coding | tolerated(0.24) | probably_damaging(0.954) | TCGA-A5-A0GM-01 | Endometrium | uterine corpus endometrioid carcinoma | Female | <65 | I/II | Unknown | Unknown | SD |
| Page: 1 2 3 4 |
Top |
Related drugs of malignant transformation related genes |
| Identification of chemicals and drugs interact with genes involved in malignant transfromation |
| (DGIdb 4.0) |
| Entrez ID | Symbol | Category | Interaction Types | Drug Claim Name | Drug Name | PMIDs |
| 4804 | NGFR | CELL SURFACE, DRUGGABLE GENOME | Fulranumab | FULRANUMAB | ||
| 4804 | NGFR | CELL SURFACE, DRUGGABLE GENOME | CXB909 | |||
| 4804 | NGFR | CELL SURFACE, DRUGGABLE GENOME | 178101573 | |||
| 4804 | NGFR | CELL SURFACE, DRUGGABLE GENOME | Voclosporin | VOCLOSPORIN | ||
| 4804 | NGFR | CELL SURFACE, DRUGGABLE GENOME | LM11A-31 | |||
| 4804 | NGFR | CELL SURFACE, DRUGGABLE GENOME | 178101723 | |||
| 4804 | NGFR | CELL SURFACE, DRUGGABLE GENOME | 178101729 | |||
| 4804 | NGFR | CELL SURFACE, DRUGGABLE GENOME | 178101730 | |||
| 4804 | NGFR | CELL SURFACE, DRUGGABLE GENOME | PYM50028 | |||
| 4804 | NGFR | CELL SURFACE, DRUGGABLE GENOME | Cenegermin | CENEGERMIN |
| Page: 1 2 |

Copyright 2023-Present -The University of Texas Health Science Center at Houston |