
|
|||||
|
 | |
| |
| |
| |
| |
| |
|
Gene: NGEF |
Gene summary for NGEF |
| Gene information | Species | Human | Gene symbol | NGEF | Gene ID | 25791 |
| Gene name | neuronal guanine nucleotide exchange factor | |
| Gene Alias | ARHGEF27 | |
| Cytomap | 2q37.1 | |
| Gene Type | protein-coding | GO ID | GO:0000902 | UniProtAcc | Q8N5V2 |
Top |
Malignant transformation analysis |
| Identification of the aberrant gene expression in precancerous and cancerous lesions by comparing the gene expression of stem-like cells in diseased tissues with normal stem cells |
| Entrez ID | Symbol | Replicates | Species | Organ | Tissue | Adj P-value | Log2FC | Malignancy |
| 25791 | NGEF | P2T-E | Human | Esophagus | ESCC | 8.95e-06 | 9.36e-02 | 0.1177 |
| 25791 | NGEF | P5T-E | Human | Esophagus | ESCC | 9.09e-06 | 1.78e-01 | 0.1327 |
| 25791 | NGEF | P8T-E | Human | Esophagus | ESCC | 2.89e-03 | 2.64e-02 | 0.0889 |
| 25791 | NGEF | P10T-E | Human | Esophagus | ESCC | 1.88e-17 | 3.69e-01 | 0.116 |
| 25791 | NGEF | P12T-E | Human | Esophagus | ESCC | 1.75e-12 | 2.29e-01 | 0.1122 |
| 25791 | NGEF | P15T-E | Human | Esophagus | ESCC | 2.97e-16 | 3.17e-01 | 0.1149 |
| 25791 | NGEF | P16T-E | Human | Esophagus | ESCC | 2.57e-03 | 3.19e-02 | 0.1153 |
| 25791 | NGEF | P20T-E | Human | Esophagus | ESCC | 4.43e-14 | 1.61e-01 | 0.1124 |
| 25791 | NGEF | P22T-E | Human | Esophagus | ESCC | 3.67e-08 | 1.89e-01 | 0.1236 |
| 25791 | NGEF | P26T-E | Human | Esophagus | ESCC | 8.46e-11 | 2.33e-01 | 0.1276 |
| 25791 | NGEF | P28T-E | Human | Esophagus | ESCC | 3.22e-10 | 1.07e-01 | 0.1149 |
| 25791 | NGEF | P30T-E | Human | Esophagus | ESCC | 4.07e-08 | 3.75e-01 | 0.137 |
| 25791 | NGEF | P31T-E | Human | Esophagus | ESCC | 8.31e-34 | 5.85e-01 | 0.1251 |
| 25791 | NGEF | P32T-E | Human | Esophagus | ESCC | 1.18e-13 | 3.16e-01 | 0.1666 |
| 25791 | NGEF | P37T-E | Human | Esophagus | ESCC | 5.44e-12 | 2.18e-01 | 0.1371 |
| 25791 | NGEF | P38T-E | Human | Esophagus | ESCC | 1.10e-03 | 1.01e-01 | 0.127 |
| 25791 | NGEF | P40T-E | Human | Esophagus | ESCC | 1.02e-08 | 1.94e-01 | 0.109 |
| 25791 | NGEF | P42T-E | Human | Esophagus | ESCC | 6.15e-10 | 2.22e-01 | 0.1175 |
| 25791 | NGEF | P49T-E | Human | Esophagus | ESCC | 1.36e-16 | 1.45e+00 | 0.1768 |
| 25791 | NGEF | P52T-E | Human | Esophagus | ESCC | 1.35e-09 | 2.34e-01 | 0.1555 |
| Page: 1 2 |
| Tissue | Expression Dynamics | Abbreviation |
| Esophagus | 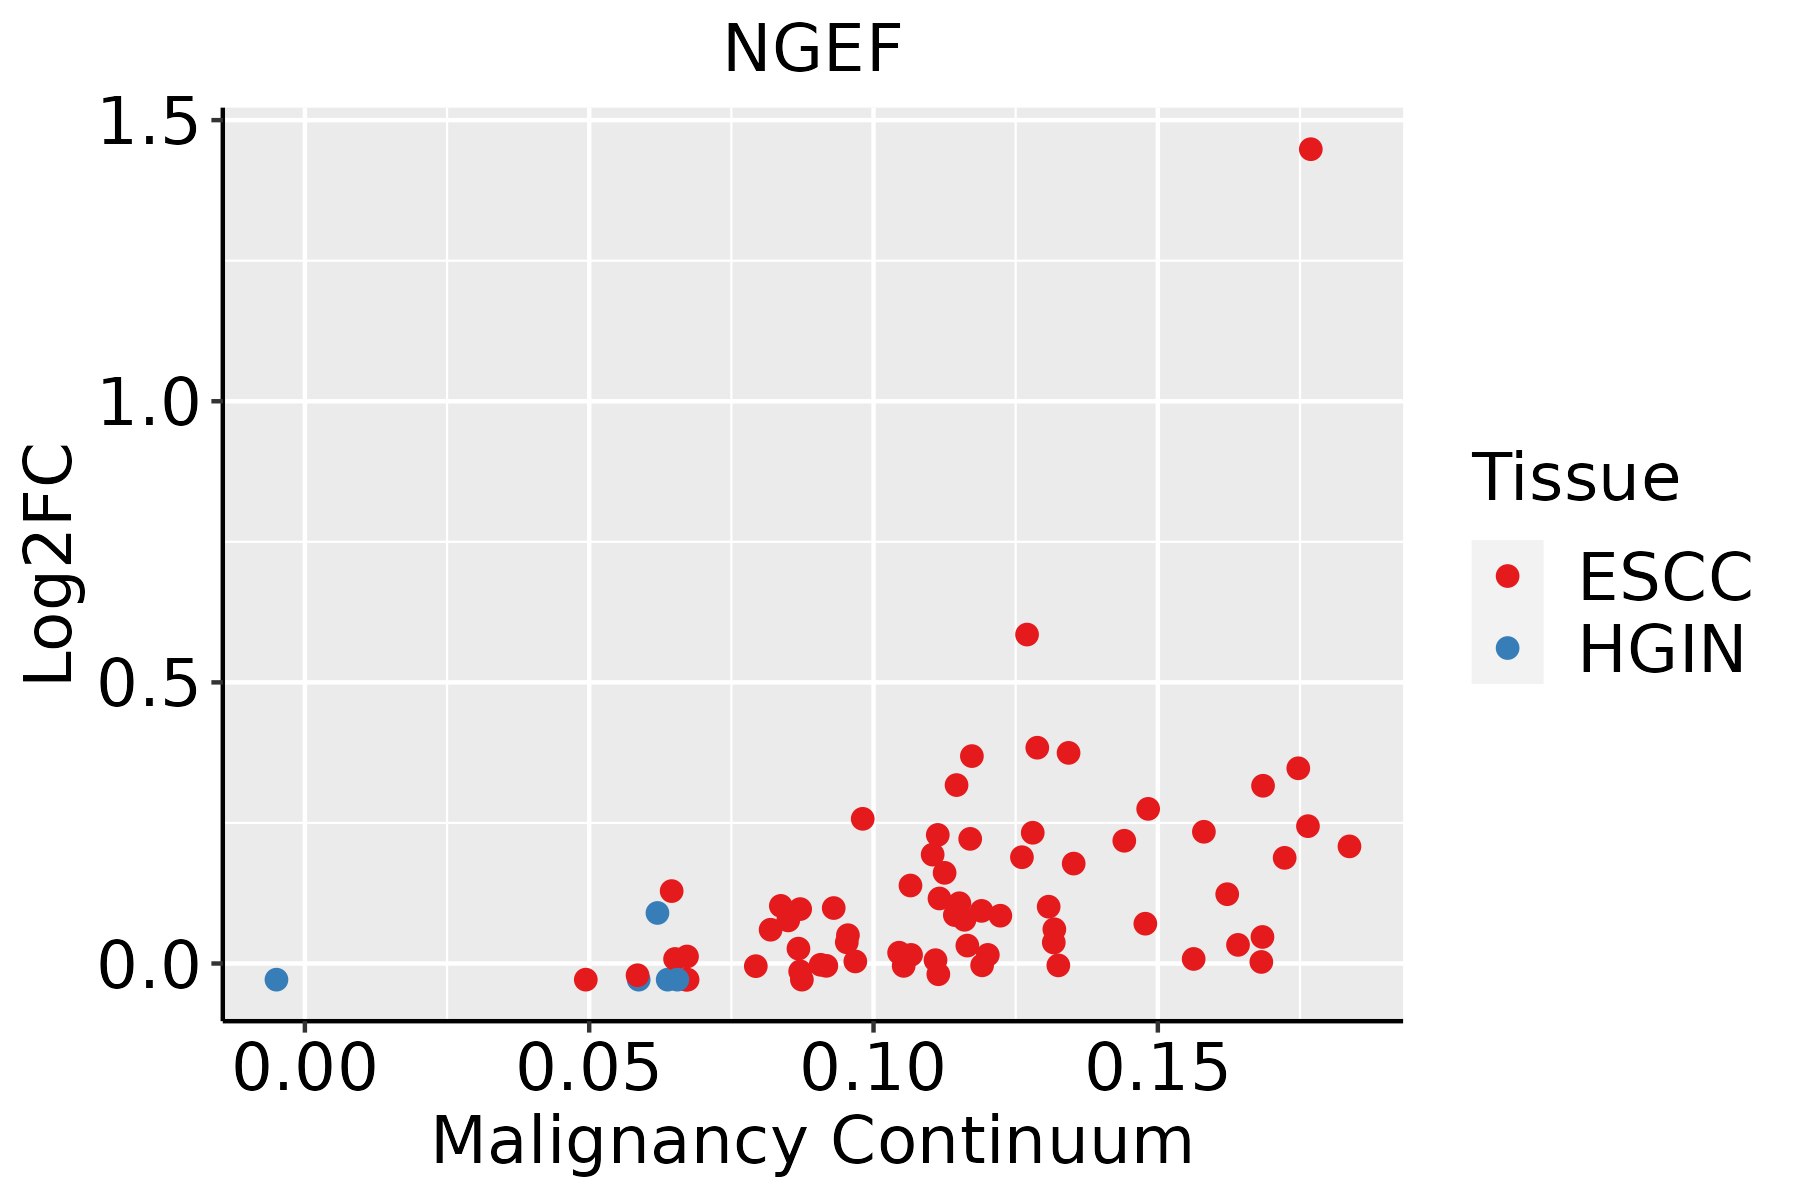 | ESCC: Esophageal squamous cell carcinoma |
| HGIN: High-grade intraepithelial neoplasias | ||
| LGIN: Low-grade intraepithelial neoplasias | ||
| Oral Cavity |  | EOLP: Erosive Oral lichen planus |
| LP: leukoplakia | ||
| NEOLP: Non-erosive oral lichen planus | ||
| OSCC: Oral squamous cell carcinoma |
| ∗log2FC in expression of this searched gene in stem-like cells from each diseased tissue sample relative to stem-like cells in normal samples in each tissue plotted against the malignancy continuum. Samples are colored based on if they are from different disease stage. |
Top |
Malignant transformation related pathway analysis |
| Find out the enriched GO biological processes and KEGG pathways involved in transition from healthy to precancer to cancer |
| Tissue | Disease Stage | Enriched GO biological Processes |
| Colorectum | AD |  |
| Colorectum | SER |  |
| Colorectum | MSS |  |
| Colorectum | MSI-H |  |
| Colorectum | FAP |  |
| ∗Top 15 enriched GO BP terms are showed in the bar plot of each disease state in each tissue. Each row represents a significant GO biological process which is colored according to the -log10(p.adjust). |
| Page: 1 2 3 4 5 6 7 8 9 |
| GO ID | Tissue | Disease Stage | Description | Gene Ratio | Bg Ratio | pvalue | p.adjust | Count |
| GO:001097516 | Esophagus | ESCC | regulation of neuron projection development | 240/8552 | 445/18723 | 2.48e-04 | 1.53e-03 | 240 |
| GO:00480133 | Esophagus | ESCC | ephrin receptor signaling pathway | 33/8552 | 51/18723 | 4.77e-03 | 1.85e-02 | 33 |
| GO:004308715 | Esophagus | ESCC | regulation of GTPase activity | 183/8552 | 348/18723 | 5.34e-03 | 2.00e-02 | 183 |
| GO:001635816 | Esophagus | ESCC | dendrite development | 130/8552 | 243/18723 | 8.33e-03 | 2.95e-02 | 130 |
| GO:005105610 | Esophagus | ESCC | regulation of small GTPase mediated signal transduction | 157/8552 | 302/18723 | 1.55e-02 | 4.98e-02 | 157 |
| GO:001097510 | Oral cavity | OSCC | regulation of neuron projection development | 210/7305 | 445/18723 | 2.35e-04 | 1.52e-03 | 210 |
| GO:004308710 | Oral cavity | OSCC | regulation of GTPase activity | 165/7305 | 348/18723 | 7.94e-04 | 4.27e-03 | 165 |
| GO:00480132 | Oral cavity | OSCC | ephrin receptor signaling pathway | 29/7305 | 51/18723 | 7.33e-03 | 2.71e-02 | 29 |
| GO:00313458 | Oral cavity | OSCC | negative regulation of cell projection organization | 89/7305 | 186/18723 | 8.51e-03 | 3.09e-02 | 89 |
| GO:001635810 | Oral cavity | OSCC | dendrite development | 113/7305 | 243/18723 | 1.00e-02 | 3.49e-02 | 113 |
| GO:00609967 | Oral cavity | OSCC | dendritic spine development | 50/7305 | 99/18723 | 1.31e-02 | 4.34e-02 | 50 |
| GO:003134513 | Oral cavity | LP | negative regulation of cell projection organization | 61/4623 | 186/18723 | 7.59e-03 | 4.18e-02 | 61 |
| Page: 1 |
| Pathway ID | Tissue | Disease Stage | Description | Gene Ratio | Bg Ratio | pvalue | p.adjust | qvalue | Count |
| hsa0436016 | Esophagus | ESCC | Axon guidance | 108/4205 | 182/8465 | 5.13e-03 | 1.30e-02 | 6.67e-03 | 108 |
| hsa0436017 | Esophagus | ESCC | Axon guidance | 108/4205 | 182/8465 | 5.13e-03 | 1.30e-02 | 6.67e-03 | 108 |
| hsa0436014 | Oral cavity | OSCC | Axon guidance | 97/3704 | 182/8465 | 5.59e-03 | 1.33e-02 | 6.76e-03 | 97 |
| hsa0436015 | Oral cavity | OSCC | Axon guidance | 97/3704 | 182/8465 | 5.59e-03 | 1.33e-02 | 6.76e-03 | 97 |
| Page: 1 |
Top |
Cell-cell communication analysis |
| Identification of potential cell-cell interactions between two cell types and their ligand-receptor pairs for different disease states |
| Ligand | Receptor | LRpair | Pathway | Tissue | Disease Stage |
| Page: 1 |
Top |
Single-cell gene regulatory network inference analysis |
| Find out the significant the regulons (TFs) and the target genes of each regulon across cell types for different disease states |
| TF | Cell Type | Tissue | Disease Stage | Target Gene | RSS | Regulon Activity |
| ∗The dot plots of a searched regulon are shown for all cell subpopulations in each disease state of each tissue based on the regulon specific score inferred using pySCENIC and by calculating the average expression. |
| Page: 1 |
Top |
Somatic mutation of malignant transformation related genes |
| Annotation of somatic variants for genes involved in malignant transformation |
| Hugo Symbol | Variant Class | Variant Classification | dbSNP RS | HGVSc | HGVSp | HGVSp Short | SWISSPROT | BIOTYPE | SIFT | PolyPhen | Tumor Sample Barcode | Tissue | Histology | Sex | Age | Stage | Therapy Types | Drugs | Outcome |
| NGEF | SNV | Missense_Mutation | c.970N>A | p.Val324Met | p.V324M | Q8N5V2 | protein_coding | deleterious(0) | probably_damaging(0.995) | TCGA-BH-A0H3-01 | Breast | breast invasive carcinoma | Female | <65 | I/II | Unknown | Unknown | SD | |
| NGEF | SNV | Missense_Mutation | c.1013N>A | p.Arg338Gln | p.R338Q | Q8N5V2 | protein_coding | deleterious(0) | probably_damaging(0.957) | TCGA-D8-A1JF-01 | Breast | breast invasive carcinoma | Female | >=65 | III/IV | Unknown | Unknown | SD | |
| NGEF | SNV | Missense_Mutation | c.1367N>C | p.Glu456Ala | p.E456A | Q8N5V2 | protein_coding | tolerated(0.22) | possibly_damaging(0.887) | TCGA-D8-A1XK-01 | Breast | breast invasive carcinoma | Female | <65 | I/II | Chemotherapy | doxorubicine+cyclophosphamide | SD | |
| NGEF | SNV | Missense_Mutation | c.525N>G | p.Ile175Met | p.I175M | Q8N5V2 | protein_coding | deleterious(0.02) | probably_damaging(0.942) | TCGA-D8-A1XK-01 | Breast | breast invasive carcinoma | Female | <65 | I/II | Chemotherapy | doxorubicine+cyclophosphamide | SD | |
| NGEF | SNV | Missense_Mutation | c.2102N>T | p.Arg701Leu | p.R701L | Q8N5V2 | protein_coding | deleterious_low_confidence(0) | probably_damaging(0.995) | TCGA-EW-A1IZ-01 | Breast | breast invasive carcinoma | Female | <65 | III/IV | Chemotherapy | taxotere | SD | |
| NGEF | SNV | Missense_Mutation | c.977N>A | p.Ala326Asp | p.A326D | Q8N5V2 | protein_coding | tolerated(0.98) | possibly_damaging(0.871) | TCGA-EW-A1OZ-01 | Breast | breast invasive carcinoma | Female | <65 | I/II | Targeted Molecular therapy | trastuzumab | SD | |
| NGEF | SNV | Missense_Mutation | novel | c.2037N>C | p.Gln679His | p.Q679H | Q8N5V2 | protein_coding | deleterious(0) | probably_damaging(0.996) | TCGA-EA-A3Y4-01 | Cervix | cervical & endocervical cancer | Female | <65 | I/II | Unknown | Unknown | SD |
| NGEF | SNV | Missense_Mutation | rs767420117 | c.808G>A | p.Glu270Lys | p.E270K | Q8N5V2 | protein_coding | tolerated(0.11) | benign(0.006) | TCGA-EA-A43B-01 | Cervix | cervical & endocervical cancer | Female | <65 | I/II | Chemotherapy | cisplatin | CR |
| NGEF | SNV | Missense_Mutation | c.2102N>A | p.Arg701His | p.R701H | Q8N5V2 | protein_coding | deleterious_low_confidence(0) | probably_damaging(0.996) | TCGA-A6-6653-01 | Colorectum | colon adenocarcinoma | Male | >=65 | I/II | Unknown | Unknown | SD | |
| NGEF | SNV | Missense_Mutation | c.798C>G | p.Ile266Met | p.I266M | Q8N5V2 | protein_coding | tolerated(0.14) | benign(0.415) | TCGA-AA-3680-01 | Colorectum | colon adenocarcinoma | Female | >=65 | III/IV | Chemotherapy | folinic | PD |
| Page: 1 2 3 4 5 6 7 8 9 |
Top |
Related drugs of malignant transformation related genes |
| Identification of chemicals and drugs interact with genes involved in malignant transfromation |
| (DGIdb 4.0) |
| Entrez ID | Symbol | Category | Interaction Types | Drug Claim Name | Drug Name | PMIDs |
| Page: 1 |

Copyright 2023-Present -The University of Texas Health Science Center at Houston |