
|
|||||
|
 | |
| |
| |
| |
| |
| |
|
Gene: NGDN |
Gene summary for NGDN |
| Gene information | Species | Human | Gene symbol | NGDN | Gene ID | 25983 |
| Gene name | neuroguidin | |
| Gene Alias | C14orf120 | |
| Cytomap | 14q11.2 | |
| Gene Type | protein-coding | GO ID | GO:0000462 | UniProtAcc | Q8NEJ9 |
Top |
Malignant transformation analysis |
| Identification of the aberrant gene expression in precancerous and cancerous lesions by comparing the gene expression of stem-like cells in diseased tissues with normal stem cells |
| Entrez ID | Symbol | Replicates | Species | Organ | Tissue | Adj P-value | Log2FC | Malignancy |
| 25983 | NGDN | LZE4T | Human | Esophagus | ESCC | 2.32e-22 | 6.88e-01 | 0.0811 |
| 25983 | NGDN | LZE5T | Human | Esophagus | ESCC | 4.70e-05 | 3.73e-01 | 0.0514 |
| 25983 | NGDN | LZE7T | Human | Esophagus | ESCC | 1.30e-08 | 3.84e-01 | 0.0667 |
| 25983 | NGDN | LZE8T | Human | Esophagus | ESCC | 2.21e-11 | 1.89e-01 | 0.067 |
| 25983 | NGDN | LZE20T | Human | Esophagus | ESCC | 1.20e-04 | -4.87e-02 | 0.0662 |
| 25983 | NGDN | LZE22D1 | Human | Esophagus | HGIN | 3.05e-02 | 2.07e-02 | 0.0595 |
| 25983 | NGDN | LZE24T | Human | Esophagus | ESCC | 1.79e-21 | 5.44e-01 | 0.0596 |
| 25983 | NGDN | LZE21T | Human | Esophagus | ESCC | 5.61e-06 | 4.57e-01 | 0.0655 |
| 25983 | NGDN | LZE6T | Human | Esophagus | ESCC | 2.18e-07 | 2.94e-01 | 0.0845 |
| 25983 | NGDN | P1T-E | Human | Esophagus | ESCC | 3.20e-07 | 4.48e-01 | 0.0875 |
| 25983 | NGDN | P2T-E | Human | Esophagus | ESCC | 6.13e-33 | 5.17e-01 | 0.1177 |
| 25983 | NGDN | P4T-E | Human | Esophagus | ESCC | 3.71e-38 | 8.24e-01 | 0.1323 |
| 25983 | NGDN | P5T-E | Human | Esophagus | ESCC | 2.75e-34 | 6.95e-01 | 0.1327 |
| 25983 | NGDN | P8T-E | Human | Esophagus | ESCC | 2.36e-35 | 6.53e-01 | 0.0889 |
| 25983 | NGDN | P9T-E | Human | Esophagus | ESCC | 1.47e-20 | 3.77e-01 | 0.1131 |
| 25983 | NGDN | P10T-E | Human | Esophagus | ESCC | 6.97e-45 | 6.12e-01 | 0.116 |
| 25983 | NGDN | P11T-E | Human | Esophagus | ESCC | 1.60e-14 | 7.65e-01 | 0.1426 |
| 25983 | NGDN | P12T-E | Human | Esophagus | ESCC | 2.08e-74 | 1.50e+00 | 0.1122 |
| 25983 | NGDN | P15T-E | Human | Esophagus | ESCC | 9.46e-72 | 1.40e+00 | 0.1149 |
| 25983 | NGDN | P16T-E | Human | Esophagus | ESCC | 3.65e-39 | 7.43e-01 | 0.1153 |
| Page: 1 2 3 4 5 6 |
| Tissue | Expression Dynamics | Abbreviation |
| Esophagus | 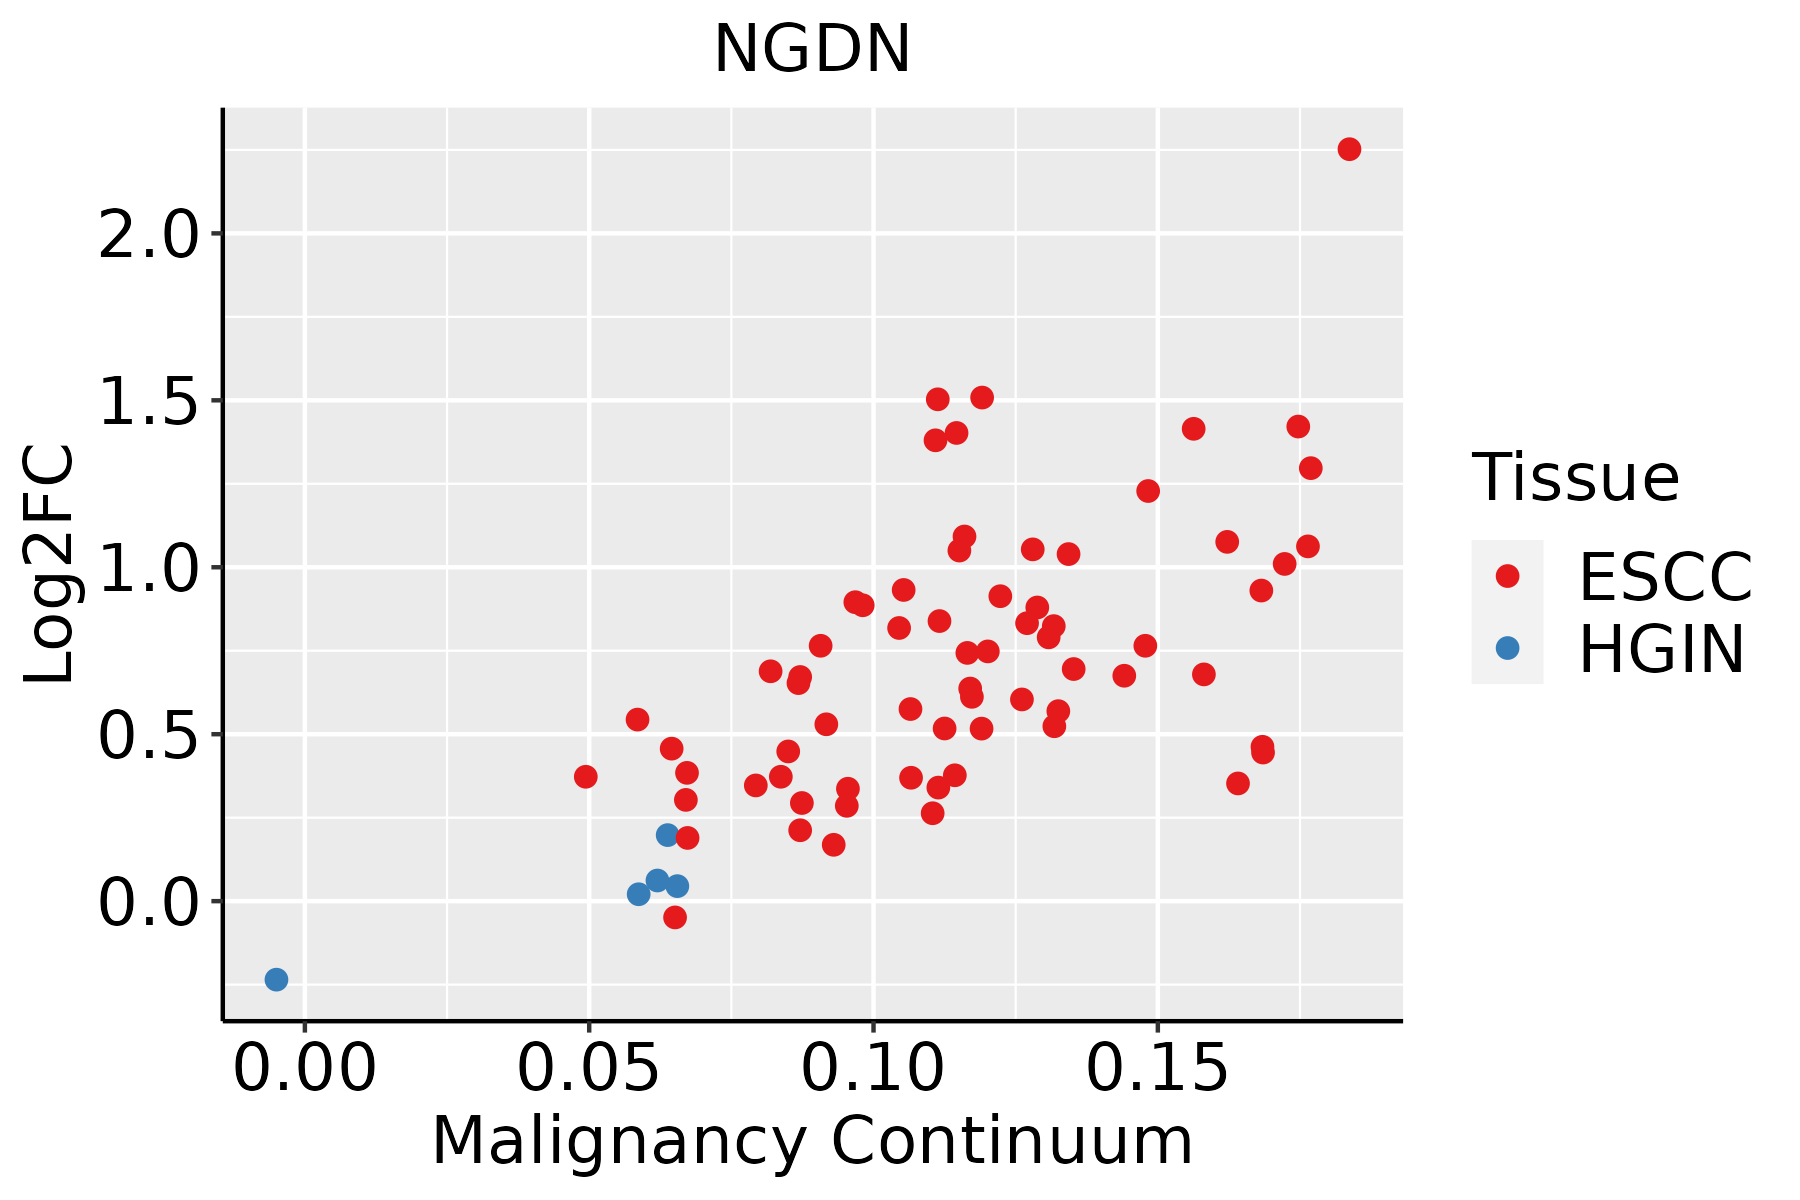 | ESCC: Esophageal squamous cell carcinoma |
| HGIN: High-grade intraepithelial neoplasias | ||
| LGIN: Low-grade intraepithelial neoplasias | ||
| Liver |  | HCC: Hepatocellular carcinoma |
| NAFLD: Non-alcoholic fatty liver disease | ||
| Oral Cavity | 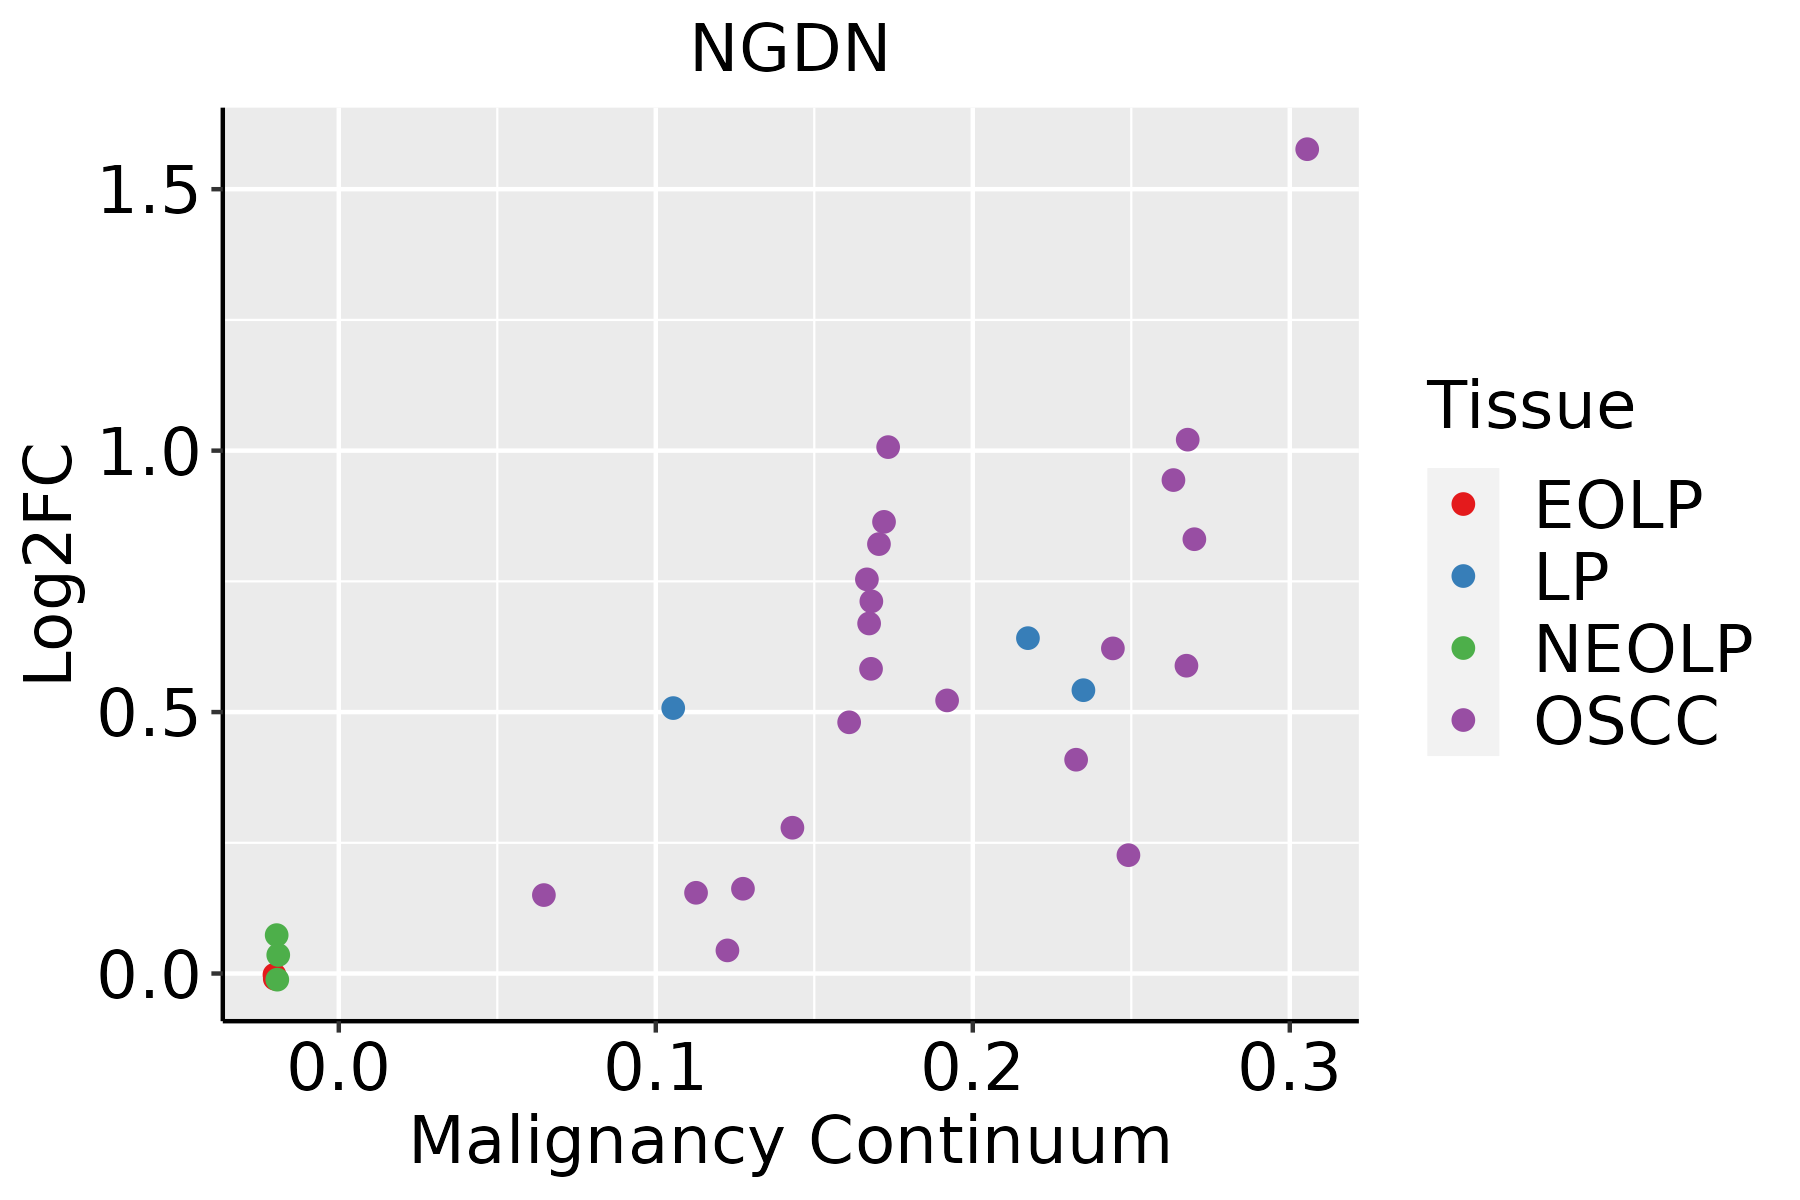 | EOLP: Erosive Oral lichen planus |
| LP: leukoplakia | ||
| NEOLP: Non-erosive oral lichen planus | ||
| OSCC: Oral squamous cell carcinoma | ||
| Skin | 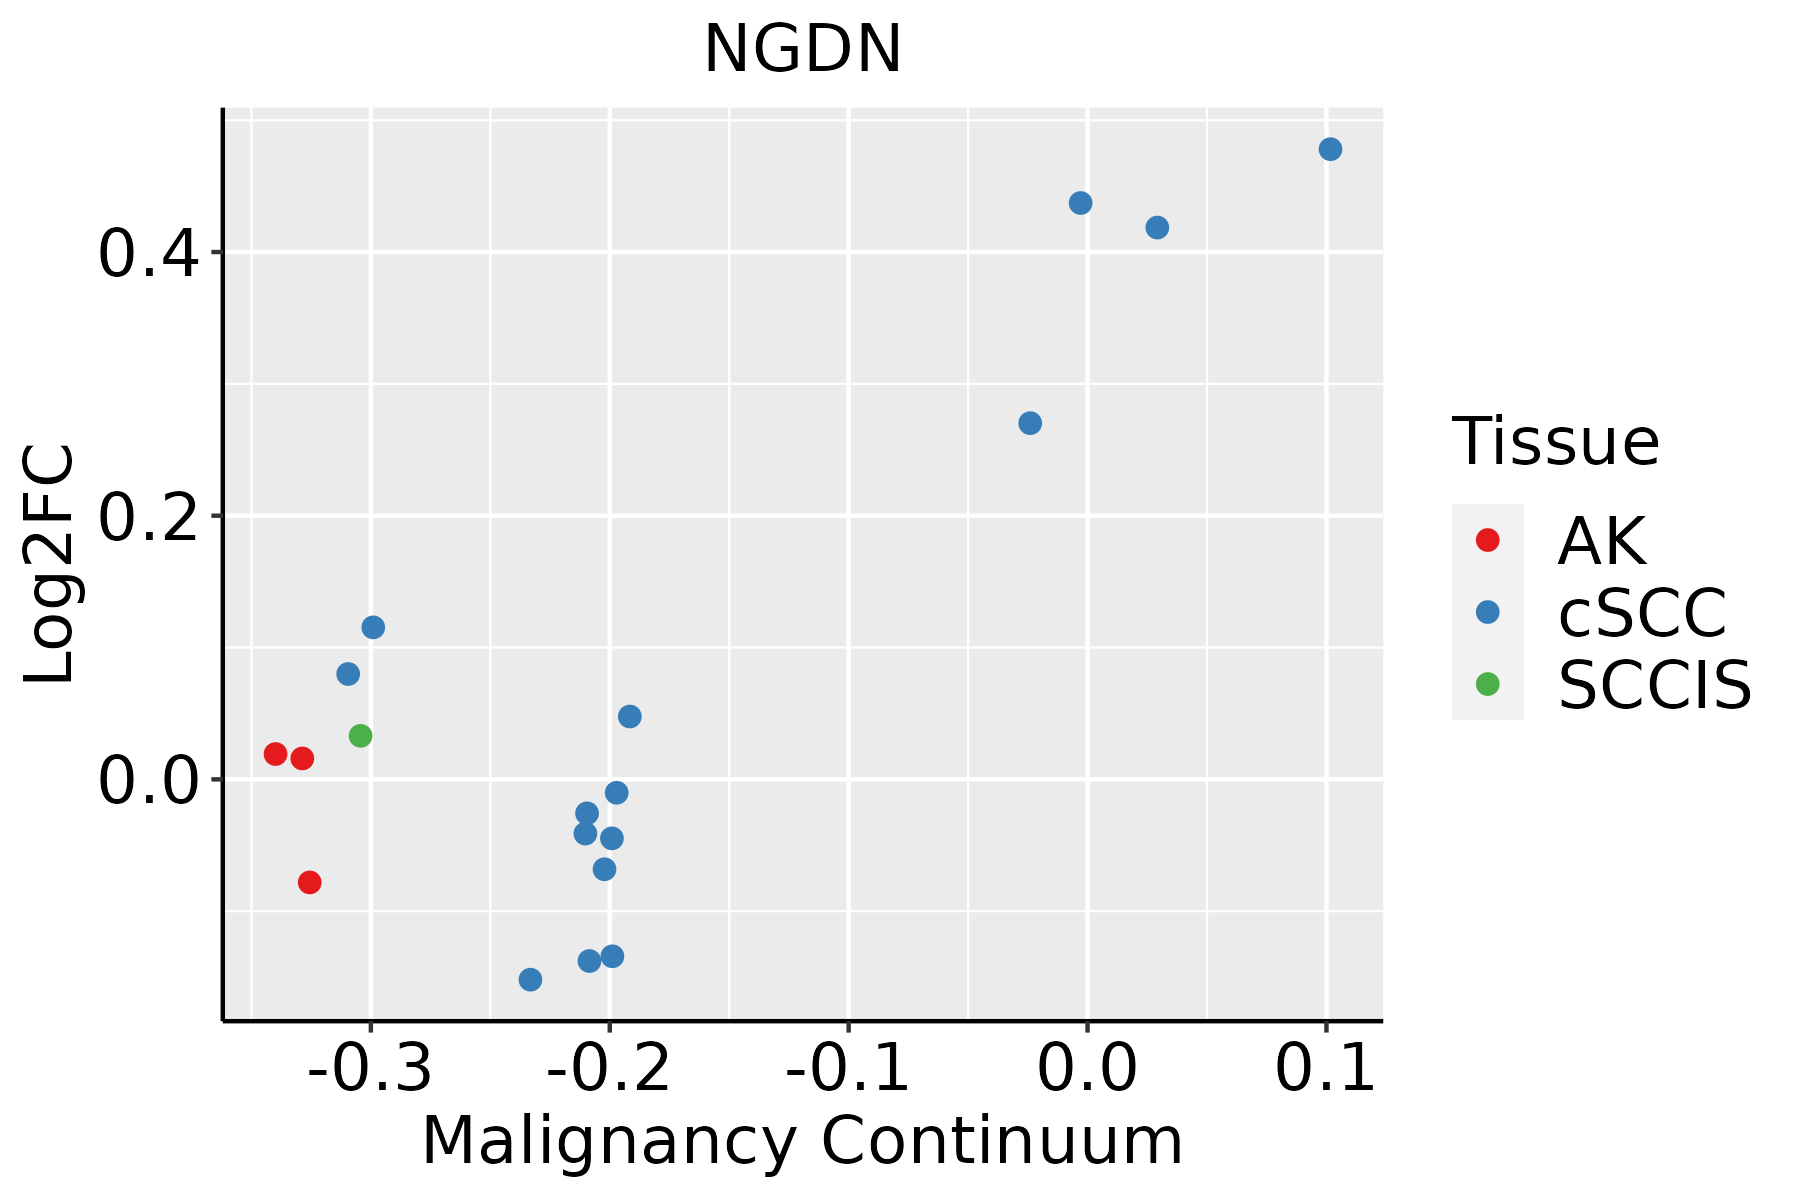 | AK: Actinic keratosis |
| cSCC: Cutaneous squamous cell carcinoma | ||
| SCCIS:squamous cell carcinoma in situ |
| ∗log2FC in expression of this searched gene in stem-like cells from each diseased tissue sample relative to stem-like cells in normal samples in each tissue plotted against the malignancy continuum. Samples are colored based on if they are from different disease stage. |
Top |
Malignant transformation related pathway analysis |
| Find out the enriched GO biological processes and KEGG pathways involved in transition from healthy to precancer to cancer |
| Tissue | Disease Stage | Enriched GO biological Processes |
| Colorectum | AD |  |
| Colorectum | SER |  |
| Colorectum | MSS |  |
| Colorectum | MSI-H |  |
| Colorectum | FAP |  |
| ∗Top 15 enriched GO BP terms are showed in the bar plot of each disease state in each tissue. Each row represents a significant GO biological process which is colored according to the -log10(p.adjust). |
| Page: 1 2 3 4 5 6 7 8 9 |
| GO ID | Tissue | Disease Stage | Description | Gene Ratio | Bg Ratio | pvalue | p.adjust | Count |
| GO:002261327 | Esophagus | HGIN | ribonucleoprotein complex biogenesis | 158/2587 | 463/18723 | 2.61e-29 | 5.23e-26 | 158 |
| GO:000641727 | Esophagus | HGIN | regulation of translation | 139/2587 | 468/18723 | 1.46e-19 | 7.98e-17 | 139 |
| GO:004225426 | Esophagus | HGIN | ribosome biogenesis | 101/2587 | 299/18723 | 8.74e-19 | 4.03e-16 | 101 |
| GO:001607219 | Esophagus | HGIN | rRNA metabolic process | 72/2587 | 236/18723 | 2.26e-11 | 2.56e-09 | 72 |
| GO:000636419 | Esophagus | HGIN | rRNA processing | 69/2587 | 225/18723 | 4.53e-11 | 5.04e-09 | 69 |
| GO:003447010 | Esophagus | HGIN | ncRNA processing | 97/2587 | 395/18723 | 5.92e-09 | 3.90e-07 | 97 |
| GO:004227427 | Esophagus | HGIN | ribosomal small subunit biogenesis | 27/2587 | 73/18723 | 6.26e-07 | 2.72e-05 | 27 |
| GO:00346606 | Esophagus | HGIN | ncRNA metabolic process | 104/2587 | 485/18723 | 2.26e-06 | 8.23e-05 | 104 |
| GO:0022613111 | Esophagus | ESCC | ribonucleoprotein complex biogenesis | 365/8552 | 463/18723 | 1.74e-49 | 1.11e-45 | 365 |
| GO:0042254111 | Esophagus | ESCC | ribosome biogenesis | 252/8552 | 299/18723 | 3.27e-44 | 1.04e-40 | 252 |
| GO:003447015 | Esophagus | ESCC | ncRNA processing | 300/8552 | 395/18723 | 3.09e-35 | 3.26e-32 | 300 |
| GO:0016072110 | Esophagus | ESCC | rRNA metabolic process | 197/8552 | 236/18723 | 1.31e-33 | 1.18e-30 | 197 |
| GO:0006364110 | Esophagus | ESCC | rRNA processing | 189/8552 | 225/18723 | 4.88e-33 | 3.87e-30 | 189 |
| GO:003466012 | Esophagus | ESCC | ncRNA metabolic process | 346/8552 | 485/18723 | 4.35e-31 | 2.51e-28 | 346 |
| GO:0006417111 | Esophagus | ESCC | regulation of translation | 304/8552 | 468/18723 | 1.53e-17 | 1.33e-15 | 304 |
| GO:0042274111 | Esophagus | ESCC | ribosomal small subunit biogenesis | 67/8552 | 73/18723 | 6.62e-17 | 5.38e-15 | 67 |
| GO:00304904 | Esophagus | ESCC | maturation of SSU-rRNA | 45/8552 | 50/18723 | 5.07e-11 | 1.63e-09 | 45 |
| GO:00004623 | Esophagus | ESCC | maturation of SSU-rRNA from tricistronic rRNA transcript (SSU-rRNA, 5.8S rRNA, LSU-rRNA) | 32/8552 | 37/18723 | 2.96e-07 | 4.23e-06 | 32 |
| GO:002261312 | Liver | Cirrhotic | ribonucleoprotein complex biogenesis | 231/4634 | 463/18723 | 3.28e-32 | 6.86e-29 | 231 |
| GO:004225412 | Liver | Cirrhotic | ribosome biogenesis | 154/4634 | 299/18723 | 1.18e-23 | 6.72e-21 | 154 |
| Page: 1 2 3 4 |
| Pathway ID | Tissue | Disease Stage | Description | Gene Ratio | Bg Ratio | pvalue | p.adjust | qvalue | Count |
| Page: 1 |
Top |
Cell-cell communication analysis |
| Identification of potential cell-cell interactions between two cell types and their ligand-receptor pairs for different disease states |
| Ligand | Receptor | LRpair | Pathway | Tissue | Disease Stage |
| Page: 1 |
Top |
Single-cell gene regulatory network inference analysis |
| Find out the significant the regulons (TFs) and the target genes of each regulon across cell types for different disease states |
| TF | Cell Type | Tissue | Disease Stage | Target Gene | RSS | Regulon Activity |
| ∗The dot plots of a searched regulon are shown for all cell subpopulations in each disease state of each tissue based on the regulon specific score inferred using pySCENIC and by calculating the average expression. |
| Page: 1 |
Top |
Somatic mutation of malignant transformation related genes |
| Annotation of somatic variants for genes involved in malignant transformation |
| Hugo Symbol | Variant Class | Variant Classification | dbSNP RS | HGVSc | HGVSp | HGVSp Short | SWISSPROT | BIOTYPE | SIFT | PolyPhen | Tumor Sample Barcode | Tissue | Histology | Sex | Age | Stage | Therapy Types | Drugs | Outcome |
| NGDN | insertion | Frame_Shift_Ins | novel | c.39_40insACTCTGGGTGCTGCGGCAGACGGGAGCCAATACGCGCTAA | p.Ala14ThrfsTer84 | p.A14Tfs*84 | Q8NEJ9 | protein_coding | TCGA-A7-A0CJ-01 | Breast | breast invasive carcinoma | Female | <65 | I/II | Chemotherapy | cytoxan | SD | ||
| NGDN | insertion | Frame_Shift_Ins | novel | c.404_405insAATCTGTTTTTCTTTCTGTTTTGTTCAACTCAGGGTCT | p.Ser135ArgfsTer16 | p.S135Rfs*16 | Q8NEJ9 | protein_coding | TCGA-AN-A041-01 | Breast | breast invasive carcinoma | Female | <65 | I/II | Unknown | Unknown | SD | ||
| NGDN | SNV | Missense_Mutation | rs148302816 | c.299N>A | p.Arg100His | p.R100H | Q8NEJ9 | protein_coding | deleterious(0.05) | probably_damaging(0.996) | TCGA-2W-A8YY-01 | Cervix | cervical & endocervical cancer | Female | <65 | I/II | Chemotherapy | cisplatin | CR |
| NGDN | deletion | Frame_Shift_Del | novel | c.906_907delTC | p.Gln303GlufsTer30 | p.Q303Efs*30 | Q8NEJ9 | protein_coding | TCGA-EA-A5ZF-01 | Cervix | cervical & endocervical cancer | Female | <65 | I/II | Unknown | Unknown | PD | ||
| NGDN | SNV | Missense_Mutation | rs763908852 | c.661N>T | p.Arg221Cys | p.R221C | Q8NEJ9 | protein_coding | deleterious(0.03) | probably_damaging(0.965) | TCGA-AA-A01R-01 | Colorectum | colon adenocarcinoma | Male | <65 | III/IV | Chemotherapy | 5-fluorouracil | PD |
| NGDN | SNV | Missense_Mutation | rs199979035 | c.934N>T | p.Arg312Trp | p.R312W | Q8NEJ9 | protein_coding | deleterious(0) | possibly_damaging(0.719) | TCGA-AU-6004-01 | Colorectum | colon adenocarcinoma | Female | >=65 | I/II | Unknown | Unknown | SD |
| NGDN | SNV | Missense_Mutation | novel | c.765N>T | p.Glu255Asp | p.E255D | Q8NEJ9 | protein_coding | tolerated(0.35) | benign(0.031) | TCGA-AZ-4315-01 | Colorectum | colon adenocarcinoma | Male | <65 | I/II | Unknown | Unknown | SD |
| NGDN | SNV | Missense_Mutation | c.431A>T | p.Glu144Val | p.E144V | Q8NEJ9 | protein_coding | tolerated(0.16) | benign(0.243) | TCGA-EI-6507-01 | Colorectum | rectum adenocarcinoma | Male | <65 | I/II | Unknown | Unknown | SD | |
| NGDN | SNV | Missense_Mutation | rs540927380 | c.524N>A | p.Arg175His | p.R175H | Q8NEJ9 | protein_coding | tolerated(0.06) | possibly_damaging(0.899) | TCGA-AJ-A3EL-01 | Endometrium | uterine corpus endometrioid carcinoma | Female | <65 | I/II | Unknown | Unknown | SD |
| NGDN | SNV | Missense_Mutation | rs182201186 | c.386G>A | p.Arg129His | p.R129H | Q8NEJ9 | protein_coding | tolerated(0.26) | benign(0.052) | TCGA-AP-A051-01 | Endometrium | uterine corpus endometrioid carcinoma | Female | >=65 | I/II | Unknown | Unknown | SD |
| Page: 1 2 3 4 5 |
Top |
Related drugs of malignant transformation related genes |
| Identification of chemicals and drugs interact with genes involved in malignant transfromation |
| (DGIdb 4.0) |
| Entrez ID | Symbol | Category | Interaction Types | Drug Claim Name | Drug Name | PMIDs |
| Page: 1 |

Copyright 2023-Present -The University of Texas Health Science Center at Houston |