
|
|||||
|
 | |
| |
| |
| |
| |
| |
|
Gene: NGB |
Gene summary for NGB |
| Gene information | Species | Human | Gene symbol | NGB | Gene ID | 58157 |
| Gene name | neuroglobin | |
| Gene Alias | NGB | |
| Cytomap | 14q24.3 | |
| Gene Type | protein-coding | GO ID | GO:0006810 | UniProtAcc | A0M8W9 |
Top |
Malignant transformation analysis |
| Identification of the aberrant gene expression in precancerous and cancerous lesions by comparing the gene expression of stem-like cells in diseased tissues with normal stem cells |
| Entrez ID | Symbol | Replicates | Species | Organ | Tissue | Adj P-value | Log2FC | Malignancy |
| 58157 | NGB | HTA11_2487_2000001011 | Human | Colorectum | SER | 3.37e-03 | 1.53e-01 | -0.1808 |
| 58157 | NGB | HTA11_3361_2000001011 | Human | Colorectum | AD | 7.08e-25 | 6.80e-01 | -0.1207 |
| 58157 | NGB | HTA11_546_2000001011 | Human | Colorectum | AD | 4.17e-02 | 1.36e-01 | -0.0842 |
| 58157 | NGB | HTA11_6818_2000001021 | Human | Colorectum | AD | 1.15e-02 | 1.45e-01 | 0.0588 |
| 58157 | NGB | HTA11_99999970781_79442 | Human | Colorectum | MSS | 4.38e-06 | 1.56e-01 | 0.294 |
| Page: 1 |
| Tissue | Expression Dynamics | Abbreviation |
| Colorectum (GSE201348) |  | FAP: Familial adenomatous polyposis |
| CRC: Colorectal cancer | ||
| Colorectum (HTA11) | 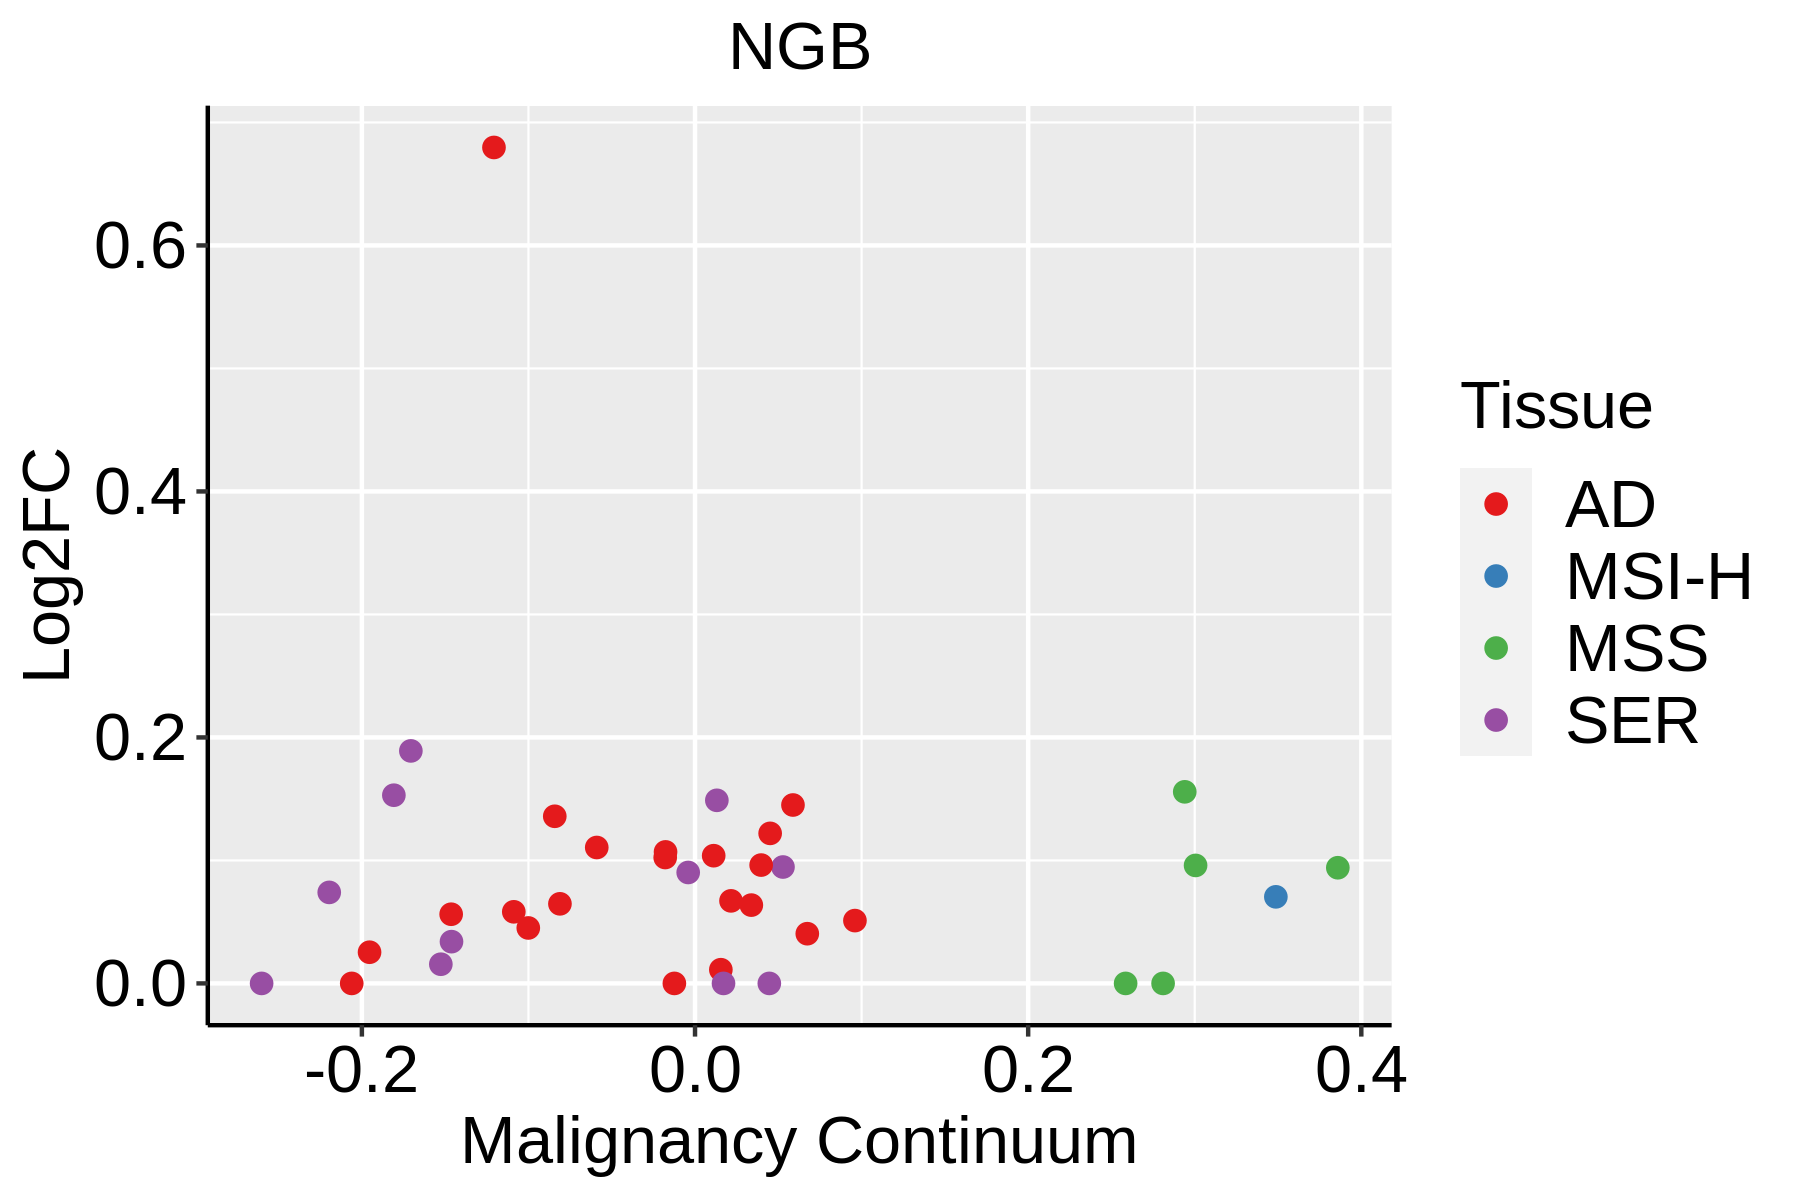 | AD: Adenomas |
| SER: Sessile serrated lesions | ||
| MSI-H: Microsatellite-high colorectal cancer | ||
| MSS: Microsatellite stable colorectal cancer |
| ∗log2FC in expression of this searched gene in stem-like cells from each diseased tissue sample relative to stem-like cells in normal samples in each tissue plotted against the malignancy continuum. Samples are colored based on if they are from different disease stage. |
Top |
Malignant transformation related pathway analysis |
| Find out the enriched GO biological processes and KEGG pathways involved in transition from healthy to precancer to cancer |
| Tissue | Disease Stage | Enriched GO biological Processes |
| Colorectum | AD |  |
| Colorectum | SER |  |
| Colorectum | MSS |  |
| Colorectum | MSI-H |  |
| Colorectum | FAP |  |
| ∗Top 15 enriched GO BP terms are showed in the bar plot of each disease state in each tissue. Each row represents a significant GO biological process which is colored according to the -log10(p.adjust). |
| Page: 1 2 3 4 5 6 7 8 9 |
| GO ID | Tissue | Disease Stage | Description | Gene Ratio | Bg Ratio | pvalue | p.adjust | Count |
| GO:000931416 | Oral cavity | OSCC | response to radiation | 241/7305 | 456/18723 | 9.76e-10 | 2.40e-08 | 241 |
| GO:00094164 | Oral cavity | OSCC | response to light stimulus | 159/7305 | 320/18723 | 5.98e-05 | 4.92e-04 | 159 |
| Page: 1 |
| Pathway ID | Tissue | Disease Stage | Description | Gene Ratio | Bg Ratio | pvalue | p.adjust | qvalue | Count |
| Page: 1 |
Top |
Cell-cell communication analysis |
| Identification of potential cell-cell interactions between two cell types and their ligand-receptor pairs for different disease states |
| Ligand | Receptor | LRpair | Pathway | Tissue | Disease Stage |
| Page: 1 |
Top |
Single-cell gene regulatory network inference analysis |
| Find out the significant the regulons (TFs) and the target genes of each regulon across cell types for different disease states |
| TF | Cell Type | Tissue | Disease Stage | Target Gene | RSS | Regulon Activity |
| ∗The dot plots of a searched regulon are shown for all cell subpopulations in each disease state of each tissue based on the regulon specific score inferred using pySCENIC and by calculating the average expression. |
| Page: 1 |
Top |
Somatic mutation of malignant transformation related genes |
| Annotation of somatic variants for genes involved in malignant transformation |
| Hugo Symbol | Variant Class | Variant Classification | dbSNP RS | HGVSc | HGVSp | HGVSp Short | SWISSPROT | BIOTYPE | SIFT | PolyPhen | Tumor Sample Barcode | Tissue | Histology | Sex | Age | Stage | Therapy Types | Drugs | Outcome |
| NGB | SNV | Missense_Mutation | c.306G>T | p.Lys102Asn | p.K102N | Q9NPG2 | protein_coding | tolerated(0.12) | benign(0.005) | TCGA-AA-3492-01 | Colorectum | colon adenocarcinoma | Female | >=65 | I/II | Unknown | Unknown | SD | |
| NGB | SNV | Missense_Mutation | novel | c.104N>G | p.Glu35Gly | p.E35G | Q9NPG2 | protein_coding | deleterious(0.01) | possibly_damaging(0.602) | TCGA-AG-3726-01 | Colorectum | rectum adenocarcinoma | Female | <65 | I/II | Unknown | Unknown | SD |
| NGB | SNV | Missense_Mutation | novel | c.125T>C | p.Phe42Ser | p.F42S | Q9NPG2 | protein_coding | deleterious(0.04) | possibly_damaging(0.81) | TCGA-AG-3883-01 | Colorectum | rectum adenocarcinoma | Male | >=65 | I/II | Unknown | Unknown | SD |
| NGB | SNV | Missense_Mutation | c.261G>T | p.Glu87Asp | p.E87D | Q9NPG2 | protein_coding | tolerated(0.27) | benign(0) | TCGA-AG-A00Y-01 | Colorectum | rectum adenocarcinoma | Male | >=65 | I/II | Unknown | Unknown | PD | |
| NGB | SNV | Missense_Mutation | novel | c.202G>A | p.Val68Met | p.V68M | Q9NPG2 | protein_coding | deleterious(0) | probably_damaging(0.987) | TCGA-CI-6623-01 | Colorectum | rectum adenocarcinoma | Male | <65 | I/II | Unknown | Unknown | SD |
| NGB | SNV | Missense_Mutation | c.335N>T | p.Ser112Phe | p.S112F | Q9NPG2 | protein_coding | deleterious(0) | probably_damaging(0.996) | TCGA-BG-A0VX-01 | Endometrium | uterine corpus endometrioid carcinoma | Female | <65 | I/II | Unknown | Unknown | SD | |
| NGB | SNV | Missense_Mutation | c.70N>T | p.Gly24Cys | p.G24C | Q9NPG2 | protein_coding | deleterious(0) | probably_damaging(0.95) | TCGA-64-5779-01 | Lung | lung adenocarcinoma | Male | <65 | III/IV | Chemotherapy | cisplatin | PD | |
| NGB | SNV | Missense_Mutation | novel | c.253N>A | p.Leu85Met | p.L85M | Q9NPG2 | protein_coding | deleterious(0.01) | possibly_damaging(0.848) | TCGA-86-6851-01 | Lung | lung adenocarcinoma | Female | >=65 | I/II | Unknown | Unknown | SD |
| NGB | SNV | Missense_Mutation | c.392C>A | p.Ala131Asp | p.A131D | Q9NPG2 | protein_coding | tolerated(0.36) | benign(0.001) | TCGA-33-4566-01 | Lung | lung squamous cell carcinoma | Male | <65 | I/II | Unknown | Unknown | SD | |
| NGB | SNV | Missense_Mutation | novel | c.219N>A | p.Asp73Glu | p.D73E | Q9NPG2 | protein_coding | tolerated(0.13) | possibly_damaging(0.758) | TCGA-96-7544-01 | Lung | lung squamous cell carcinoma | Male | >=65 | I/II | Unknown | Unknown | SD |
| Page: 1 2 |
Top |
Related drugs of malignant transformation related genes |
| Identification of chemicals and drugs interact with genes involved in malignant transfromation |
| (DGIdb 4.0) |
| Entrez ID | Symbol | Category | Interaction Types | Drug Claim Name | Drug Name | PMIDs |
| 58157 | NGB | NA | SODIUM SALICYLATE | 16094504 |
| Page: 1 |

Copyright 2023-Present -The University of Texas Health Science Center at Houston |