
|
|||||
|
 | |
| |
| |
| |
| |
| |
|
Gene: NFYC |
Gene summary for NFYC |
| Gene information | Species | Human | Gene symbol | NFYC | Gene ID | 4802 |
| Gene name | nuclear transcription factor Y subunit gamma | |
| Gene Alias | CBF-C | |
| Cytomap | 1p34.2 | |
| Gene Type | protein-coding | GO ID | GO:0006139 | UniProtAcc | Q13952 |
Top |
Malignant transformation analysis |
| Identification of the aberrant gene expression in precancerous and cancerous lesions by comparing the gene expression of stem-like cells in diseased tissues with normal stem cells |
| Entrez ID | Symbol | Replicates | Species | Organ | Tissue | Adj P-value | Log2FC | Malignancy |
| 4802 | NFYC | HTA11_3410_2000001011 | Human | Colorectum | AD | 2.74e-04 | -3.27e-01 | 0.0155 |
| 4802 | NFYC | HTA11_866_3004761011 | Human | Colorectum | AD | 9.64e-04 | -2.47e-01 | 0.096 |
| 4802 | NFYC | HTA11_99999973899_84307 | Human | Colorectum | MSS | 4.62e-02 | -4.17e-01 | 0.2585 |
| 4802 | NFYC | HTA11_99999974143_84620 | Human | Colorectum | MSS | 1.20e-05 | -3.78e-01 | 0.3005 |
| 4802 | NFYC | A001-C-207 | Human | Colorectum | FAP | 1.40e-04 | -2.87e-01 | 0.1278 |
| 4802 | NFYC | A015-C-203 | Human | Colorectum | FAP | 5.40e-20 | -3.38e-01 | -0.1294 |
| 4802 | NFYC | A015-C-204 | Human | Colorectum | FAP | 5.03e-06 | -2.95e-01 | -0.0228 |
| 4802 | NFYC | A014-C-040 | Human | Colorectum | FAP | 2.47e-03 | -3.95e-01 | -0.1184 |
| 4802 | NFYC | A002-C-201 | Human | Colorectum | FAP | 2.08e-13 | -3.95e-01 | 0.0324 |
| 4802 | NFYC | A002-C-203 | Human | Colorectum | FAP | 3.49e-04 | -1.84e-01 | 0.2786 |
| 4802 | NFYC | A001-C-119 | Human | Colorectum | FAP | 1.84e-06 | -3.69e-01 | -0.1557 |
| 4802 | NFYC | A001-C-108 | Human | Colorectum | FAP | 3.44e-15 | -3.73e-01 | -0.0272 |
| 4802 | NFYC | A002-C-205 | Human | Colorectum | FAP | 1.06e-19 | -4.87e-01 | -0.1236 |
| 4802 | NFYC | A001-C-104 | Human | Colorectum | FAP | 7.37e-05 | -3.09e-01 | 0.0184 |
| 4802 | NFYC | A015-C-005 | Human | Colorectum | FAP | 1.27e-04 | -2.86e-01 | -0.0336 |
| 4802 | NFYC | A015-C-006 | Human | Colorectum | FAP | 2.36e-14 | -4.80e-01 | -0.0994 |
| 4802 | NFYC | A015-C-106 | Human | Colorectum | FAP | 4.92e-09 | -2.95e-01 | -0.0511 |
| 4802 | NFYC | A002-C-114 | Human | Colorectum | FAP | 9.10e-14 | -3.17e-01 | -0.1561 |
| 4802 | NFYC | A015-C-104 | Human | Colorectum | FAP | 1.78e-22 | -3.82e-01 | -0.1899 |
| 4802 | NFYC | A001-C-014 | Human | Colorectum | FAP | 6.03e-11 | -3.56e-01 | 0.0135 |
| Page: 1 2 3 4 5 6 7 |
| Tissue | Expression Dynamics | Abbreviation |
| Colorectum (GSE201348) | 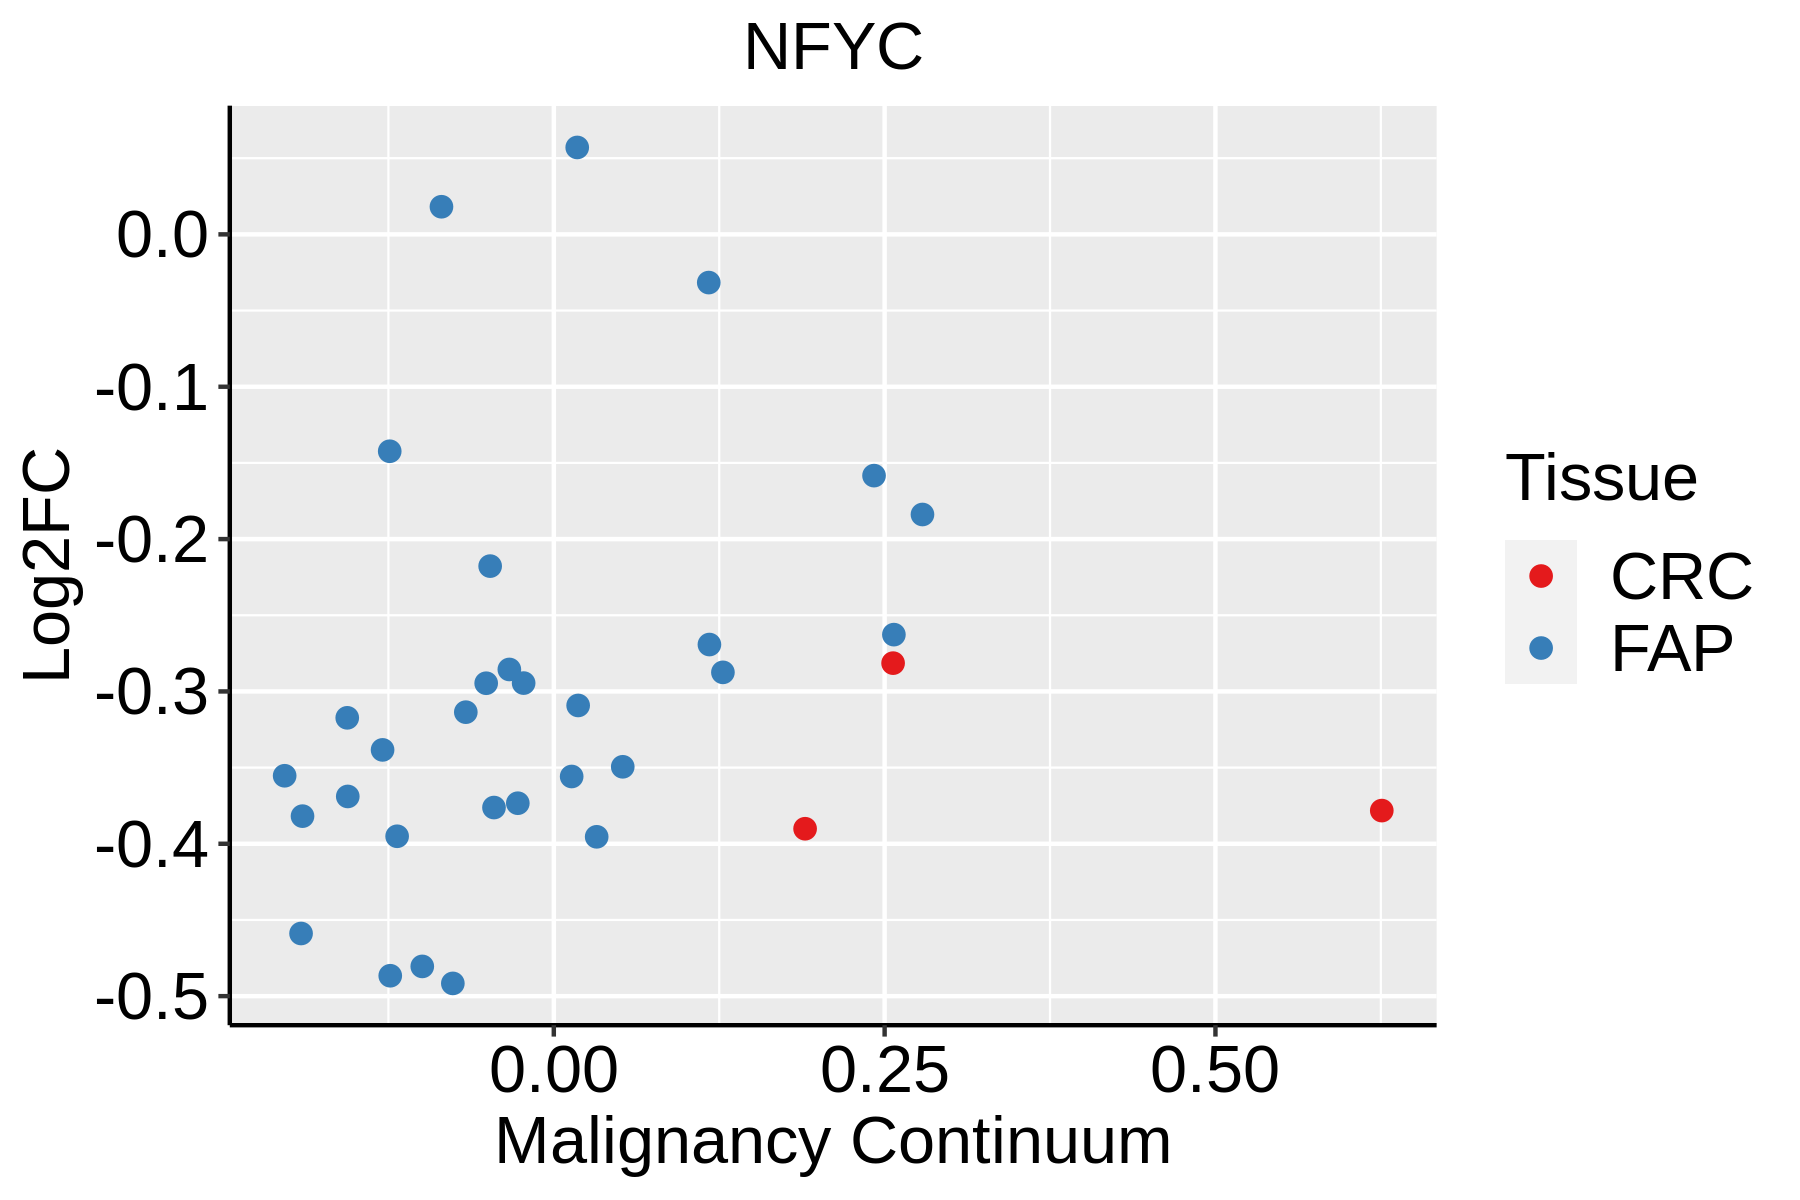 | FAP: Familial adenomatous polyposis |
| CRC: Colorectal cancer | ||
| Colorectum (HTA11) |  | AD: Adenomas |
| SER: Sessile serrated lesions | ||
| MSI-H: Microsatellite-high colorectal cancer | ||
| MSS: Microsatellite stable colorectal cancer | ||
| Esophagus | 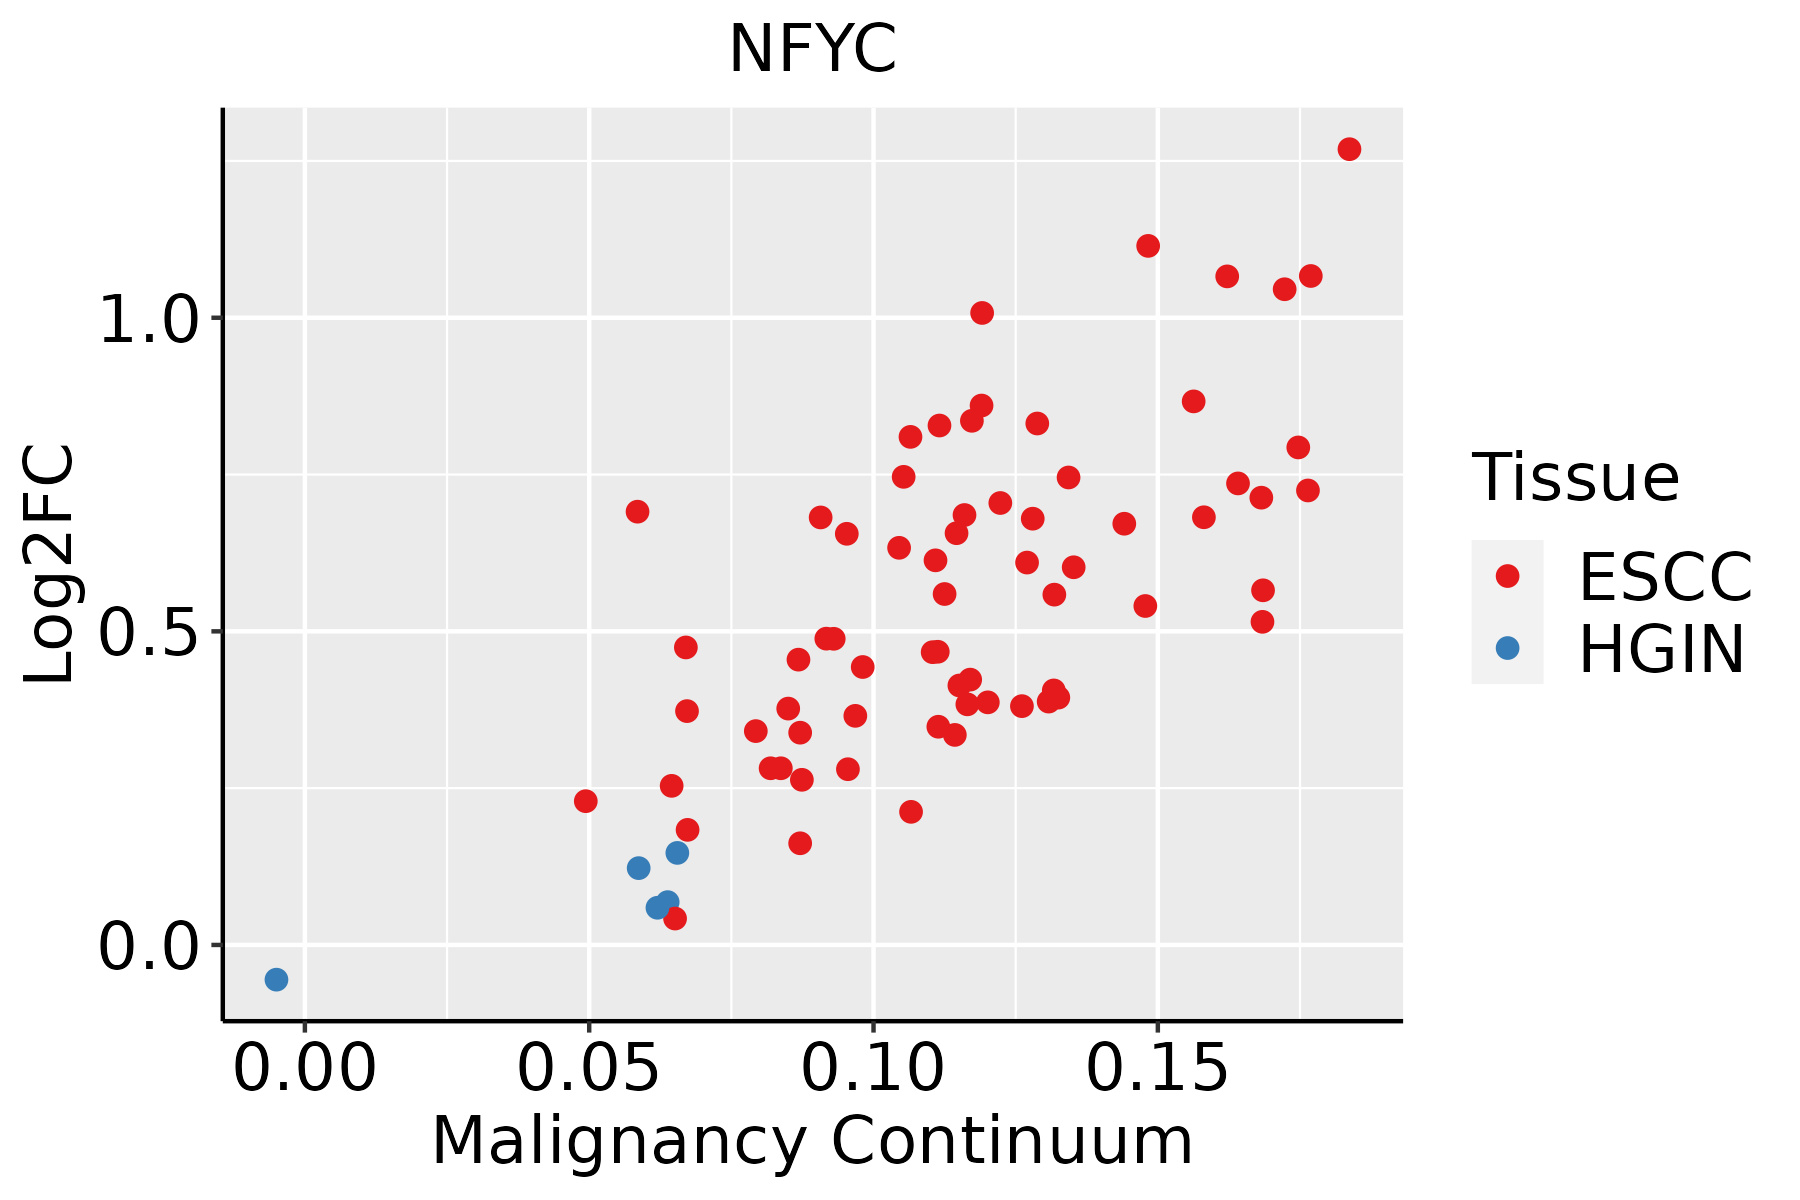 | ESCC: Esophageal squamous cell carcinoma |
| HGIN: High-grade intraepithelial neoplasias | ||
| LGIN: Low-grade intraepithelial neoplasias | ||
| Liver | 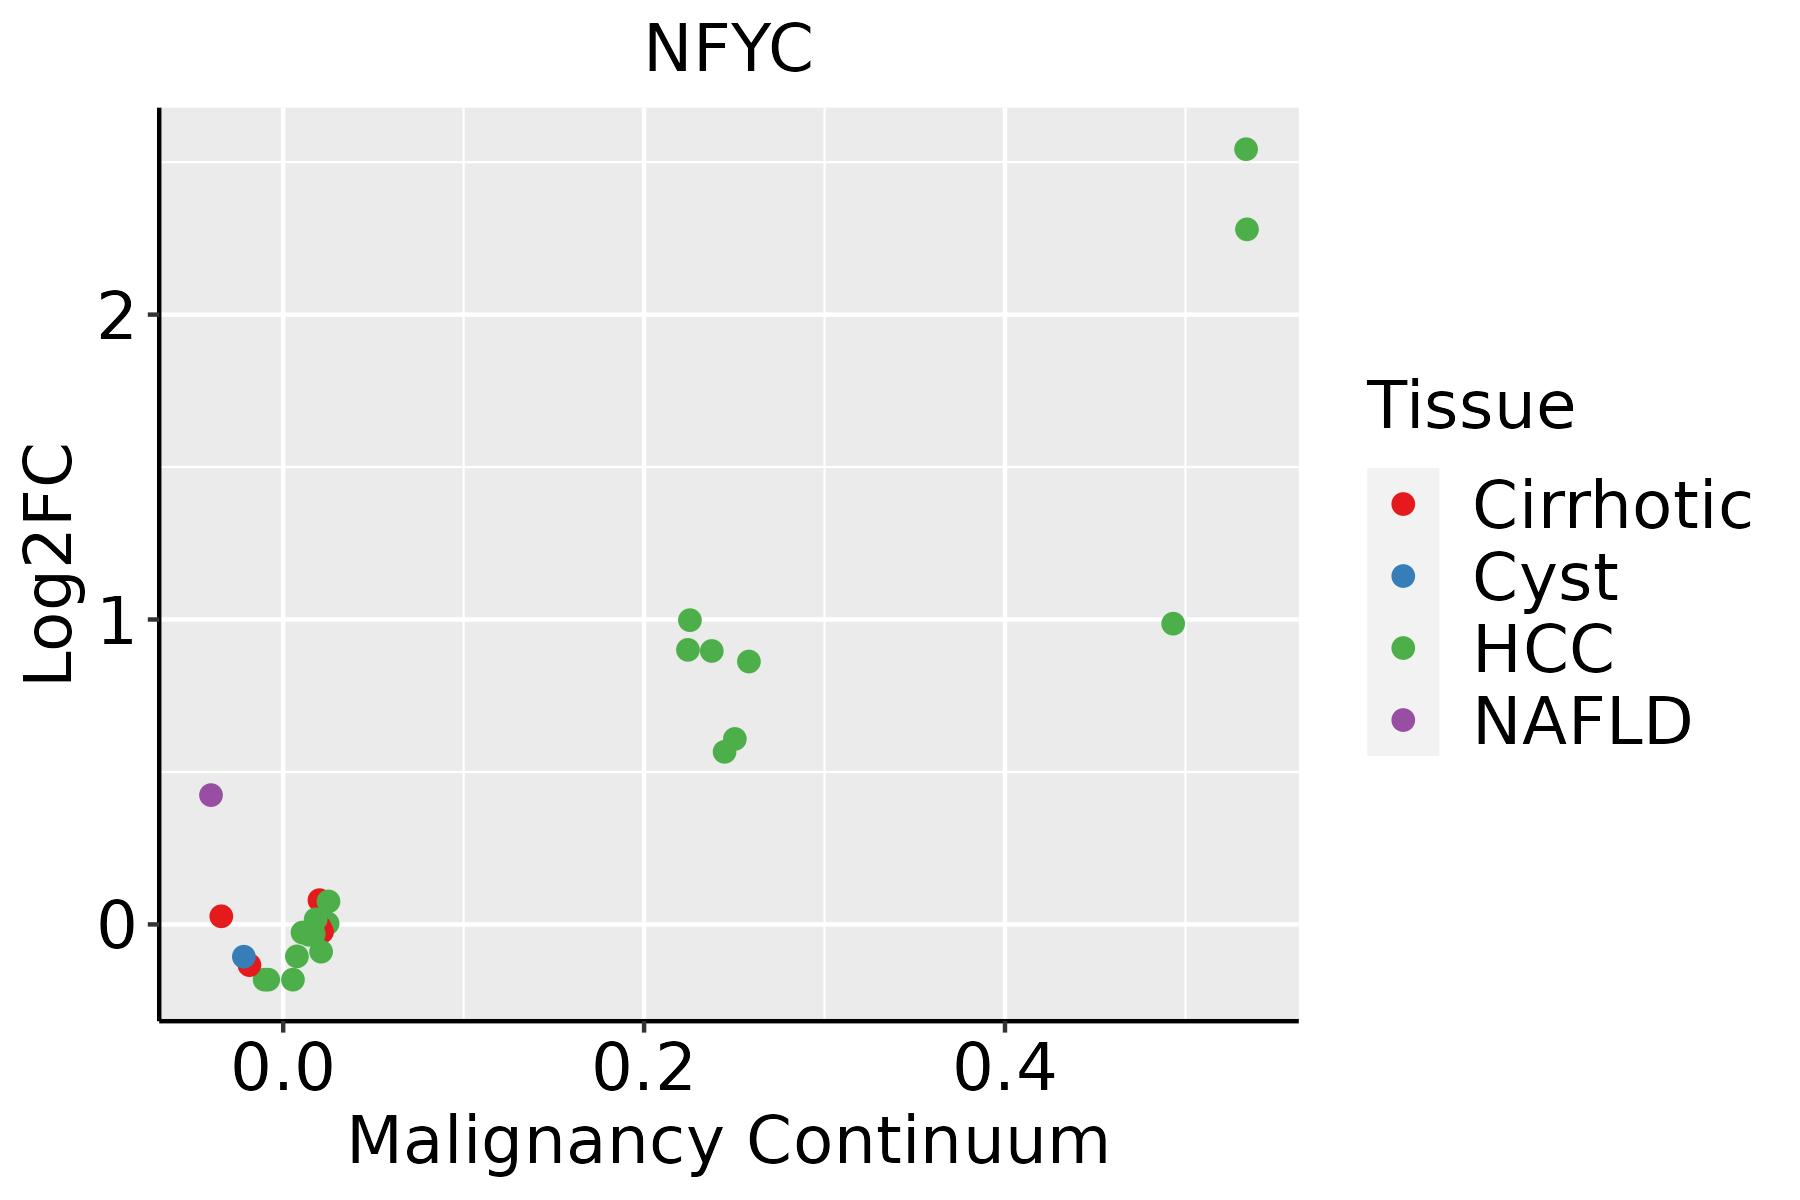 | HCC: Hepatocellular carcinoma |
| NAFLD: Non-alcoholic fatty liver disease | ||
| Oral Cavity | 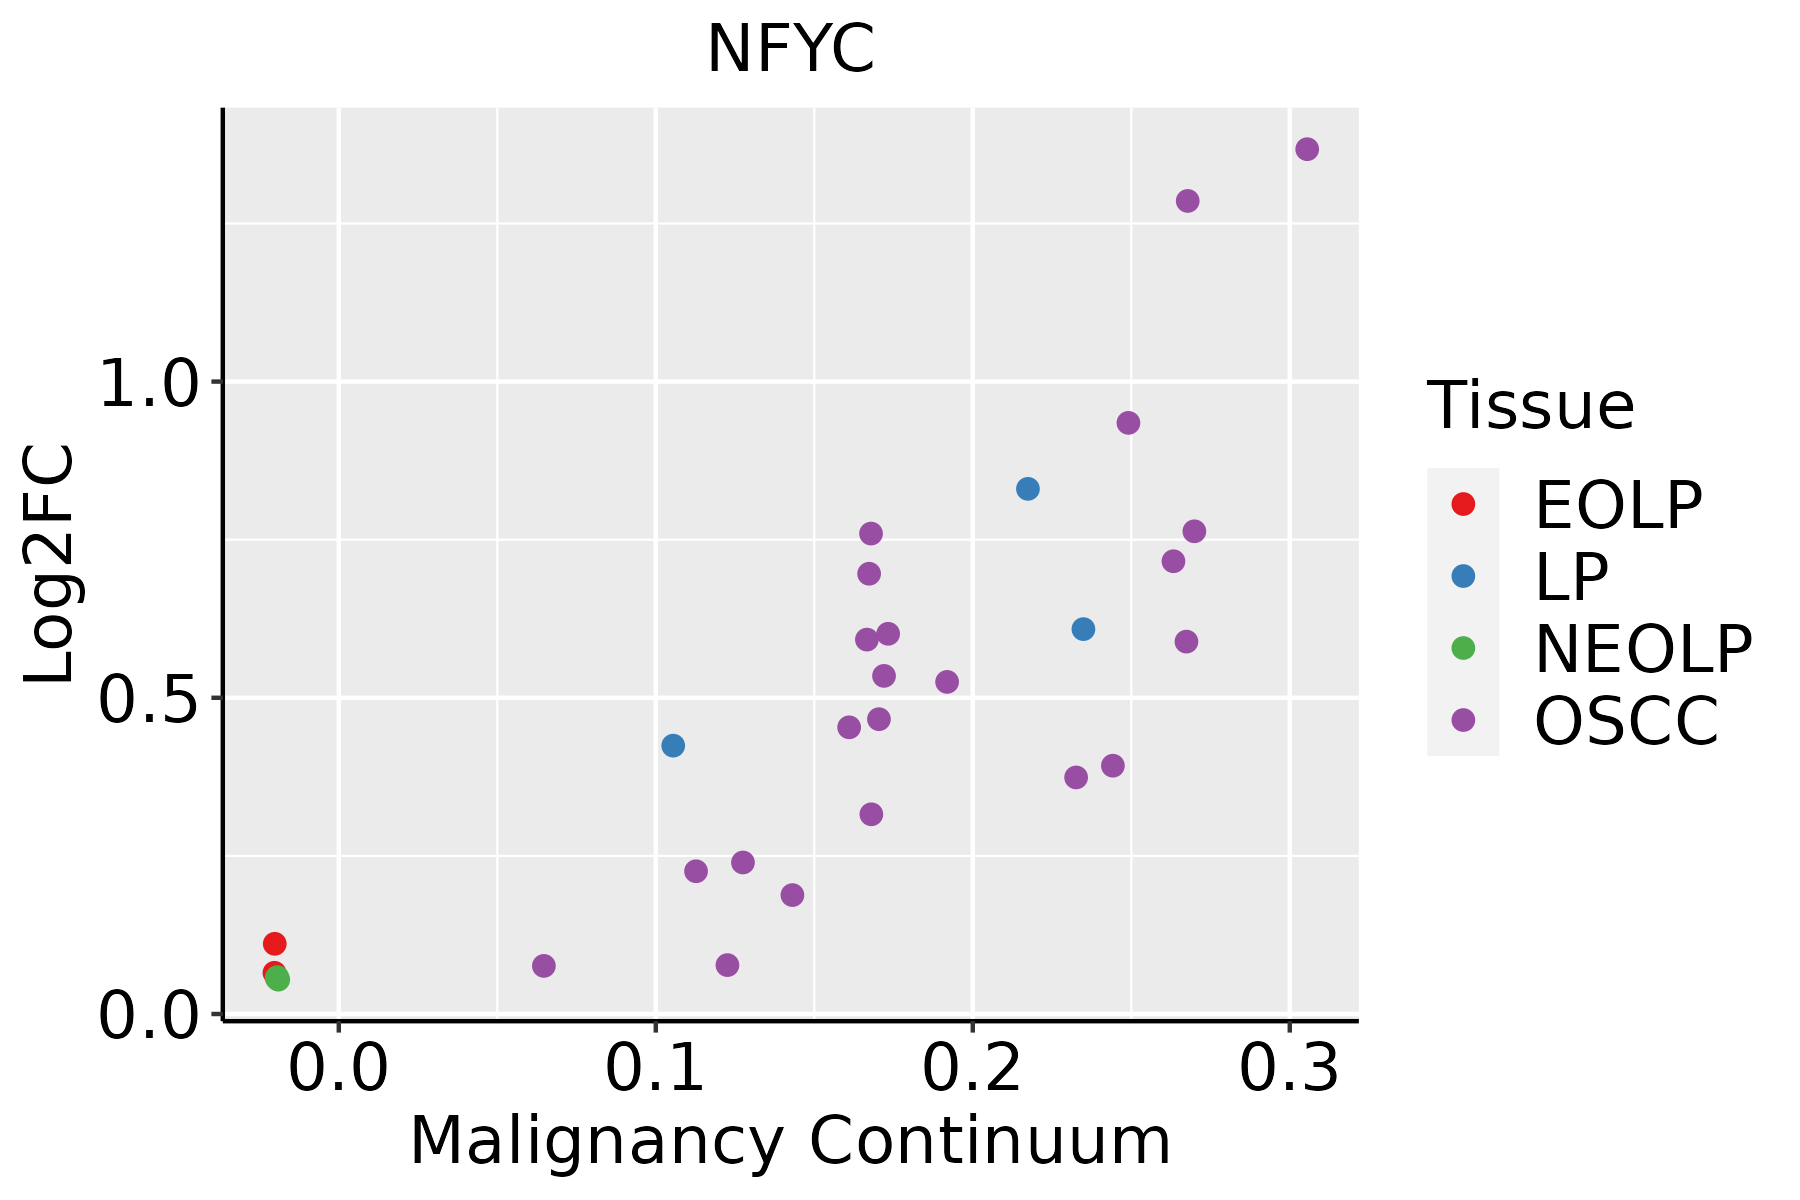 | EOLP: Erosive Oral lichen planus |
| LP: leukoplakia | ||
| NEOLP: Non-erosive oral lichen planus | ||
| OSCC: Oral squamous cell carcinoma | ||
| Skin | 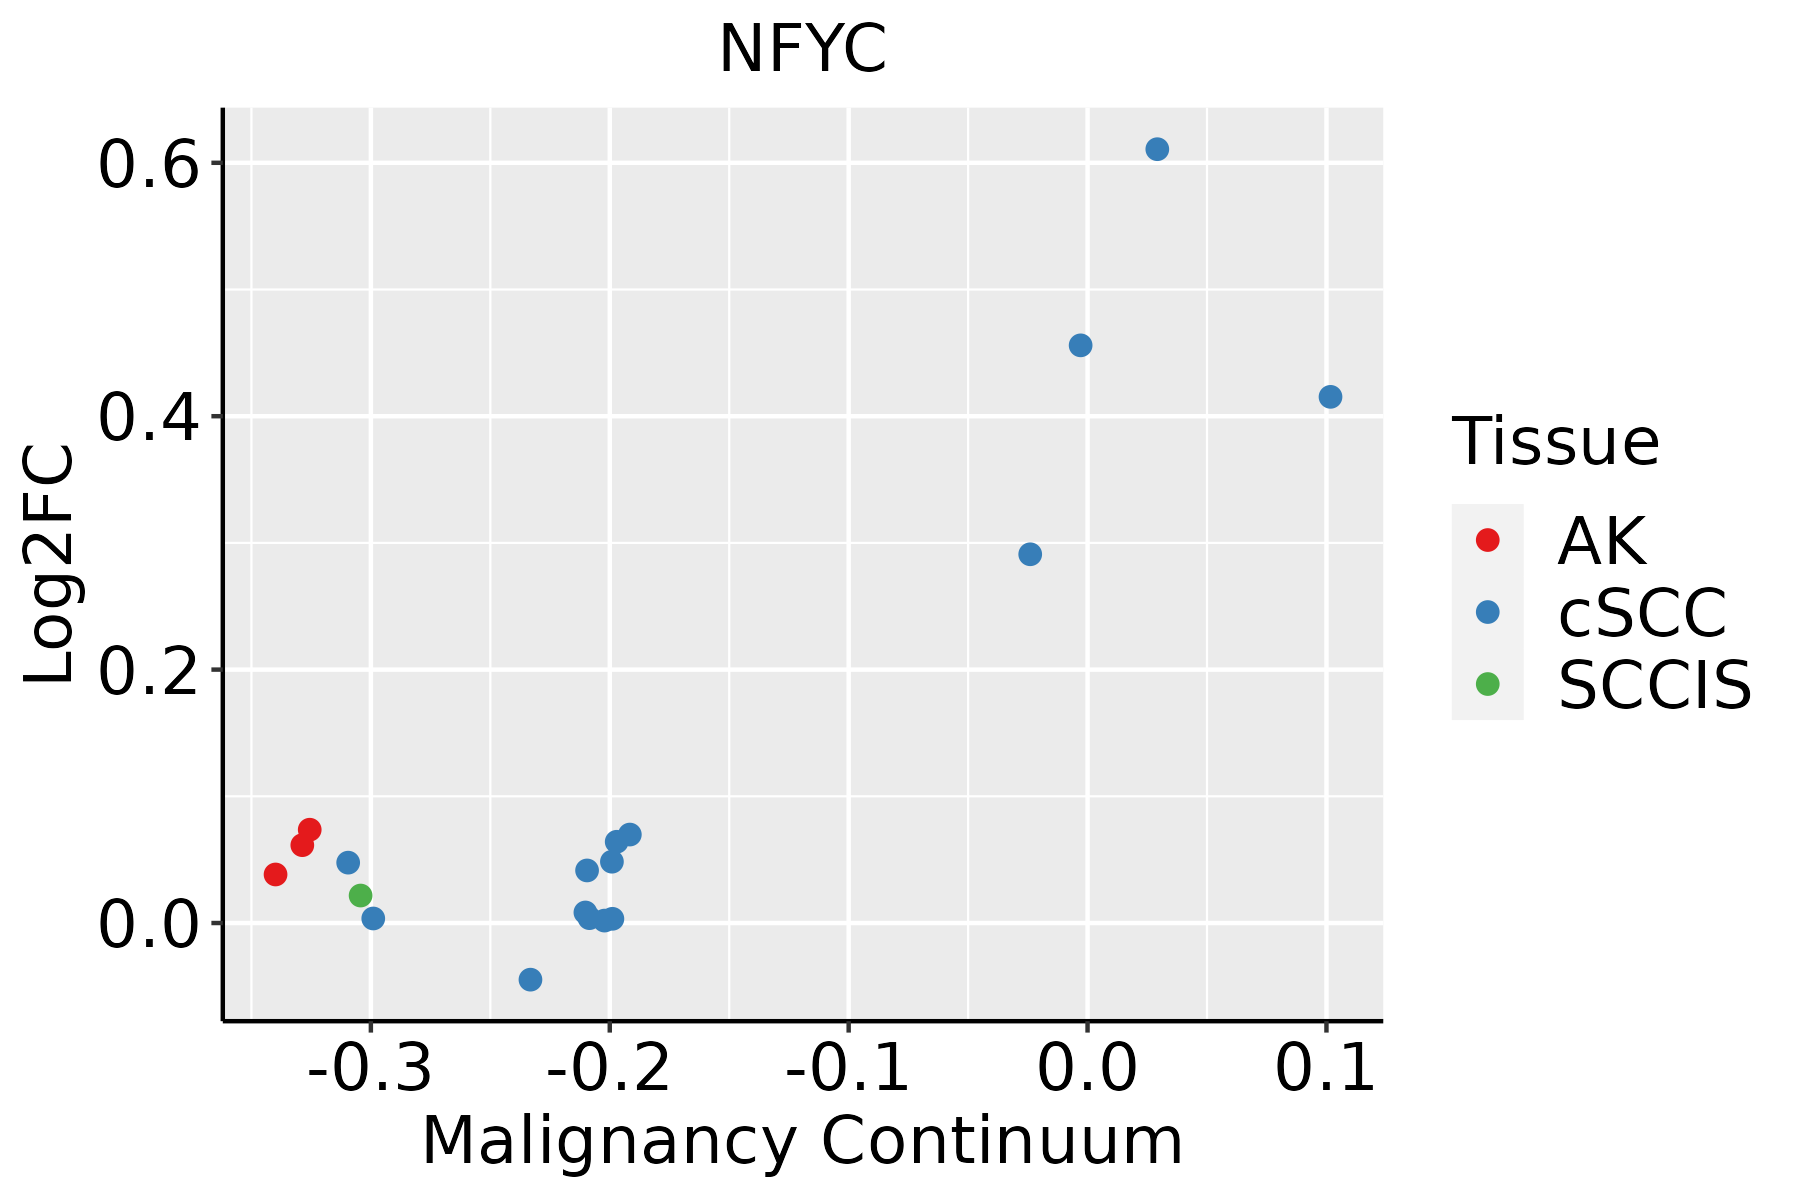 | AK: Actinic keratosis |
| cSCC: Cutaneous squamous cell carcinoma | ||
| SCCIS:squamous cell carcinoma in situ |
| ∗log2FC in expression of this searched gene in stem-like cells from each diseased tissue sample relative to stem-like cells in normal samples in each tissue plotted against the malignancy continuum. Samples are colored based on if they are from different disease stage. |
Top |
Malignant transformation related pathway analysis |
| Find out the enriched GO biological processes and KEGG pathways involved in transition from healthy to precancer to cancer |
| Tissue | Disease Stage | Enriched GO biological Processes |
| Colorectum | AD |  |
| Colorectum | SER |  |
| Colorectum | MSS |  |
| Colorectum | MSI-H |  |
| Colorectum | FAP |  |
| ∗Top 15 enriched GO BP terms are showed in the bar plot of each disease state in each tissue. Each row represents a significant GO biological process which is colored according to the -log10(p.adjust). |
| Page: 1 2 3 4 5 6 7 8 9 |
| GO ID | Tissue | Disease Stage | Description | Gene Ratio | Bg Ratio | pvalue | p.adjust | Count |
| GO:0006457 | Colorectum | AD | protein folding | 73/3918 | 212/18723 | 3.24e-06 | 9.10e-05 | 73 |
| GO:00064572 | Colorectum | MSS | protein folding | 71/3467 | 212/18723 | 1.25e-07 | 5.91e-06 | 71 |
| GO:00064574 | Colorectum | FAP | protein folding | 44/2622 | 212/18723 | 4.36e-03 | 2.98e-02 | 44 |
| GO:000645720 | Esophagus | HGIN | protein folding | 75/2587 | 212/18723 | 1.61e-15 | 3.86e-13 | 75 |
| GO:0006457110 | Esophagus | ESCC | protein folding | 163/8552 | 212/18723 | 1.13e-20 | 1.74e-18 | 163 |
| GO:00064577 | Liver | Cirrhotic | protein folding | 114/4634 | 212/18723 | 9.23e-20 | 2.31e-17 | 114 |
| GO:000645712 | Liver | HCC | protein folding | 160/7958 | 212/18723 | 1.07e-22 | 1.88e-20 | 160 |
| GO:000645718 | Oral cavity | OSCC | protein folding | 154/7305 | 212/18723 | 1.89e-23 | 4.60e-21 | 154 |
| GO:0006457111 | Skin | cSCC | protein folding | 131/4864 | 212/18723 | 2.96e-28 | 1.32e-25 | 131 |
| Page: 1 |
| Pathway ID | Tissue | Disease Stage | Description | Gene Ratio | Bg Ratio | pvalue | p.adjust | qvalue | Count |
| hsa046122 | Colorectum | MSS | Antigen processing and presentation | 27/1875 | 78/8465 | 7.72e-03 | 2.91e-02 | 1.78e-02 | 27 |
| hsa046123 | Colorectum | MSS | Antigen processing and presentation | 27/1875 | 78/8465 | 7.72e-03 | 2.91e-02 | 1.78e-02 | 27 |
| hsa051527 | Esophagus | ESCC | Tuberculosis | 111/4205 | 180/8465 | 7.14e-04 | 2.32e-03 | 1.19e-03 | 111 |
| hsa0461230 | Esophagus | ESCC | Antigen processing and presentation | 51/4205 | 78/8465 | 3.57e-03 | 9.34e-03 | 4.78e-03 | 51 |
| hsa0515212 | Esophagus | ESCC | Tuberculosis | 111/4205 | 180/8465 | 7.14e-04 | 2.32e-03 | 1.19e-03 | 111 |
| hsa04612114 | Esophagus | ESCC | Antigen processing and presentation | 51/4205 | 78/8465 | 3.57e-03 | 9.34e-03 | 4.78e-03 | 51 |
| hsa0461214 | Liver | Cirrhotic | Antigen processing and presentation | 36/2530 | 78/8465 | 1.69e-03 | 8.01e-03 | 4.94e-03 | 36 |
| hsa0461215 | Liver | Cirrhotic | Antigen processing and presentation | 36/2530 | 78/8465 | 1.69e-03 | 8.01e-03 | 4.94e-03 | 36 |
| hsa051526 | Oral cavity | OSCC | Tuberculosis | 105/3704 | 180/8465 | 5.00e-05 | 2.04e-04 | 1.04e-04 | 105 |
| hsa0461229 | Oral cavity | OSCC | Antigen processing and presentation | 47/3704 | 78/8465 | 2.37e-03 | 6.35e-03 | 3.23e-03 | 47 |
| hsa0515211 | Oral cavity | OSCC | Tuberculosis | 105/3704 | 180/8465 | 5.00e-05 | 2.04e-04 | 1.04e-04 | 105 |
| hsa04612113 | Oral cavity | OSCC | Antigen processing and presentation | 47/3704 | 78/8465 | 2.37e-03 | 6.35e-03 | 3.23e-03 | 47 |
| Page: 1 |
Top |
Cell-cell communication analysis |
| Identification of potential cell-cell interactions between two cell types and their ligand-receptor pairs for different disease states |
| Ligand | Receptor | LRpair | Pathway | Tissue | Disease Stage |
| Page: 1 |
Top |
Single-cell gene regulatory network inference analysis |
| Find out the significant the regulons (TFs) and the target genes of each regulon across cell types for different disease states |
| TF | Cell Type | Tissue | Disease Stage | Target Gene | RSS | Regulon Activity |
| NFYC | MAC | Colorectum | MSI-H | IL16,PEX5,GATD1, etc. | 9.52e-02 |  |
| NFYC | MAC | Colorectum | MSS | IL16,PEX5,GATD1, etc. | 4.68e-02 |  |
| NFYC | PERI | Colorectum | ADJ | NAV1,SNTG2,ITGA9, etc. | 3.41e-02 |  |
| NFYC | LYMEND | Colorectum | CRC | NAV1,SNTG2,ITGA9, etc. | 2.40e-02 |  |
| NFYC | SURF | Endometrium | ADJ | PRR15L,C1orf210,WDCP, etc. | -2.22e-16 |  |
| NFYC | BAS | Endometrium | ADJ | PRR15L,C1orf210,WDCP, etc. | 0.00e+00 | |
| NFYC | BAS | Endometrium | EEC | PRR15L,C1orf210,WDCP, etc. | 0.00e+00 |  |
| NFYC | BMEM | Liver | Healthy | PTPRM,PDCD6,SNRPF, etc. | 7.26e-02 |  |
| NFYC | PLA | Lung | AAH | KCTD10,ASB6,GRK5, etc. | 1.52e-02 |  |
| NFYC | M1MAC | Lung | AAH | KCTD10,ASB6,GRK5, etc. | 0.00e+00 | |
| ∗The dot plots of a searched regulon are shown for all cell subpopulations in each disease state of each tissue based on the regulon specific score inferred using pySCENIC and by calculating the average expression. |
| Page: 1 2 |
Top |
Somatic mutation of malignant transformation related genes |
| Annotation of somatic variants for genes involved in malignant transformation |
| Hugo Symbol | Variant Class | Variant Classification | dbSNP RS | HGVSc | HGVSp | HGVSp Short | SWISSPROT | BIOTYPE | SIFT | PolyPhen | Tumor Sample Barcode | Tissue | Histology | Sex | Age | Stage | Therapy Types | Drugs | Outcome |
| NFYC | SNV | Missense_Mutation | c.169N>A | p.Asp57Asn | p.D57N | Q13952 | protein_coding | tolerated_low_confidence(0.05) | probably_damaging(0.997) | TCGA-BH-A0DZ-01 | Breast | breast invasive carcinoma | Female | <65 | I/II | Chemotherapy | docetaxel | SD | |
| NFYC | SNV | Missense_Mutation | c.1214N>T | p.Pro405Leu | p.P405L | Q13952 | protein_coding | deleterious_low_confidence(0) | benign(0) | TCGA-D8-A1JD-01 | Breast | breast invasive carcinoma | Female | <65 | I/II | Chemotherapy | adriamycin | SD | |
| NFYC | SNV | Missense_Mutation | rs200544060 | c.1348N>A | p.Gly450Arg | p.G450R | Q13952 | protein_coding | deleterious_low_confidence(0) | possibly_damaging(0.515) | TCGA-Q1-A6DW-01 | Cervix | cervical & endocervical cancer | Female | <65 | I/II | Chemotherapy | cisplatin | SD |
| NFYC | deletion | Frame_Shift_Del | novel | c.1059delN | p.Ser356HisfsTer54 | p.S356Hfs*54 | Q13952 | protein_coding | TCGA-EA-A410-01 | Cervix | cervical & endocervical cancer | Female | <65 | I/II | Unknown | Unknown | SD | ||
| NFYC | SNV | Missense_Mutation | c.641N>G | p.Gln214Arg | p.Q214R | Q13952 | protein_coding | deleterious_low_confidence(0.01) | benign(0.107) | TCGA-AA-3845-01 | Colorectum | colon adenocarcinoma | Female | >=65 | I/II | Unknown | Unknown | PD | |
| NFYC | SNV | Missense_Mutation | rs762151390 | c.1189N>A | p.Glu397Lys | p.E397K | Q13952 | protein_coding | deleterious_low_confidence(0.01) | benign(0.068) | TCGA-AA-3930-01 | Colorectum | colon adenocarcinoma | Male | >=65 | III/IV | Chemotherapy | capecitabine | PD |
| NFYC | SNV | Missense_Mutation | c.293G>T | p.Arg98Ile | p.R98I | Q13952 | protein_coding | deleterious_low_confidence(0) | probably_damaging(0.998) | TCGA-AA-3977-01 | Colorectum | colon adenocarcinoma | Male | >=65 | I/II | Unknown | Unknown | SD | |
| NFYC | SNV | Missense_Mutation | rs762151390 | c.1189G>A | p.Glu397Lys | p.E397K | Q13952 | protein_coding | deleterious_low_confidence(0.01) | benign(0.068) | TCGA-AD-5900-01 | Colorectum | colon adenocarcinoma | Male | >=65 | I/II | Unknown | Unknown | SD |
| NFYC | SNV | Missense_Mutation | novel | c.634G>T | p.Ala212Ser | p.A212S | Q13952 | protein_coding | tolerated_low_confidence(0.16) | benign(0) | TCGA-AZ-4315-01 | Colorectum | colon adenocarcinoma | Male | <65 | I/II | Unknown | Unknown | SD |
| NFYC | SNV | Missense_Mutation | novel | c.860G>A | p.Arg287Gln | p.R287Q | Q13952 | protein_coding | tolerated_low_confidence(0.24) | benign(0) | TCGA-AZ-4315-01 | Colorectum | colon adenocarcinoma | Male | <65 | I/II | Unknown | Unknown | SD |
| Page: 1 2 3 4 5 |
Top |
Related drugs of malignant transformation related genes |
| Identification of chemicals and drugs interact with genes involved in malignant transfromation |
| (DGIdb 4.0) |
| Entrez ID | Symbol | Category | Interaction Types | Drug Claim Name | Drug Name | PMIDs |
| Page: 1 |

Copyright 2023-Present -The University of Texas Health Science Center at Houston |