
|
|||||
|
 | |
| |
| |
| |
| |
| |
|
Gene: NFYB |
Gene summary for NFYB |
| Gene information | Species | Human | Gene symbol | NFYB | Gene ID | 4801 |
| Gene name | nuclear transcription factor Y subunit beta | |
| Gene Alias | CBF-A | |
| Cytomap | 12q23.3 | |
| Gene Type | protein-coding | GO ID | GO:0006139 | UniProtAcc | A0A024RBG7 |
Top |
Malignant transformation analysis |
| Identification of the aberrant gene expression in precancerous and cancerous lesions by comparing the gene expression of stem-like cells in diseased tissues with normal stem cells |
| Entrez ID | Symbol | Replicates | Species | Organ | Tissue | Adj P-value | Log2FC | Malignancy |
| 4801 | NFYB | LZE4T | Human | Esophagus | ESCC | 2.89e-12 | 3.27e-01 | 0.0811 |
| 4801 | NFYB | LZE7T | Human | Esophagus | ESCC | 3.72e-04 | 1.87e-01 | 0.0667 |
| 4801 | NFYB | LZE8T | Human | Esophagus | ESCC | 9.46e-08 | 1.21e-01 | 0.067 |
| 4801 | NFYB | LZE20T | Human | Esophagus | ESCC | 8.03e-03 | 7.34e-02 | 0.0662 |
| 4801 | NFYB | LZE24T | Human | Esophagus | ESCC | 8.08e-14 | 3.53e-01 | 0.0596 |
| 4801 | NFYB | LZE6T | Human | Esophagus | ESCC | 7.46e-04 | 1.86e-01 | 0.0845 |
| 4801 | NFYB | P1T-E | Human | Esophagus | ESCC | 4.00e-07 | 2.16e-01 | 0.0875 |
| 4801 | NFYB | P2T-E | Human | Esophagus | ESCC | 9.14e-33 | 6.85e-01 | 0.1177 |
| 4801 | NFYB | P4T-E | Human | Esophagus | ESCC | 6.92e-27 | 6.44e-01 | 0.1323 |
| 4801 | NFYB | P5T-E | Human | Esophagus | ESCC | 5.35e-16 | 2.71e-01 | 0.1327 |
| 4801 | NFYB | P8T-E | Human | Esophagus | ESCC | 7.12e-29 | 5.86e-01 | 0.0889 |
| 4801 | NFYB | P9T-E | Human | Esophagus | ESCC | 1.31e-10 | 2.47e-01 | 0.1131 |
| 4801 | NFYB | P10T-E | Human | Esophagus | ESCC | 1.59e-31 | 5.14e-01 | 0.116 |
| 4801 | NFYB | P11T-E | Human | Esophagus | ESCC | 4.64e-09 | 3.98e-01 | 0.1426 |
| 4801 | NFYB | P12T-E | Human | Esophagus | ESCC | 5.58e-23 | 5.60e-01 | 0.1122 |
| 4801 | NFYB | P15T-E | Human | Esophagus | ESCC | 2.66e-22 | 5.37e-01 | 0.1149 |
| 4801 | NFYB | P16T-E | Human | Esophagus | ESCC | 1.37e-18 | 2.60e-01 | 0.1153 |
| 4801 | NFYB | P17T-E | Human | Esophagus | ESCC | 8.07e-09 | 3.07e-01 | 0.1278 |
| 4801 | NFYB | P19T-E | Human | Esophagus | ESCC | 7.11e-04 | 2.96e-01 | 0.1662 |
| 4801 | NFYB | P20T-E | Human | Esophagus | ESCC | 1.62e-19 | 4.28e-01 | 0.1124 |
| Page: 1 2 3 4 5 |
| Tissue | Expression Dynamics | Abbreviation |
| Esophagus |  | ESCC: Esophageal squamous cell carcinoma |
| HGIN: High-grade intraepithelial neoplasias | ||
| LGIN: Low-grade intraepithelial neoplasias | ||
| Liver | 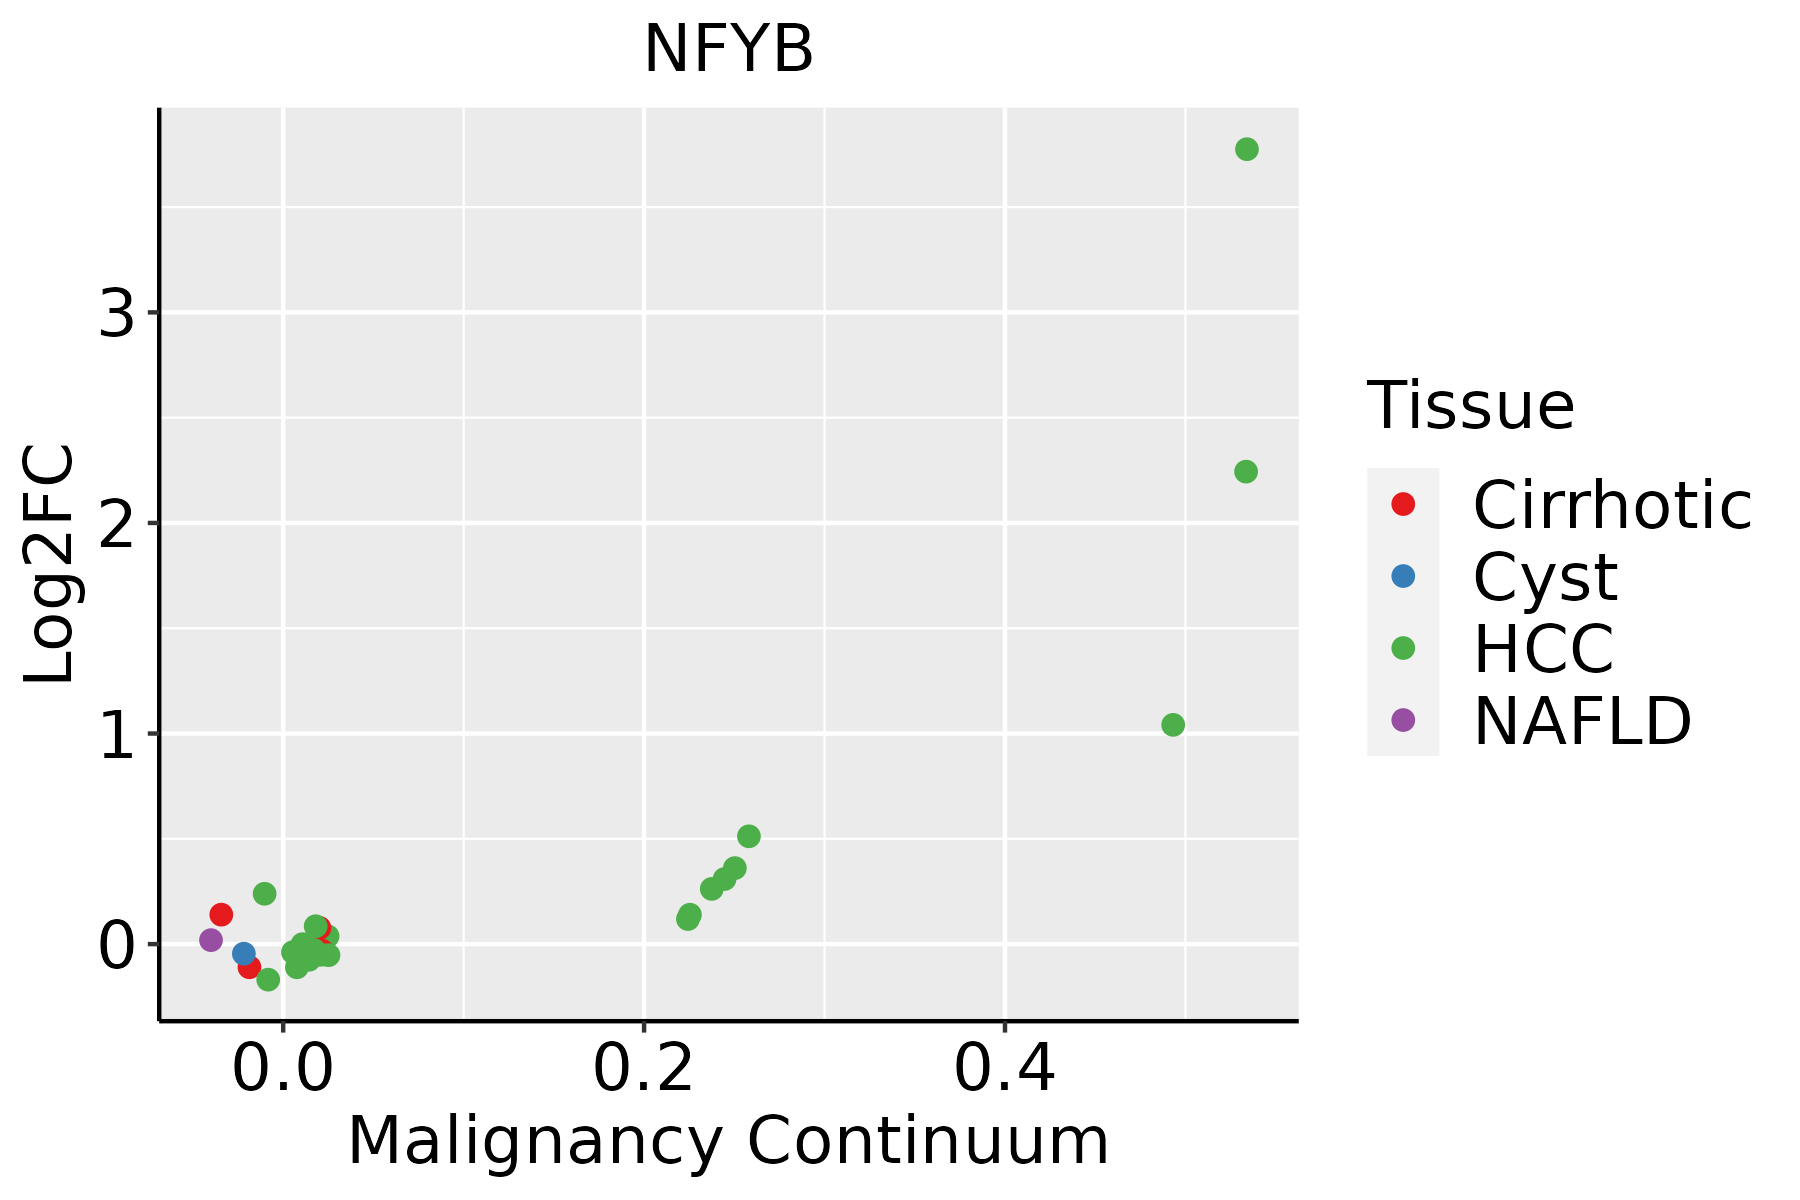 | HCC: Hepatocellular carcinoma |
| NAFLD: Non-alcoholic fatty liver disease | ||
| Oral Cavity |  | EOLP: Erosive Oral lichen planus |
| LP: leukoplakia | ||
| NEOLP: Non-erosive oral lichen planus | ||
| OSCC: Oral squamous cell carcinoma | ||
| Skin | 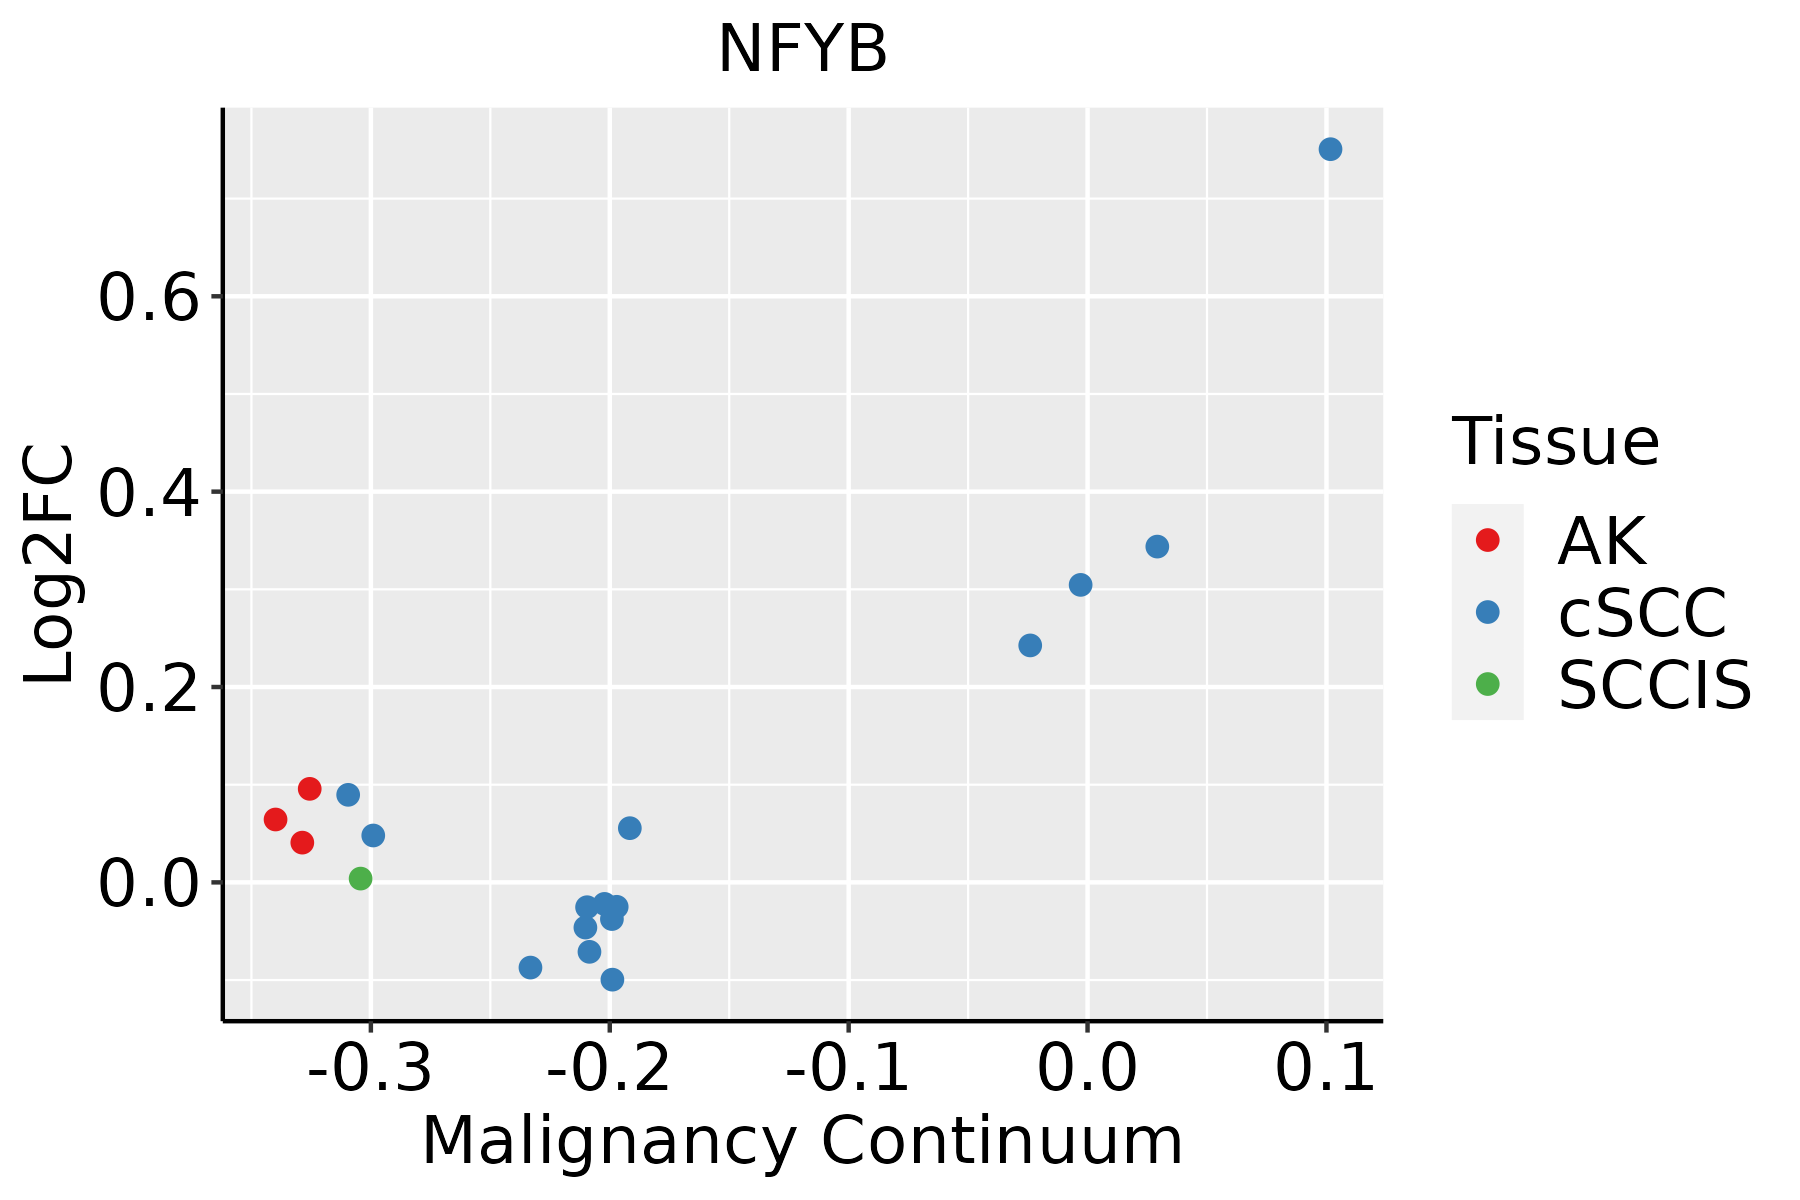 | AK: Actinic keratosis |
| cSCC: Cutaneous squamous cell carcinoma | ||
| SCCIS:squamous cell carcinoma in situ |
| ∗log2FC in expression of this searched gene in stem-like cells from each diseased tissue sample relative to stem-like cells in normal samples in each tissue plotted against the malignancy continuum. Samples are colored based on if they are from different disease stage. |
Top |
Malignant transformation related pathway analysis |
| Find out the enriched GO biological processes and KEGG pathways involved in transition from healthy to precancer to cancer |
| Tissue | Disease Stage | Enriched GO biological Processes |
| Colorectum | AD |  |
| Colorectum | SER |  |
| Colorectum | MSS |  |
| Colorectum | MSI-H |  |
| Colorectum | FAP |  |
| ∗Top 15 enriched GO BP terms are showed in the bar plot of each disease state in each tissue. Each row represents a significant GO biological process which is colored according to the -log10(p.adjust). |
| Page: 1 2 3 4 5 6 7 8 9 |
| GO ID | Tissue | Disease Stage | Description | Gene Ratio | Bg Ratio | pvalue | p.adjust | Count |
| GO:199082316 | Esophagus | ESCC | response to leukemia inhibitory factor | 60/8552 | 95/18723 | 4.41e-04 | 2.48e-03 | 60 |
| GO:199083015 | Esophagus | ESCC | cellular response to leukemia inhibitory factor | 59/8552 | 94/18723 | 6.19e-04 | 3.32e-03 | 59 |
| GO:19908237 | Oral cavity | OSCC | response to leukemia inhibitory factor | 58/7305 | 95/18723 | 1.10e-05 | 1.14e-04 | 58 |
| GO:19908307 | Oral cavity | OSCC | cellular response to leukemia inhibitory factor | 57/7305 | 94/18723 | 1.75e-05 | 1.71e-04 | 57 |
| GO:199082317 | Skin | cSCC | response to leukemia inhibitory factor | 42/4864 | 95/18723 | 8.79e-05 | 8.27e-04 | 42 |
| GO:199083016 | Skin | cSCC | cellular response to leukemia inhibitory factor | 41/4864 | 94/18723 | 1.53e-04 | 1.35e-03 | 41 |
| Page: 1 |
| Pathway ID | Tissue | Disease Stage | Description | Gene Ratio | Bg Ratio | pvalue | p.adjust | qvalue | Count |
| hsa05166211 | Esophagus | ESCC | Human T-cell leukemia virus 1 infection | 164/4205 | 222/8465 | 8.13e-14 | 2.09e-12 | 1.07e-12 | 164 |
| hsa051527 | Esophagus | ESCC | Tuberculosis | 111/4205 | 180/8465 | 7.14e-04 | 2.32e-03 | 1.19e-03 | 111 |
| hsa0461230 | Esophagus | ESCC | Antigen processing and presentation | 51/4205 | 78/8465 | 3.57e-03 | 9.34e-03 | 4.78e-03 | 51 |
| hsa05166310 | Esophagus | ESCC | Human T-cell leukemia virus 1 infection | 164/4205 | 222/8465 | 8.13e-14 | 2.09e-12 | 1.07e-12 | 164 |
| hsa0515212 | Esophagus | ESCC | Tuberculosis | 111/4205 | 180/8465 | 7.14e-04 | 2.32e-03 | 1.19e-03 | 111 |
| hsa04612114 | Esophagus | ESCC | Antigen processing and presentation | 51/4205 | 78/8465 | 3.57e-03 | 9.34e-03 | 4.78e-03 | 51 |
| hsa0516622 | Liver | HCC | Human T-cell leukemia virus 1 infection | 139/4020 | 222/8465 | 3.17e-06 | 2.79e-05 | 1.55e-05 | 139 |
| hsa0516632 | Liver | HCC | Human T-cell leukemia virus 1 infection | 139/4020 | 222/8465 | 3.17e-06 | 2.79e-05 | 1.55e-05 | 139 |
| hsa0516630 | Oral cavity | OSCC | Human T-cell leukemia virus 1 infection | 150/3704 | 222/8465 | 3.68e-13 | 7.26e-12 | 3.70e-12 | 150 |
| hsa051526 | Oral cavity | OSCC | Tuberculosis | 105/3704 | 180/8465 | 5.00e-05 | 2.04e-04 | 1.04e-04 | 105 |
| hsa0461229 | Oral cavity | OSCC | Antigen processing and presentation | 47/3704 | 78/8465 | 2.37e-03 | 6.35e-03 | 3.23e-03 | 47 |
| hsa05166113 | Oral cavity | OSCC | Human T-cell leukemia virus 1 infection | 150/3704 | 222/8465 | 3.68e-13 | 7.26e-12 | 3.70e-12 | 150 |
| hsa0515211 | Oral cavity | OSCC | Tuberculosis | 105/3704 | 180/8465 | 5.00e-05 | 2.04e-04 | 1.04e-04 | 105 |
| hsa04612113 | Oral cavity | OSCC | Antigen processing and presentation | 47/3704 | 78/8465 | 2.37e-03 | 6.35e-03 | 3.23e-03 | 47 |
| Page: 1 |
Top |
Cell-cell communication analysis |
| Identification of potential cell-cell interactions between two cell types and their ligand-receptor pairs for different disease states |
| Ligand | Receptor | LRpair | Pathway | Tissue | Disease Stage |
| Page: 1 |
Top |
Single-cell gene regulatory network inference analysis |
| Find out the significant the regulons (TFs) and the target genes of each regulon across cell types for different disease states |
| TF | Cell Type | Tissue | Disease Stage | Target Gene | RSS | Regulon Activity |
| NFYB | INCAF | Cervix | N_HPV | SLC2A4,TWISTNB,BAG2, etc. | 7.86e-01 |  |
| NFYB | CD8TEXINT | Endometrium | AEH | JCHAIN,ACSL6,CLP1, etc. | 1.20e-01 |  |
| NFYB | TH1 | Endometrium | EEC | JCHAIN,ACSL6,CLP1, etc. | 7.96e-02 |  |
| NFYB | PRO | Esophagus | HGIN | NDUFB3,RP11-225N10.1,PGF, etc. | 3.68e-01 |  |
| NFYB | PVA | Liver | Cirrhotic | CTC-425F1.4,CTC-526N19.1,EPT1, etc. | 3.97e-01 |  |
| NFYB | SPI | Oral cavity | Healthy | PPP1R10,YOD1,STX7, etc. | 3.11e-01 |  |
| NFYB | CAF | Oral cavity | ADJ | TNFSF13B,PAPLN,LXN, etc. | 3.58e-02 |  |
| NFYB | FIB | Oral cavity | ADJ | TNFSF13B,PAPLN,LXN, etc. | 2.63e-04 | |
| NFYB | MYOFIB | Oral cavity | ADJ | TNFSF13B,PAPLN,LXN, etc. | -4.44e-16 | |
| NFYB | ECM | Oral cavity | Healthy | TNFSF13B,PAPLN,LXN, etc. | 6.71e-02 | |
| ∗The dot plots of a searched regulon are shown for all cell subpopulations in each disease state of each tissue based on the regulon specific score inferred using pySCENIC and by calculating the average expression. |
| Page: 1 2 |
Top |
Somatic mutation of malignant transformation related genes |
| Annotation of somatic variants for genes involved in malignant transformation |
| Hugo Symbol | Variant Class | Variant Classification | dbSNP RS | HGVSc | HGVSp | HGVSp Short | SWISSPROT | BIOTYPE | SIFT | PolyPhen | Tumor Sample Barcode | Tissue | Histology | Sex | Age | Stage | Therapy Types | Drugs | Outcome |
| NFYB | insertion | Nonsense_Mutation | novel | c.268_269insAAACTGTTCCACCTCAGATCATCAGGCATTAGTTAGATTCTCA | p.Val90GlufsTer11 | p.V90Efs*11 | P25208 | protein_coding | TCGA-A2-A04T-01 | Breast | breast invasive carcinoma | Female | <65 | I/II | Chemotherapy | cyclophosphamide | SD | ||
| NFYB | insertion | Frame_Shift_Ins | novel | c.278_279insATATCAGCAGTCCTCAACATTTTTGGCAC | p.Phe93LeufsTer15 | p.F93Lfs*15 | P25208 | protein_coding | TCGA-BH-A0BM-01 | Breast | breast invasive carcinoma | Female | <65 | I/II | Chemotherapy | adriamycin | SD | ||
| NFYB | SNV | Missense_Mutation | c.550N>G | p.Gln184Glu | p.Q184E | P25208 | protein_coding | deleterious(0.04) | benign(0.074) | TCGA-EA-A3QE-01 | Cervix | cervical & endocervical cancer | Female | <65 | I/II | Unknown | Unknown | SD | |
| NFYB | SNV | Missense_Mutation | novel | c.530G>A | p.Gly177Asp | p.G177D | P25208 | protein_coding | tolerated(0.06) | benign(0.079) | TCGA-AA-3947-01 | Colorectum | colon adenocarcinoma | Female | <65 | I/II | Unknown | Unknown | SD |
| NFYB | SNV | Missense_Mutation | c.387N>G | p.Ser129Arg | p.S129R | P25208 | protein_coding | deleterious(0) | benign(0.007) | TCGA-AA-3977-01 | Colorectum | colon adenocarcinoma | Male | >=65 | I/II | Unknown | Unknown | SD | |
| NFYB | SNV | Missense_Mutation | c.116T>C | p.Met39Thr | p.M39T | P25208 | protein_coding | tolerated(0.62) | benign(0) | TCGA-AZ-6598-01 | Colorectum | colon adenocarcinoma | Female | >=65 | I/II | Unknown | Unknown | SD | |
| NFYB | SNV | Missense_Mutation | novel | c.279N>A | p.Phe93Leu | p.F93L | P25208 | protein_coding | deleterious(0.02) | probably_damaging(0.986) | TCGA-F5-6814-01 | Colorectum | rectum adenocarcinoma | Male | <65 | I/II | Unknown | Unknown | SD |
| NFYB | SNV | Missense_Mutation | c.352N>G | p.Ile118Val | p.I118V | P25208 | protein_coding | tolerated(0.06) | possibly_damaging(0.68) | TCGA-AP-A051-01 | Endometrium | uterine corpus endometrioid carcinoma | Female | >=65 | I/II | Unknown | Unknown | SD | |
| NFYB | SNV | Missense_Mutation | novel | c.287T>G | p.Phe96Cys | p.F96C | P25208 | protein_coding | deleterious(0) | probably_damaging(0.977) | TCGA-AP-A1E0-01 | Endometrium | uterine corpus endometrioid carcinoma | Female | <65 | III/IV | Chemotherapy | paclitaxel | SD |
| NFYB | SNV | Missense_Mutation | novel | c.355N>A | p.Leu119Ile | p.L119I | P25208 | protein_coding | deleterious(0.03) | possibly_damaging(0.773) | TCGA-AX-A05Z-01 | Endometrium | uterine corpus endometrioid carcinoma | Female | <65 | III/IV | Chemotherapy | adriamycin | SD |
| Page: 1 2 |
Top |
Related drugs of malignant transformation related genes |
| Identification of chemicals and drugs interact with genes involved in malignant transfromation |
| (DGIdb 4.0) |
| Entrez ID | Symbol | Category | Interaction Types | Drug Claim Name | Drug Name | PMIDs |
| Page: 1 |

Copyright 2023-Present -The University of Texas Health Science Center at Houston |