
|
|||||
|
 | |
| |
| |
| |
| |
| |
|
Gene: NFYA |
Gene summary for NFYA |
| Gene information | Species | Human | Gene symbol | NFYA | Gene ID | 4800 |
| Gene name | nuclear transcription factor Y subunit alpha | |
| Gene Alias | CBF-A | |
| Cytomap | 6p21.1 | |
| Gene Type | protein-coding | GO ID | GO:0006139 | UniProtAcc | P23511 |
Top |
Malignant transformation analysis |
| Identification of the aberrant gene expression in precancerous and cancerous lesions by comparing the gene expression of stem-like cells in diseased tissues with normal stem cells |
| Entrez ID | Symbol | Replicates | Species | Organ | Tissue | Adj P-value | Log2FC | Malignancy |
| 4800 | NFYA | LZE2T | Human | Esophagus | ESCC | 4.04e-02 | 2.67e-01 | 0.082 |
| 4800 | NFYA | LZE4T | Human | Esophagus | ESCC | 1.29e-04 | 1.51e-01 | 0.0811 |
| 4800 | NFYA | LZE7T | Human | Esophagus | ESCC | 2.37e-04 | 2.08e-01 | 0.0667 |
| 4800 | NFYA | LZE24T | Human | Esophagus | ESCC | 1.73e-07 | 1.78e-01 | 0.0596 |
| 4800 | NFYA | LZE6T | Human | Esophagus | ESCC | 9.76e-03 | 2.09e-01 | 0.0845 |
| 4800 | NFYA | P1T-E | Human | Esophagus | ESCC | 3.58e-02 | 2.18e-01 | 0.0875 |
| 4800 | NFYA | P2T-E | Human | Esophagus | ESCC | 7.84e-15 | 1.33e-01 | 0.1177 |
| 4800 | NFYA | P4T-E | Human | Esophagus | ESCC | 1.17e-11 | 2.07e-01 | 0.1323 |
| 4800 | NFYA | P5T-E | Human | Esophagus | ESCC | 3.79e-08 | 1.53e-01 | 0.1327 |
| 4800 | NFYA | P8T-E | Human | Esophagus | ESCC | 9.52e-04 | 8.49e-02 | 0.0889 |
| 4800 | NFYA | P9T-E | Human | Esophagus | ESCC | 2.25e-07 | 1.80e-01 | 0.1131 |
| 4800 | NFYA | P10T-E | Human | Esophagus | ESCC | 7.31e-14 | 1.98e-01 | 0.116 |
| 4800 | NFYA | P11T-E | Human | Esophagus | ESCC | 2.06e-06 | 4.73e-01 | 0.1426 |
| 4800 | NFYA | P12T-E | Human | Esophagus | ESCC | 1.93e-07 | 1.42e-01 | 0.1122 |
| 4800 | NFYA | P15T-E | Human | Esophagus | ESCC | 6.63e-09 | 1.33e-01 | 0.1149 |
| 4800 | NFYA | P16T-E | Human | Esophagus | ESCC | 1.81e-15 | 2.56e-01 | 0.1153 |
| 4800 | NFYA | P17T-E | Human | Esophagus | ESCC | 9.78e-03 | 1.33e-01 | 0.1278 |
| 4800 | NFYA | P20T-E | Human | Esophagus | ESCC | 2.22e-04 | 1.55e-01 | 0.1124 |
| 4800 | NFYA | P21T-E | Human | Esophagus | ESCC | 5.17e-07 | 1.32e-01 | 0.1617 |
| 4800 | NFYA | P22T-E | Human | Esophagus | ESCC | 4.85e-16 | 1.64e-01 | 0.1236 |
| Page: 1 2 3 4 |
| Tissue | Expression Dynamics | Abbreviation |
| Esophagus | 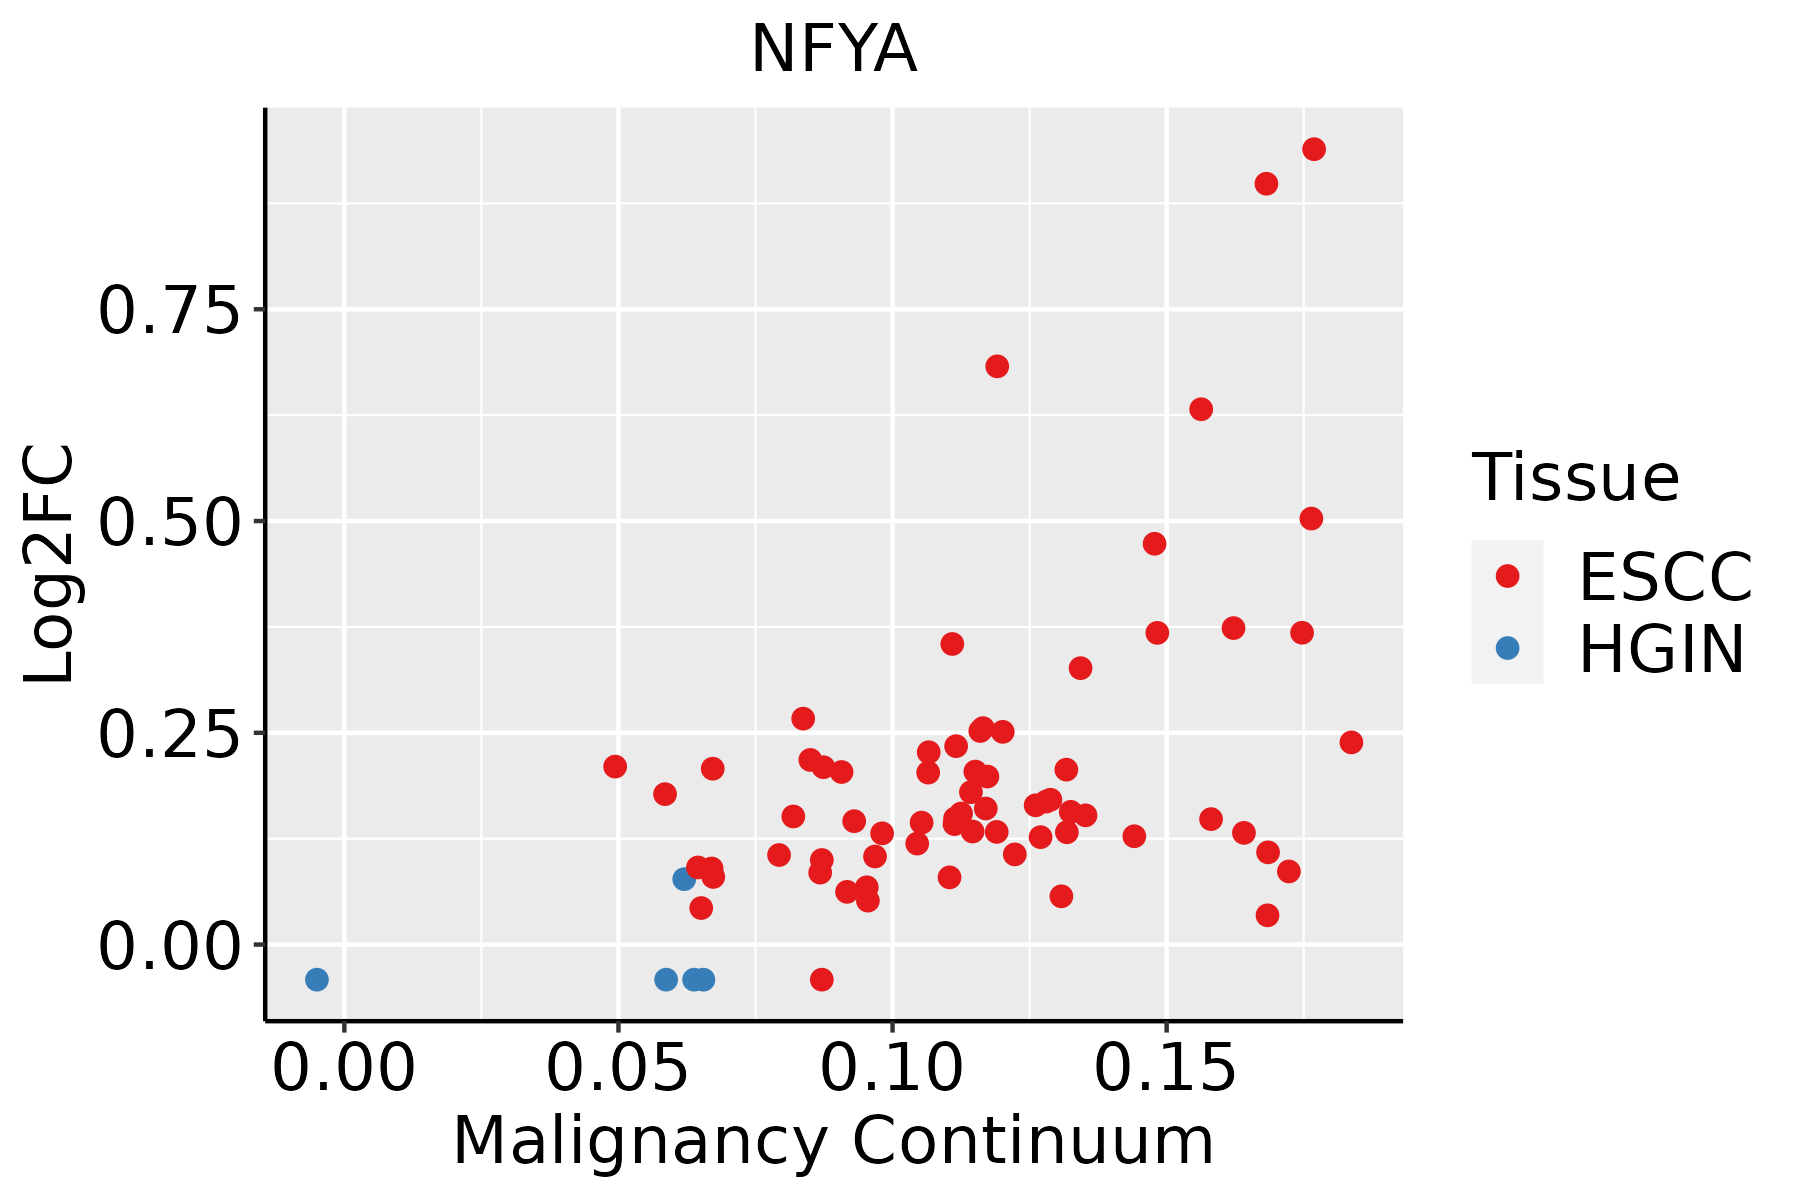 | ESCC: Esophageal squamous cell carcinoma |
| HGIN: High-grade intraepithelial neoplasias | ||
| LGIN: Low-grade intraepithelial neoplasias | ||
| Liver | 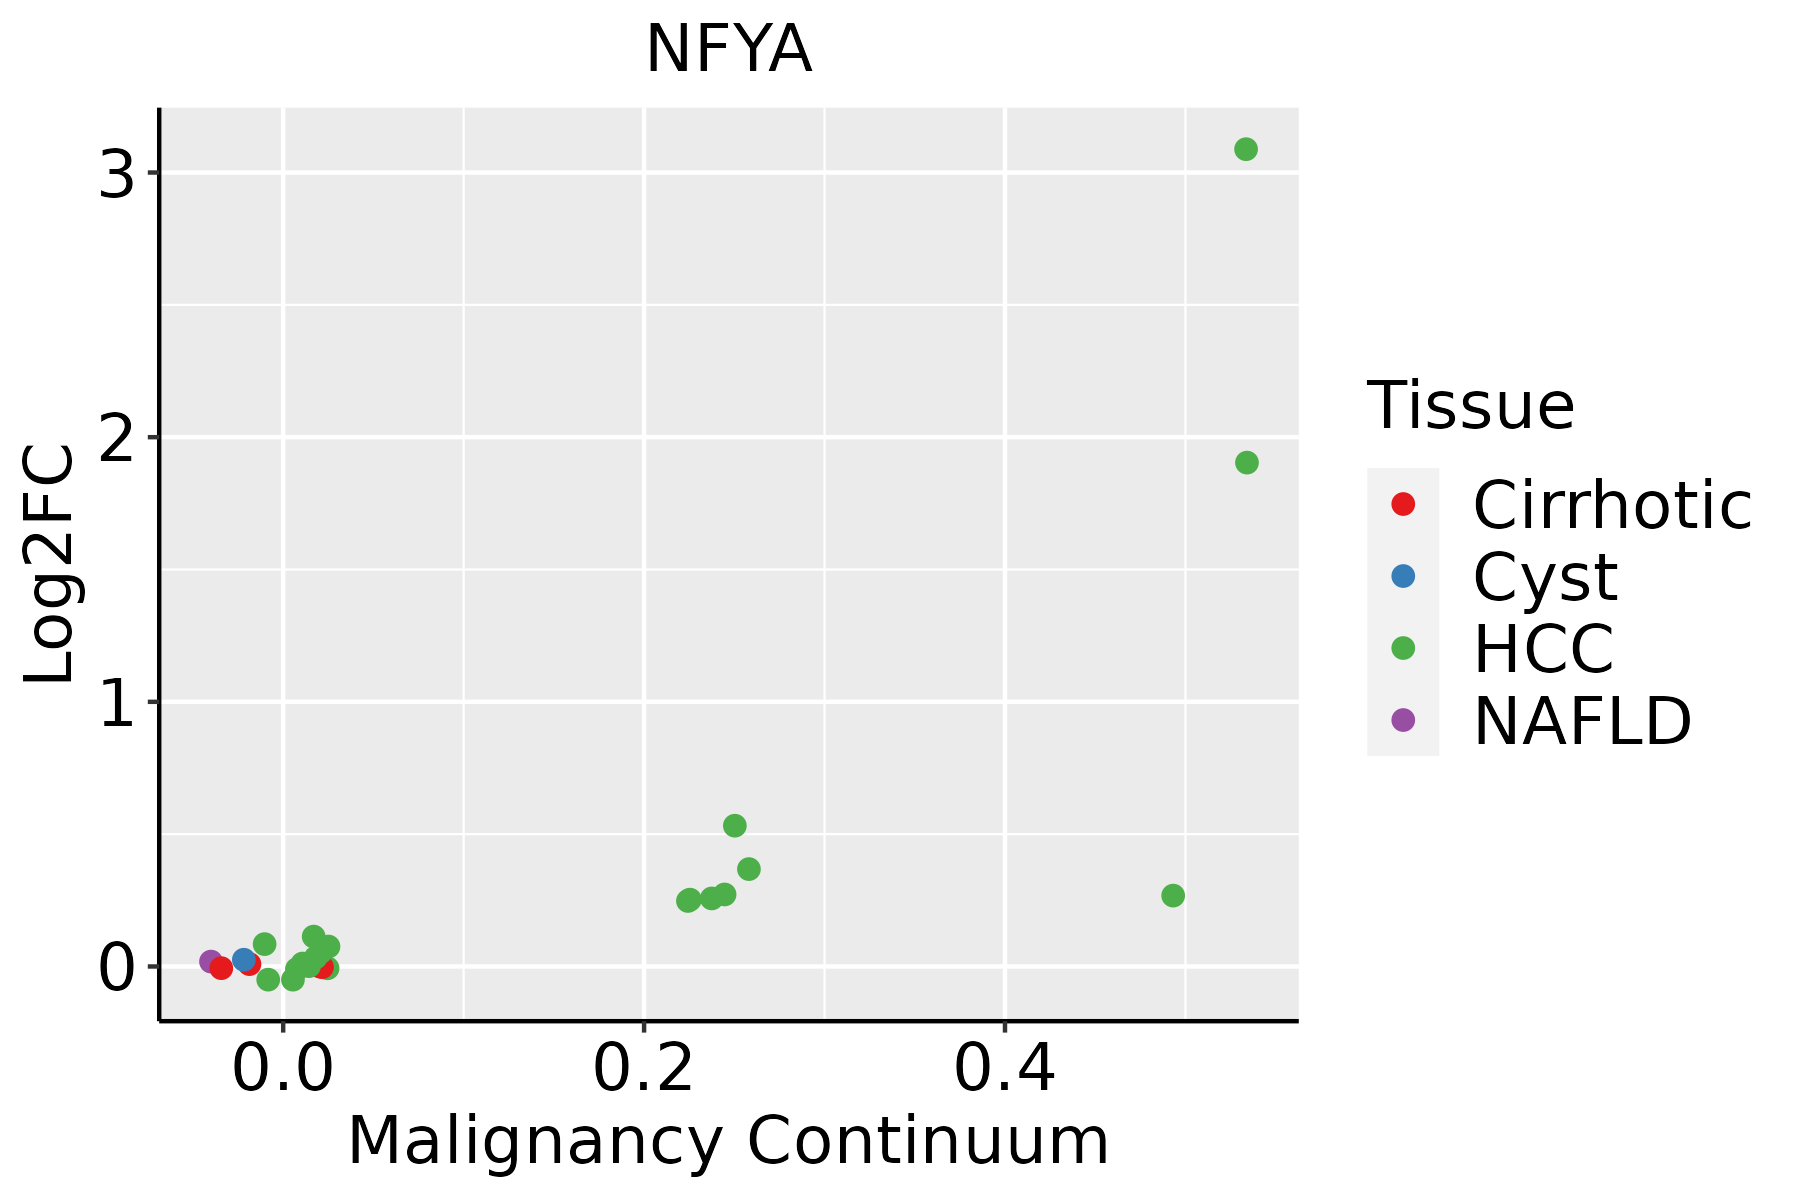 | HCC: Hepatocellular carcinoma |
| NAFLD: Non-alcoholic fatty liver disease |
| ∗log2FC in expression of this searched gene in stem-like cells from each diseased tissue sample relative to stem-like cells in normal samples in each tissue plotted against the malignancy continuum. Samples are colored based on if they are from different disease stage. |
Top |
Malignant transformation related pathway analysis |
| Find out the enriched GO biological processes and KEGG pathways involved in transition from healthy to precancer to cancer |
| Tissue | Disease Stage | Enriched GO biological Processes |
| Colorectum | AD |  |
| Colorectum | SER |  |
| Colorectum | MSS |  |
| Colorectum | MSI-H |  |
| Colorectum | FAP |  |
| ∗Top 15 enriched GO BP terms are showed in the bar plot of each disease state in each tissue. Each row represents a significant GO biological process which is colored according to the -log10(p.adjust). |
| Page: 1 2 3 4 5 6 7 8 9 |
| GO ID | Tissue | Disease Stage | Description | Gene Ratio | Bg Ratio | pvalue | p.adjust | Count |
| GO:004851118 | Esophagus | ESCC | rhythmic process | 164/8552 | 298/18723 | 6.80e-04 | 3.57e-03 | 164 |
| GO:004851121 | Liver | HCC | rhythmic process | 156/7958 | 298/18723 | 3.54e-04 | 2.46e-03 | 156 |
| Page: 1 |
| Pathway ID | Tissue | Disease Stage | Description | Gene Ratio | Bg Ratio | pvalue | p.adjust | qvalue | Count |
| hsa0501728 | Esophagus | ESCC | Spinocerebellar ataxia | 94/4205 | 143/8465 | 6.77e-05 | 2.90e-04 | 1.48e-04 | 94 |
| hsa051527 | Esophagus | ESCC | Tuberculosis | 111/4205 | 180/8465 | 7.14e-04 | 2.32e-03 | 1.19e-03 | 111 |
| hsa0461230 | Esophagus | ESCC | Antigen processing and presentation | 51/4205 | 78/8465 | 3.57e-03 | 9.34e-03 | 4.78e-03 | 51 |
| hsa0501736 | Esophagus | ESCC | Spinocerebellar ataxia | 94/4205 | 143/8465 | 6.77e-05 | 2.90e-04 | 1.48e-04 | 94 |
| hsa0515212 | Esophagus | ESCC | Tuberculosis | 111/4205 | 180/8465 | 7.14e-04 | 2.32e-03 | 1.19e-03 | 111 |
| hsa04612114 | Esophagus | ESCC | Antigen processing and presentation | 51/4205 | 78/8465 | 3.57e-03 | 9.34e-03 | 4.78e-03 | 51 |
| hsa0501721 | Liver | HCC | Spinocerebellar ataxia | 92/4020 | 143/8465 | 3.20e-05 | 1.88e-04 | 1.04e-04 | 92 |
| hsa0501731 | Liver | HCC | Spinocerebellar ataxia | 92/4020 | 143/8465 | 3.20e-05 | 1.88e-04 | 1.04e-04 | 92 |
| Page: 1 |
Top |
Cell-cell communication analysis |
| Identification of potential cell-cell interactions between two cell types and their ligand-receptor pairs for different disease states |
| Ligand | Receptor | LRpair | Pathway | Tissue | Disease Stage |
| Page: 1 |
Top |
Single-cell gene regulatory network inference analysis |
| Find out the significant the regulons (TFs) and the target genes of each regulon across cell types for different disease states |
| TF | Cell Type | Tissue | Disease Stage | Target Gene | RSS | Regulon Activity |
| NFYA | FIB | Lung | Healthy | GTPBP1,NR4A3,FGFBP2, etc. | 4.80e-01 |  |
| NFYA | ADIPO | Lung | IAC | GTPBP1,NR4A3,FGFBP2, etc. | 5.03e-02 |  |
| ∗The dot plots of a searched regulon are shown for all cell subpopulations in each disease state of each tissue based on the regulon specific score inferred using pySCENIC and by calculating the average expression. |
| Page: 1 |
Top |
Somatic mutation of malignant transformation related genes |
| Annotation of somatic variants for genes involved in malignant transformation |
| Hugo Symbol | Variant Class | Variant Classification | dbSNP RS | HGVSc | HGVSp | HGVSp Short | SWISSPROT | BIOTYPE | SIFT | PolyPhen | Tumor Sample Barcode | Tissue | Histology | Sex | Age | Stage | Therapy Types | Drugs | Outcome |
| NFYA | SNV | Missense_Mutation | novel | c.856N>C | p.Glu286Gln | p.E286Q | P23511 | protein_coding | deleterious(0.01) | probably_damaging(1) | TCGA-BH-A0B6-01 | Breast | breast invasive carcinoma | Female | <65 | I/II | Unknown | Unknown | SD |
| NFYA | SNV | Missense_Mutation | c.1012N>C | p.Glu338Gln | p.E338Q | P23511 | protein_coding | deleterious_low_confidence(0.04) | benign(0.043) | TCGA-BH-A0HP-01 | Breast | breast invasive carcinoma | Female | >=65 | III/IV | Chemotherapy | doxorubicin | SD | |
| NFYA | SNV | Missense_Mutation | novel | c.95C>A | p.Ala32Asp | p.A32D | P23511 | protein_coding | deleterious_low_confidence(0) | possibly_damaging(0.908) | TCGA-2W-A8YY-01 | Cervix | cervical & endocervical cancer | Female | <65 | I/II | Chemotherapy | cisplatin | CR |
| NFYA | SNV | Missense_Mutation | c.772G>A | p.Glu258Lys | p.E258K | P23511 | protein_coding | deleterious(0.01) | possibly_damaging(0.85) | TCGA-DR-A0ZM-01 | Cervix | cervical & endocervical cancer | Female | <65 | III/IV | Unspecific | Cisplatin | SD | |
| NFYA | SNV | Missense_Mutation | c.1009N>A | p.Glu337Lys | p.E337K | P23511 | protein_coding | tolerated_low_confidence(0.09) | benign(0.031) | TCGA-EK-A2R8-01 | Cervix | cervical & endocervical cancer | Female | <65 | I/II | Unknown | Unknown | SD | |
| NFYA | SNV | Missense_Mutation | c.831N>C | p.Lys277Asn | p.K277N | P23511 | protein_coding | deleterious(0) | probably_damaging(0.998) | TCGA-EK-A2RK-01 | Cervix | cervical & endocervical cancer | Female | >=65 | I/II | Unknown | Unknown | SD | |
| NFYA | SNV | Missense_Mutation | c.934C>T | p.Arg312Cys | p.R312C | P23511 | protein_coding | deleterious(0) | probably_damaging(1) | TCGA-AA-3494-01 | Colorectum | colon adenocarcinoma | Male | <65 | III/IV | Chemotherapy | folinic | PR | |
| NFYA | SNV | Missense_Mutation | c.934C>T | p.Arg312Cys | p.R312C | P23511 | protein_coding | deleterious(0) | probably_damaging(1) | TCGA-AA-3977-01 | Colorectum | colon adenocarcinoma | Male | >=65 | I/II | Unknown | Unknown | SD | |
| NFYA | SNV | Missense_Mutation | c.722N>A | p.Pro241His | p.P241H | P23511 | protein_coding | deleterious(0) | probably_damaging(0.97) | TCGA-AD-6889-01 | Colorectum | colon adenocarcinoma | Male | >=65 | I/II | Chemotherapy | xeloda | PD | |
| NFYA | SNV | Missense_Mutation | c.205N>A | p.Leu69Ile | p.L69I | P23511 | protein_coding | deleterious_low_confidence(0.01) | possibly_damaging(0.636) | TCGA-CA-6718-01 | Colorectum | colon adenocarcinoma | Male | <65 | I/II | Unknown | Unknown | PD |
| Page: 1 2 3 4 |
Top |
Related drugs of malignant transformation related genes |
| Identification of chemicals and drugs interact with genes involved in malignant transfromation |
| (DGIdb 4.0) |
| Entrez ID | Symbol | Category | Interaction Types | Drug Claim Name | Drug Name | PMIDs |
| Page: 1 |

Copyright 2023-Present -The University of Texas Health Science Center at Houston |